3442
Nonlinear kernel-based fMRI activation detection1Lou Ruvo Center for Brain Health, Cleveland Clinic, Las Vegas, NV, United States
Synopsis
Keywords: fMRI Analysis, fMRI (task based)
Motivation: Kernel Canonical Correlation Analysis (KCCA) is an efficient way to detect brain activation globally with less computational complexity. However, the current KCCA is limited to the linear kernel, and the performance for other more general types of kernels is not completely understood due to a lack of inverse mapping.
Goal(s): This study aims to expand the current KCCA method to arbitrary nonlinear kernels.
Approach: Compute correlation vector r measures the importance of each voxel’s contributing to the signal in kernel space.
Results: Our results suggest that nonlinear kernels, such as the Gaussian kernel, can increase the prediction robustness under voxel shuffling.
Impact: The method proposed in this abstract allows us to get the activation pattern from fMRI for any type of linear or nonlinear kernel mapping.
Introduction
The general linear model (GLM) is commonly used in task fMRI data analysis. Several related methods such as an isotropic GLM with Gaussian Smoothing (GS) [1], Canonical Correlation Analysis (CCA) and Linear KCCA [2-5] have been used to obtain activation maps. Beyond linear methods, nonlinear kernel-based methods, such as the Support Vector Machine (SVM), are very powerful in data classification and prediction [6]. A characteristic of these algorithms is that the original data are transformed into a higher dimensional feature space defined by a scalar product to extract nonlinear features. Though the nonlinear relationships can be assessed in the higher dimensional feature space, there is no method available to define an inverse mapping from the feature space to the original space for obtaining an activation map. In this study, we proposed a general type of BC technique that is based on calculating each voxel’s contribution to the higher-dimensional feature space by differential calculus. This method allows us to get the activation pattern for any type of linear or nonlinear kernel mapping. The new method was applied to real fMRI data for activation analysis.Methods
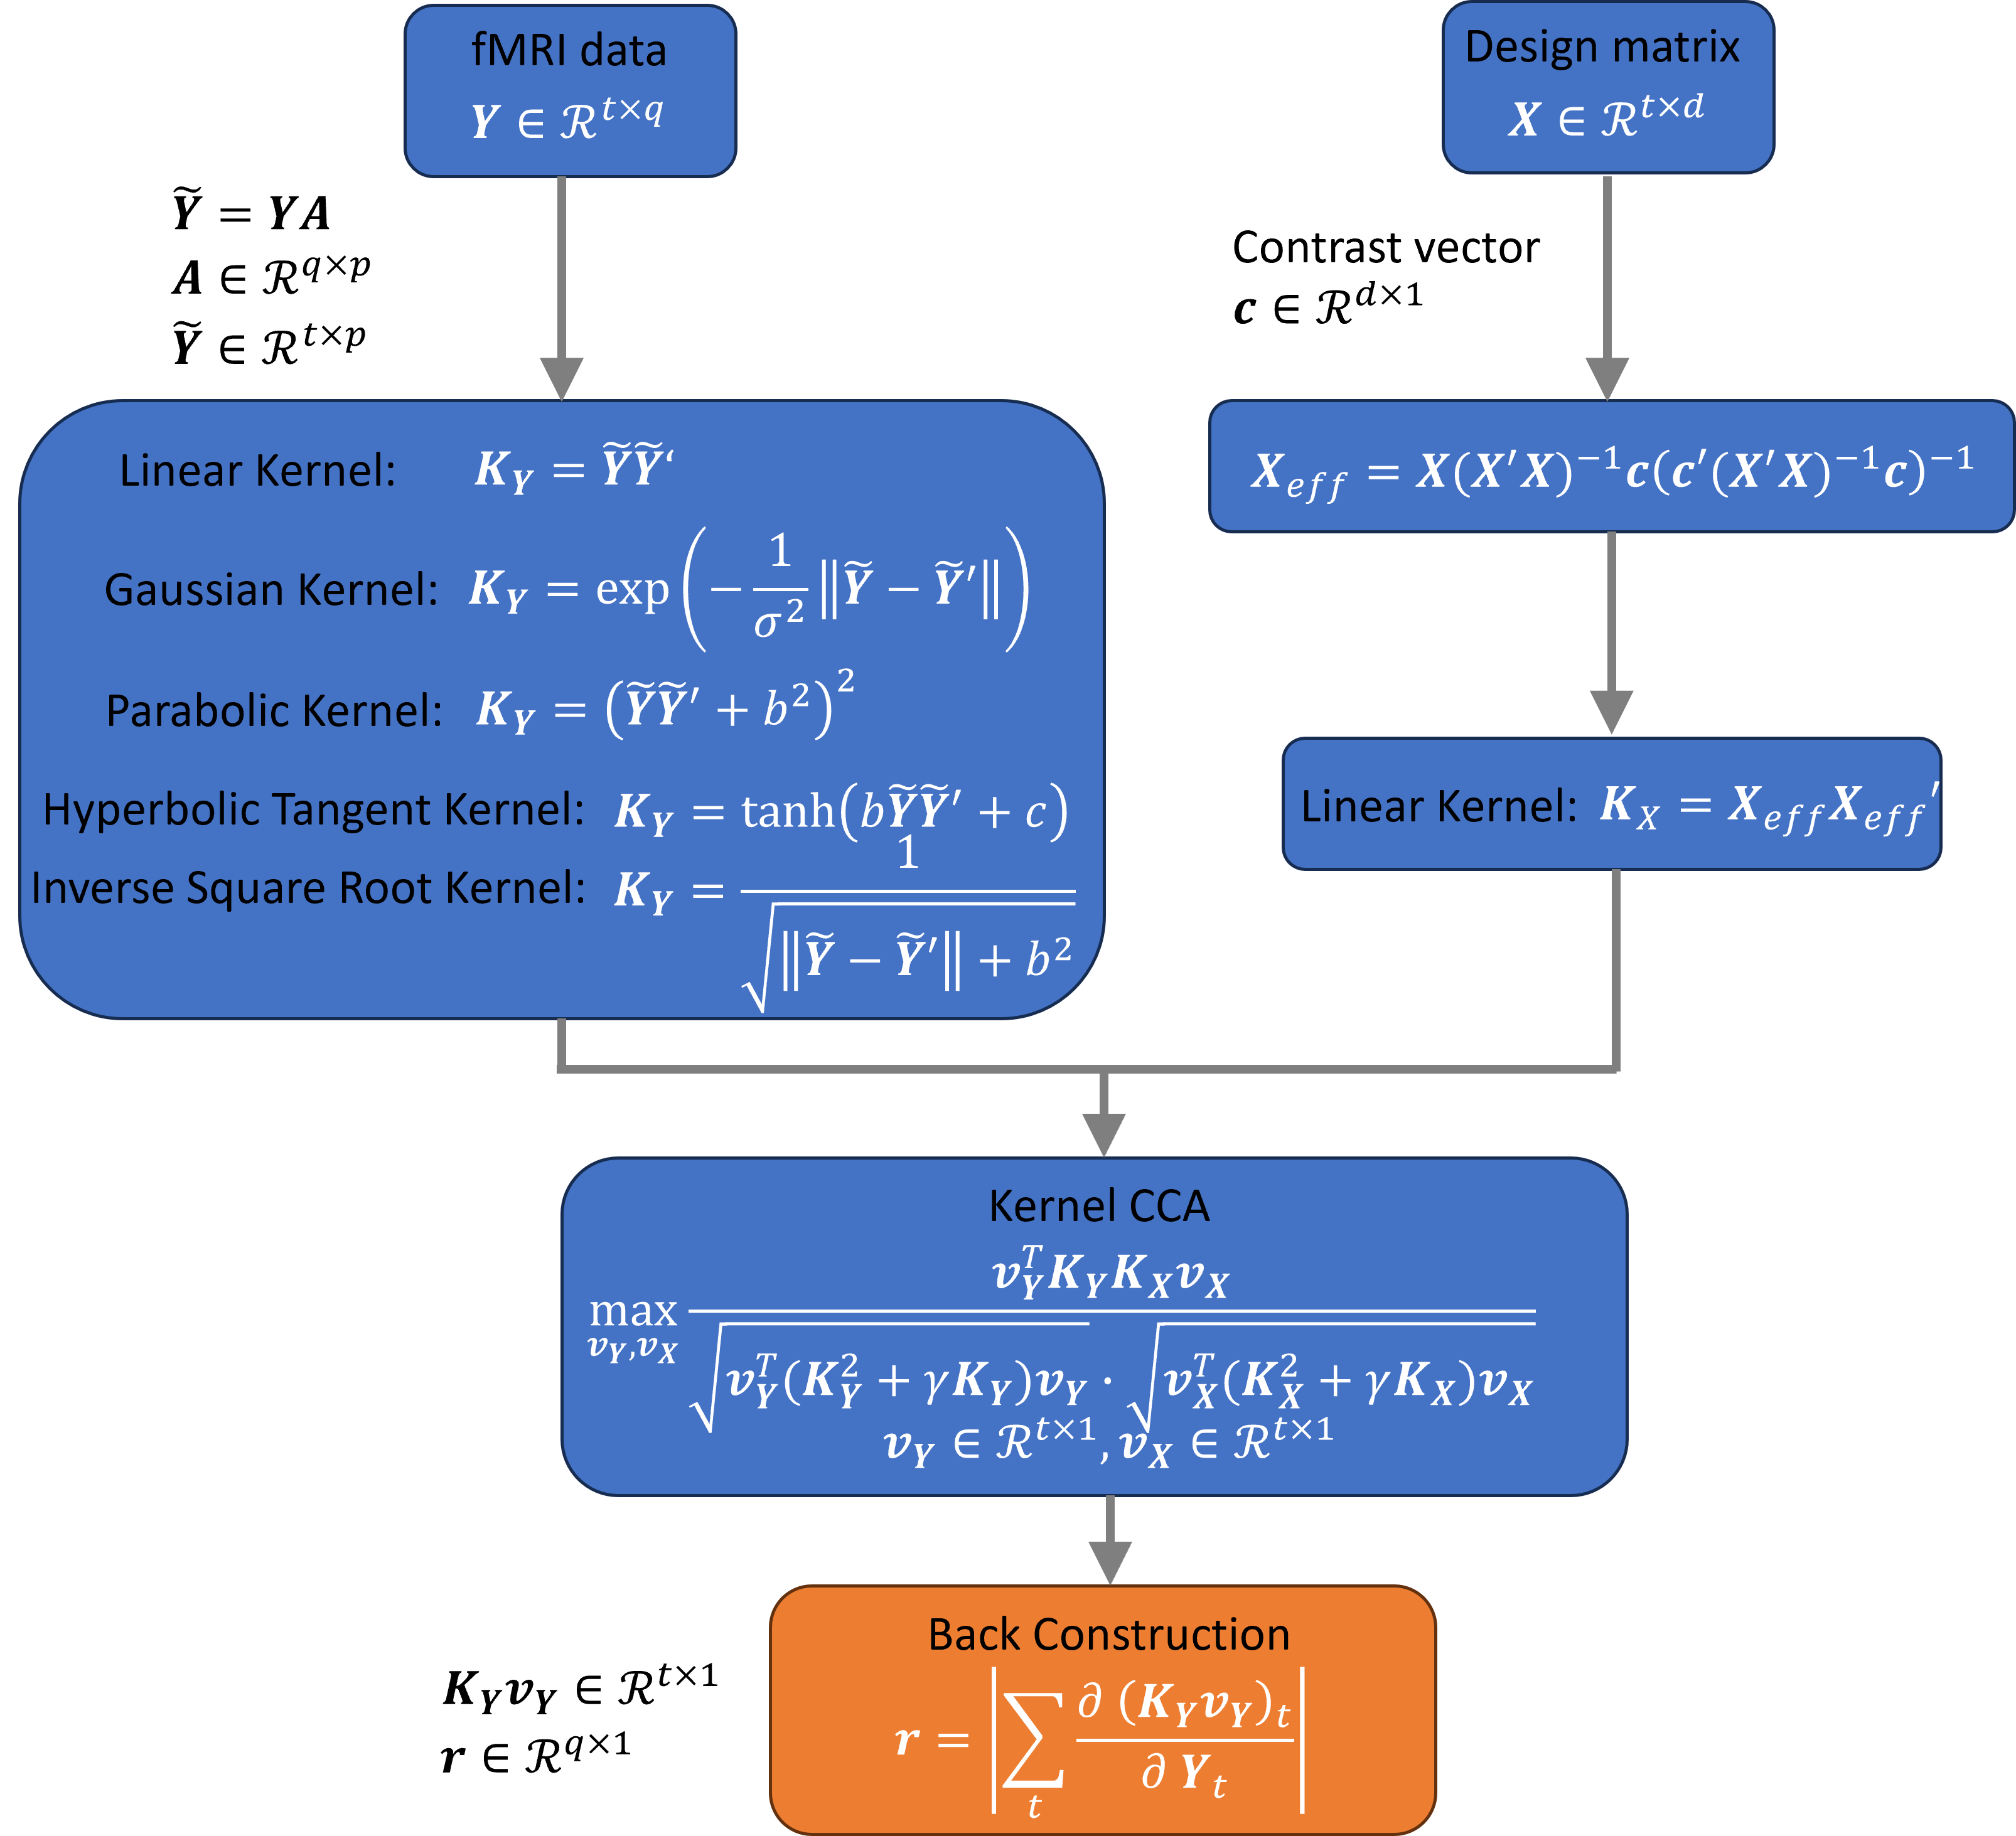
Structural and functional MRI data were obtained from the Human Connectome Project (HCP) database (https://www.humanconnectome.org/) [7], which contains 3T MRI imaging data from 10 males aged 26-30 years old. We focus on the working memory task fMRI study. fMRI data were acquired with 405 timeframes with multiband factor 8, TR/TE=720/33.1ms, flip angle=52 degrees, 72 slices, spatial resolution=2mm$$$\times$$$2mm$$$\times$$$2mm and imaging matrix=104$$$\times$$$90. The data were minimally preprocessed (realignment, slice-timing correction, normalization to MNI, linear detrending). No spatial smoothing was performed. The task itself represents an event-related task design consisting of targets, non-targets, and lures contrasts. A linear mapping of the data from $$$\mathbf{Y}$$$ to $$$\tilde{\mathbf{Y}}$$$ the feature space is done by $$$\tilde{\mathbf{Y}}=\mathbf{Y}\mathbf{A}\in\mathcal{R}^{t\times p}$$$ where $$$\mathbf{A}\in\mathcal{R}^{q\times p}$$$ is the spatial transformation matrix. For an arbitrary design matrix $$$\mathbf{X}$$$, we define the contrast vector $$$\mathbf{c}$$$ based on our interest and map $$$\mathbf{X}$$$ to $$$\mathbf{X}_{eff}$$$ [8]. Then, we choose a suitable kernel function to map the fMRI data into the kernel space represented by $$$K_\mathbf{x}=\mathbf{X}_{eff}\mathbf{X}_{eff}'$$$ and $$$K_\mathbf{Y}=\tilde{\mathbf{Y}}\tilde{\mathbf{Y}}'$$$ where the prime indicates transpose. Using KCCA, the solution vectors $$$\mathbf{v}_\mathbf{X}$$$ and $$$\mathbf{v}_\mathbf{Y}$$$ are found to maximize the canonical correlation $$$corr(K_\mathbf{X}\mathbf{v}_\mathbf{X}, K_\mathbf{Y}\mathbf{v}_\mathbf{Y})$$$ in the feature space with penalty term $$$\gamma$$$ to avoid overfitting [9]. To transform back to the ordinary space, we propose a BC method by $$$\mathbf{r}=\left|\sum_t\frac{\partial (K_\mathbf{Y}\mathbf{v}_\mathbf{Y})_t}{\partial \mathbf{Y}_t}\right|\in \mathcal{R}^q$$$ where the (voxel-specific) correlation vector $$$\mathbf{r}$$$ measures the importance of each voxel’s contributing to the signal in kernel space. For linear kernels this equation reduces to $$$\mathbf{r}=2|\mathbf{A}\mathbf{A}'\mathbf{Y}'\mathbf{v}_\mathbf{Y}|$$$, which is equivalent to the previously published method [10]. For nonlinear kernels, we show that $$$\mathbf{r}$$$ as defined above by differentiation can be treated as a comprehensive way to compute brain activation maps. The voxel-specific components of $$$\mathbf{r}$$$ can then be ranked and converted to percentile scale.Results
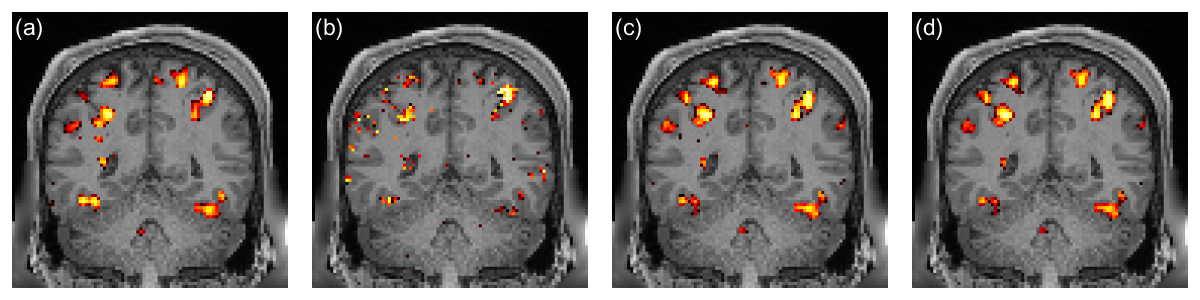
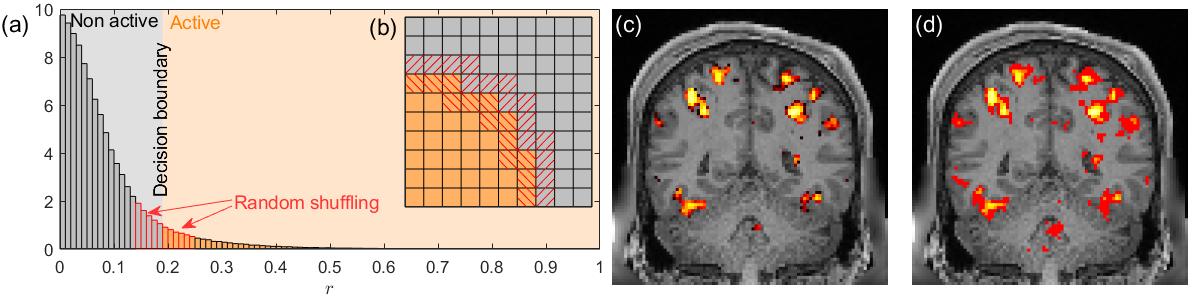
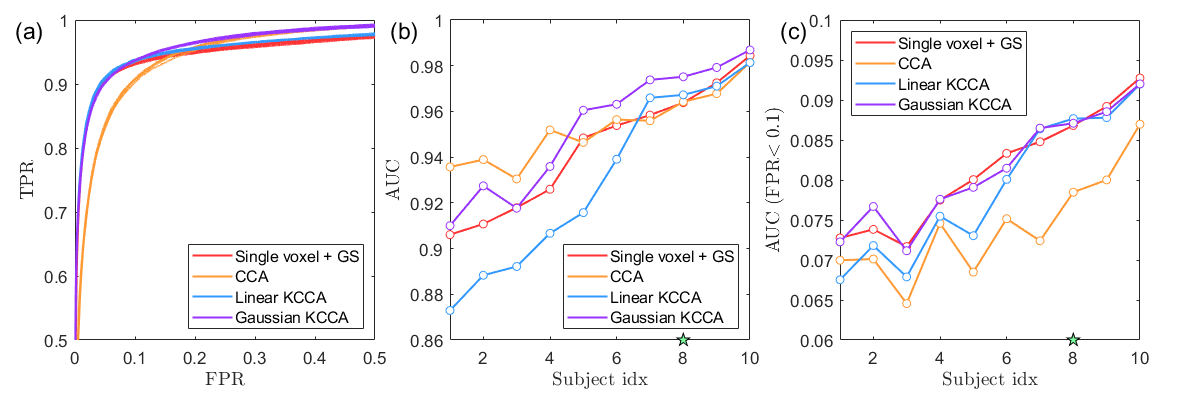
In Figure 2 we show the activation pattern for one selected subject, with the color indicating the top 10% of voxels with the highest values. From left to right the methods are GLM+GS, CCA, KCCA with linear kernel and KCCA with Gaussian kernel. To validate the model performance, we propose a way to generate “apparent ROC curves”. The idea is shown in Figure 3. Based on the BC, we divide the voxels close to the decision boundary into two groups $$$r_{c1}\in (85\%, 90\%)$$$ and $$$r_{c2}\in (90\%, 95\%)$$$. We then randomly shuffle the voxels within each group to get another configuration labeled as $$$\mathbf{Y}^*$$$ and compute the activation pattern $$$\mathbf{r}^*$$$ for $$$\mathbf{Y}^*$$$. By comparing the activation before and after shuffling, parameters such as false positive fraction and true positive fraction can be defined. The idea behind this schema is that isolated activated voxels are rare thus a good method will try to maintain the prediction results even after the voxel location has changed. In Figure 4, we plot the total area for 10 subjects and rank them by the AUC from Linear KCCA. From comparison of the total areas of the apparent ROC curves, we conclude that the nonlinear KCCA increases the prediction robustness compared to linear KCCA.Discussion
The key findings of this study are: 1) The BC is an efficient method to compute activation maps for general types of kernel representations. 2) A nonlinear higher dimensional representation of the data (as done by the Gaussian kernel) can produce more robust results compared with a linear kernel.Acknowledgements
Acknowledgements: This study was funded by NIH-RF1AG071566.References
1. Friman, O., et al., Adaptive analysis of fMRI data. Neuroimage, 2003. 19: p. 837-845.
2. Friman, O., et al., Detection of neural activity in functional MRI using canonical correlation analysis. Magnetic Resonance in Medicine: An Official Journal of the International Society for Magnetic Resonance in Medicine, 2001. 45(2): p. 323-330.
3. Cordes, D., et al., Optimizing the performance of local canonical correlation analysis in fMRI using spatial constraints. Human brain mapping, 2012. 33(11): p. 2611-2626.
4. Zhuang, X., et al., A family of locally constrained CCA models for detecting activation patterns in fMRI. NeuroImage, 2017. 149: p. 63-84.
5. Yang, Z., et al., 3D spatially-adaptive canonical correlation analysis: Local and global methods. Neuroimage, 2018. 169: p. 240-255.
6. Boser, B. E, I., et al., A training algorithm for optimal margin classifiers. Proceedings of the fifth annual workshop on Computational learning theory, 1992. p. 144-152
7. Barch, D.M., et al., Function in the human connectome: task-fMRI and individual differences in behavior. Neuroimage, 2013. 80: p. 169-189.
8. Cordes, D., et al., Optimizing the performance of local canonical correlation analysis in fMRI using spatial constraints. Human brain mapping, 2012. 33: p. 2611-2626.
9. Hardoon, D.R., et al., Canonical correlation analysis: An overview with application to learning methods. Neural computation, 2004. 16: p. 2639-2664.
10. Yang, Z., et al., A global spatially-adaptive method for task fMRI activation analysis with the advantage of alleviated spatial blurring. ISMRM, 2022.
Figures