3441
Modelling the macrovascular contribution to resting-state fMRI functional connectivity at 3 Tesla1Department of Medical Biophysics, University of Toronto, Toronto, ON, Canada, 2Rotman Research Institute at Baycrest, Toronto, ON, Canada, 3Athinoula A. Martinos Center for Biomedical Imaging, Massachusetts General Hospital, Charlestown, MA, United States, 4Department of Radiology, Harvard Medical School, Boston, MA, United States, 5Harvard-MIT Division of Health Sciences and Technology, Massachusetts Institute of Technology, Cambridge, MA, United States, 6Biomedical Engineering, University of Toronto, Toronto, ON, Canada
Synopsis
Keywords: fMRI Analysis, fMRI (resting state)
Motivation: There has been evidence that macrovasculature may bias the analysis of resting-state functional connectivity (FC) and that such a bias may be difficult to remove.
Goal(s): This study intends to demonstrate such an effect can be predicted with a biophysical model.
Approach: We used a biophysical model with experimentally acquired vascular maps to simulate macrovascular effects on functional connectivity estimates from BOLD fMRI.
Results: Our results show that it is feasible to model the macrovascular BOLD contribution to FC through simulation. While both arteries and veins contribute, our model is more accurately captures effects of veins.
Impact: This study aims to demonstrate the feasibility of simulating the BOLD signal in a voxel containing macrovasculature using a biophysical model, which will enable correction of the macrovascular bias in resting-state and other types of fMRI.
Introduction
Macrovascular contributions (particularly from large veins) have been a long-standing challenge in fMRI, limiting its neuronal specificity. In our recent experimental study, we quantified such BOLD fMRI contributions from large veins and arteries1. Various approaches have been developed to minimize the venous BOLD contribution2,3,4. However, previous efforts have not fully characterized whole-brain macrovascular BOLD contributions that should in theory be predictable from first principles. The purpose of this study is to demonstrate the feasibility of predicting experimental macrovascular BOLD signals using biophysical modelling5, and to assess the functional connectivity (FC) resulting from the simulated BOLD signals.Method
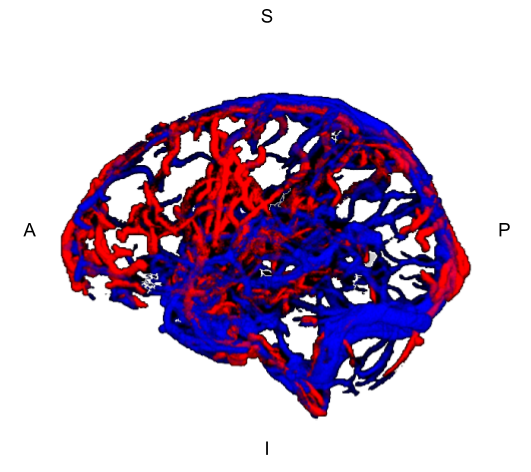
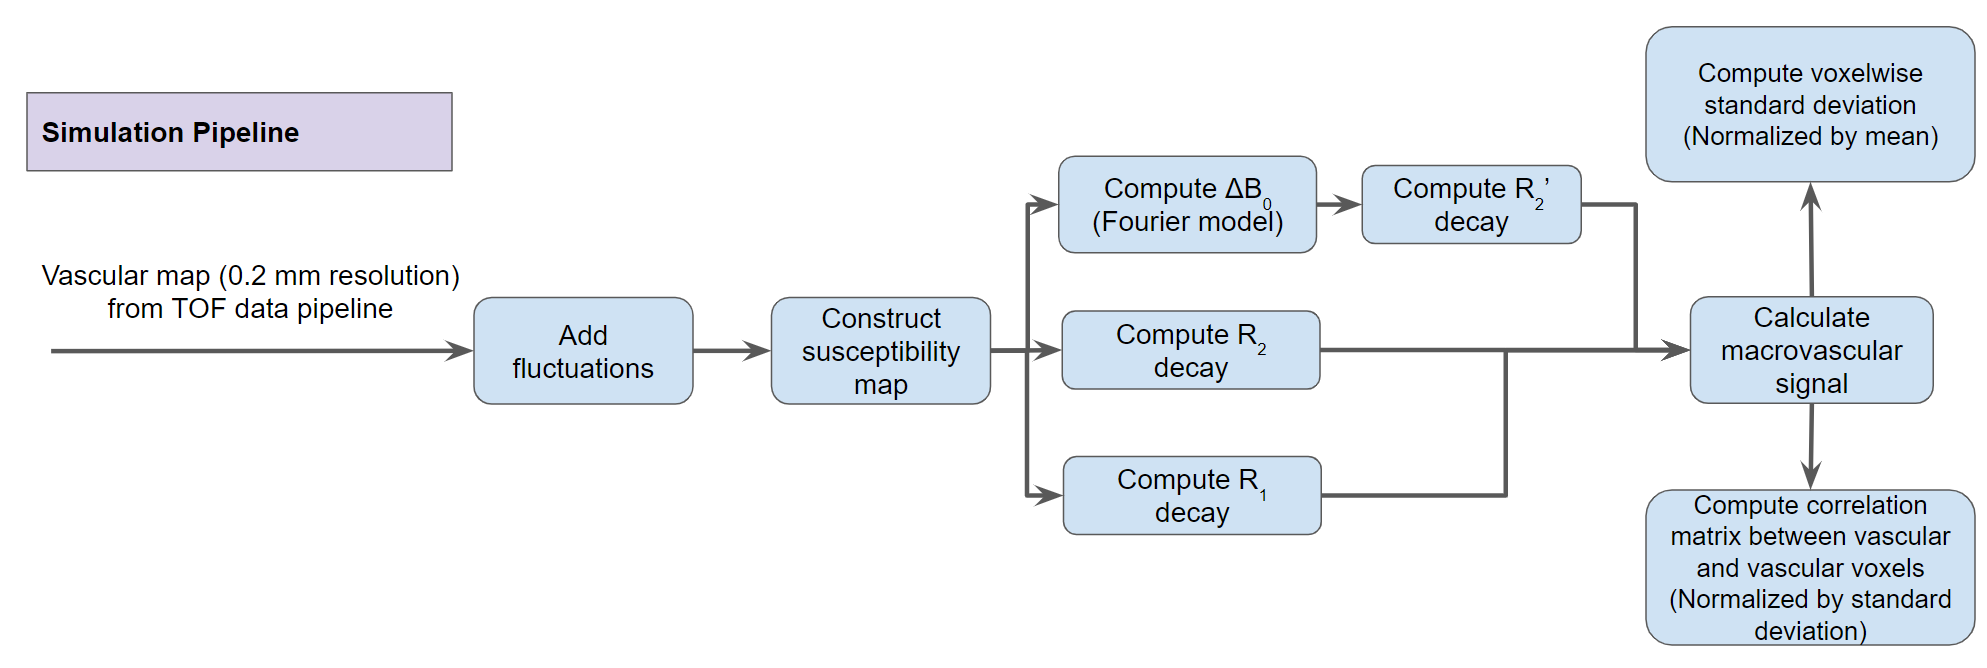
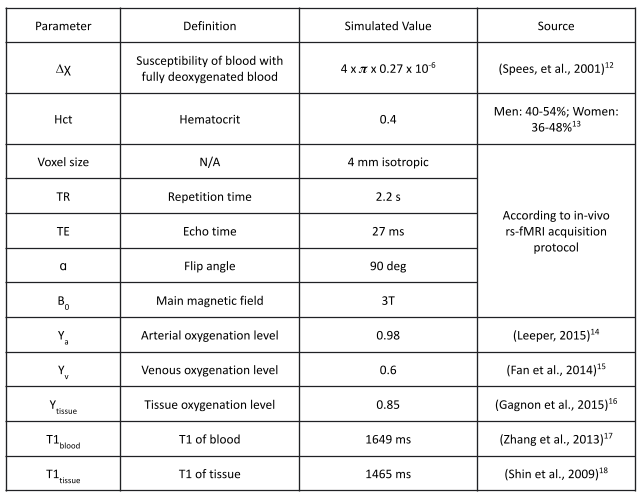
Our approach required macrovascular anatomical networks (mVANs), which were obtained from the Midnight Scan Club (MSC) dataset6, including time-of-flight (TOF) angiograms (Fig. 1), resting-state fMRI (TR=2.2s, TE=27ms, 4mm isotropic) and T1-weighted anatomical data (1mm resolution). Data from four healthy right-handed young participants (2 males and 2 females), ages 28-34, were used in the simulations as a proof of principle. All vascular data were registered to T1 space and then segmented using the Brain Charter Toolbox7, following manual quality control, to produce macrovascular mVANs. The combined centerlines were then upsampled to a resolution of 0.2 mm. Arterial and venous maps were manually separated. BOLD data were registered manually to the T1 using coordinates from AFNI's volume selection function.A magnetic susceptibility map was generated from each of the four mVANs (Fig. 2) using the Fourier method8 (Eq. 1 and 2), with full field-of-view zero-padding. Then, to resample the maps to the fMRI spatial resolution, the simulated phase offset at 0.2 mm resolution was summed across 8000 neighbouring 0.2-mm voxels to calculate the resulting BOLD signal (as per Eq. 3 and 4). Parameters are listed in Fig. 3.
$$ΔBz=FT^{-1}[(\frac{1}{3}-\frac{k_z^2}{k^2})FT(χ)]\:\:\:\:\:(1)$$
$$χ=Δχ·Hct·(1-Y)\:\:\:\:\:(2)$$
$$S_{T_2'}=|\mu(exp(i\gammaΔB_{z}TE))|\:\:\:\:\:(3)$$
$$S=sin(\alpha)\frac{(1-exp(-\frac{TR}{T_1}))}{1-cos(\alpha)exp(-\frac{TR}{T_1})exp(-\frac{TE}{T_2})S_{T_2'}}\:\:\:\:\:(4)$$
FT denotes the Fourier transform, χ the local susceptibility, kz the distance in the k space along the z-axis and k the shortest vector in k-space. R2’ is then calculated through the magnitude of the complex mean magnetization of the dephasing spins resulting from the B0 offset, from which the BOLD signal is calculated using Eq. (3) and (4).
To enable FC calculations, BOLD dynamics were simulated as a 0.1 Hz9 sinusoidal variation for arterial blood-volume fraction (fBV) and venous oxygenation (Y)10,11 assuming no arterial Y and venous fBV variation. To minimize bias, all correlation coefficients were multiplied by the temporal standard deviation (σ). To simulate perivascular BOLD, the arterial and venous masks were dilated by 1-3 voxels in 3D, from which the original vascular masks were subtracted to produce the perivascular masks at different vascular distances.
The rs-fMRI data were preprocessed as described in our preprint1, after which we calculated the voxelwise vascular connectivity as venous-venous, arterial-arterial, and arterial-venous peak cross-correlations (either positive or negative peak).
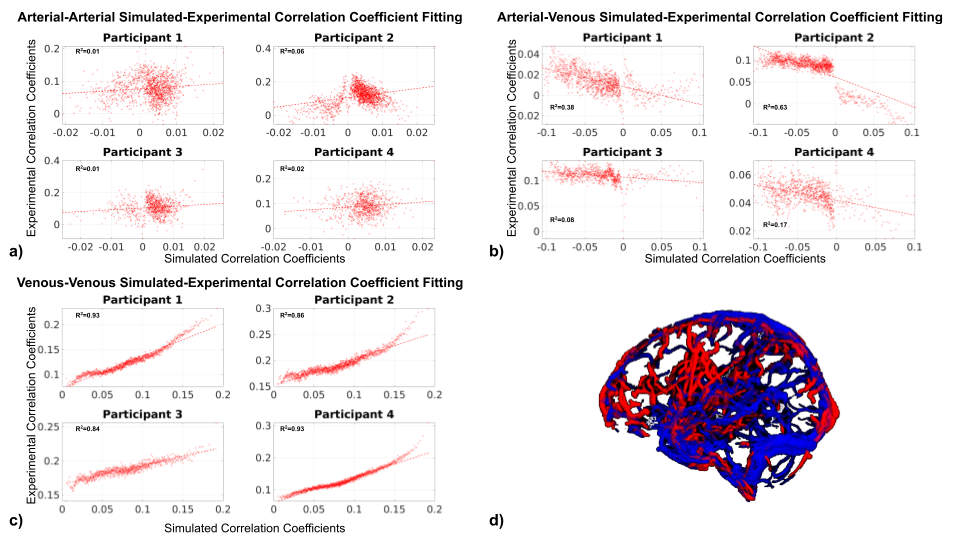
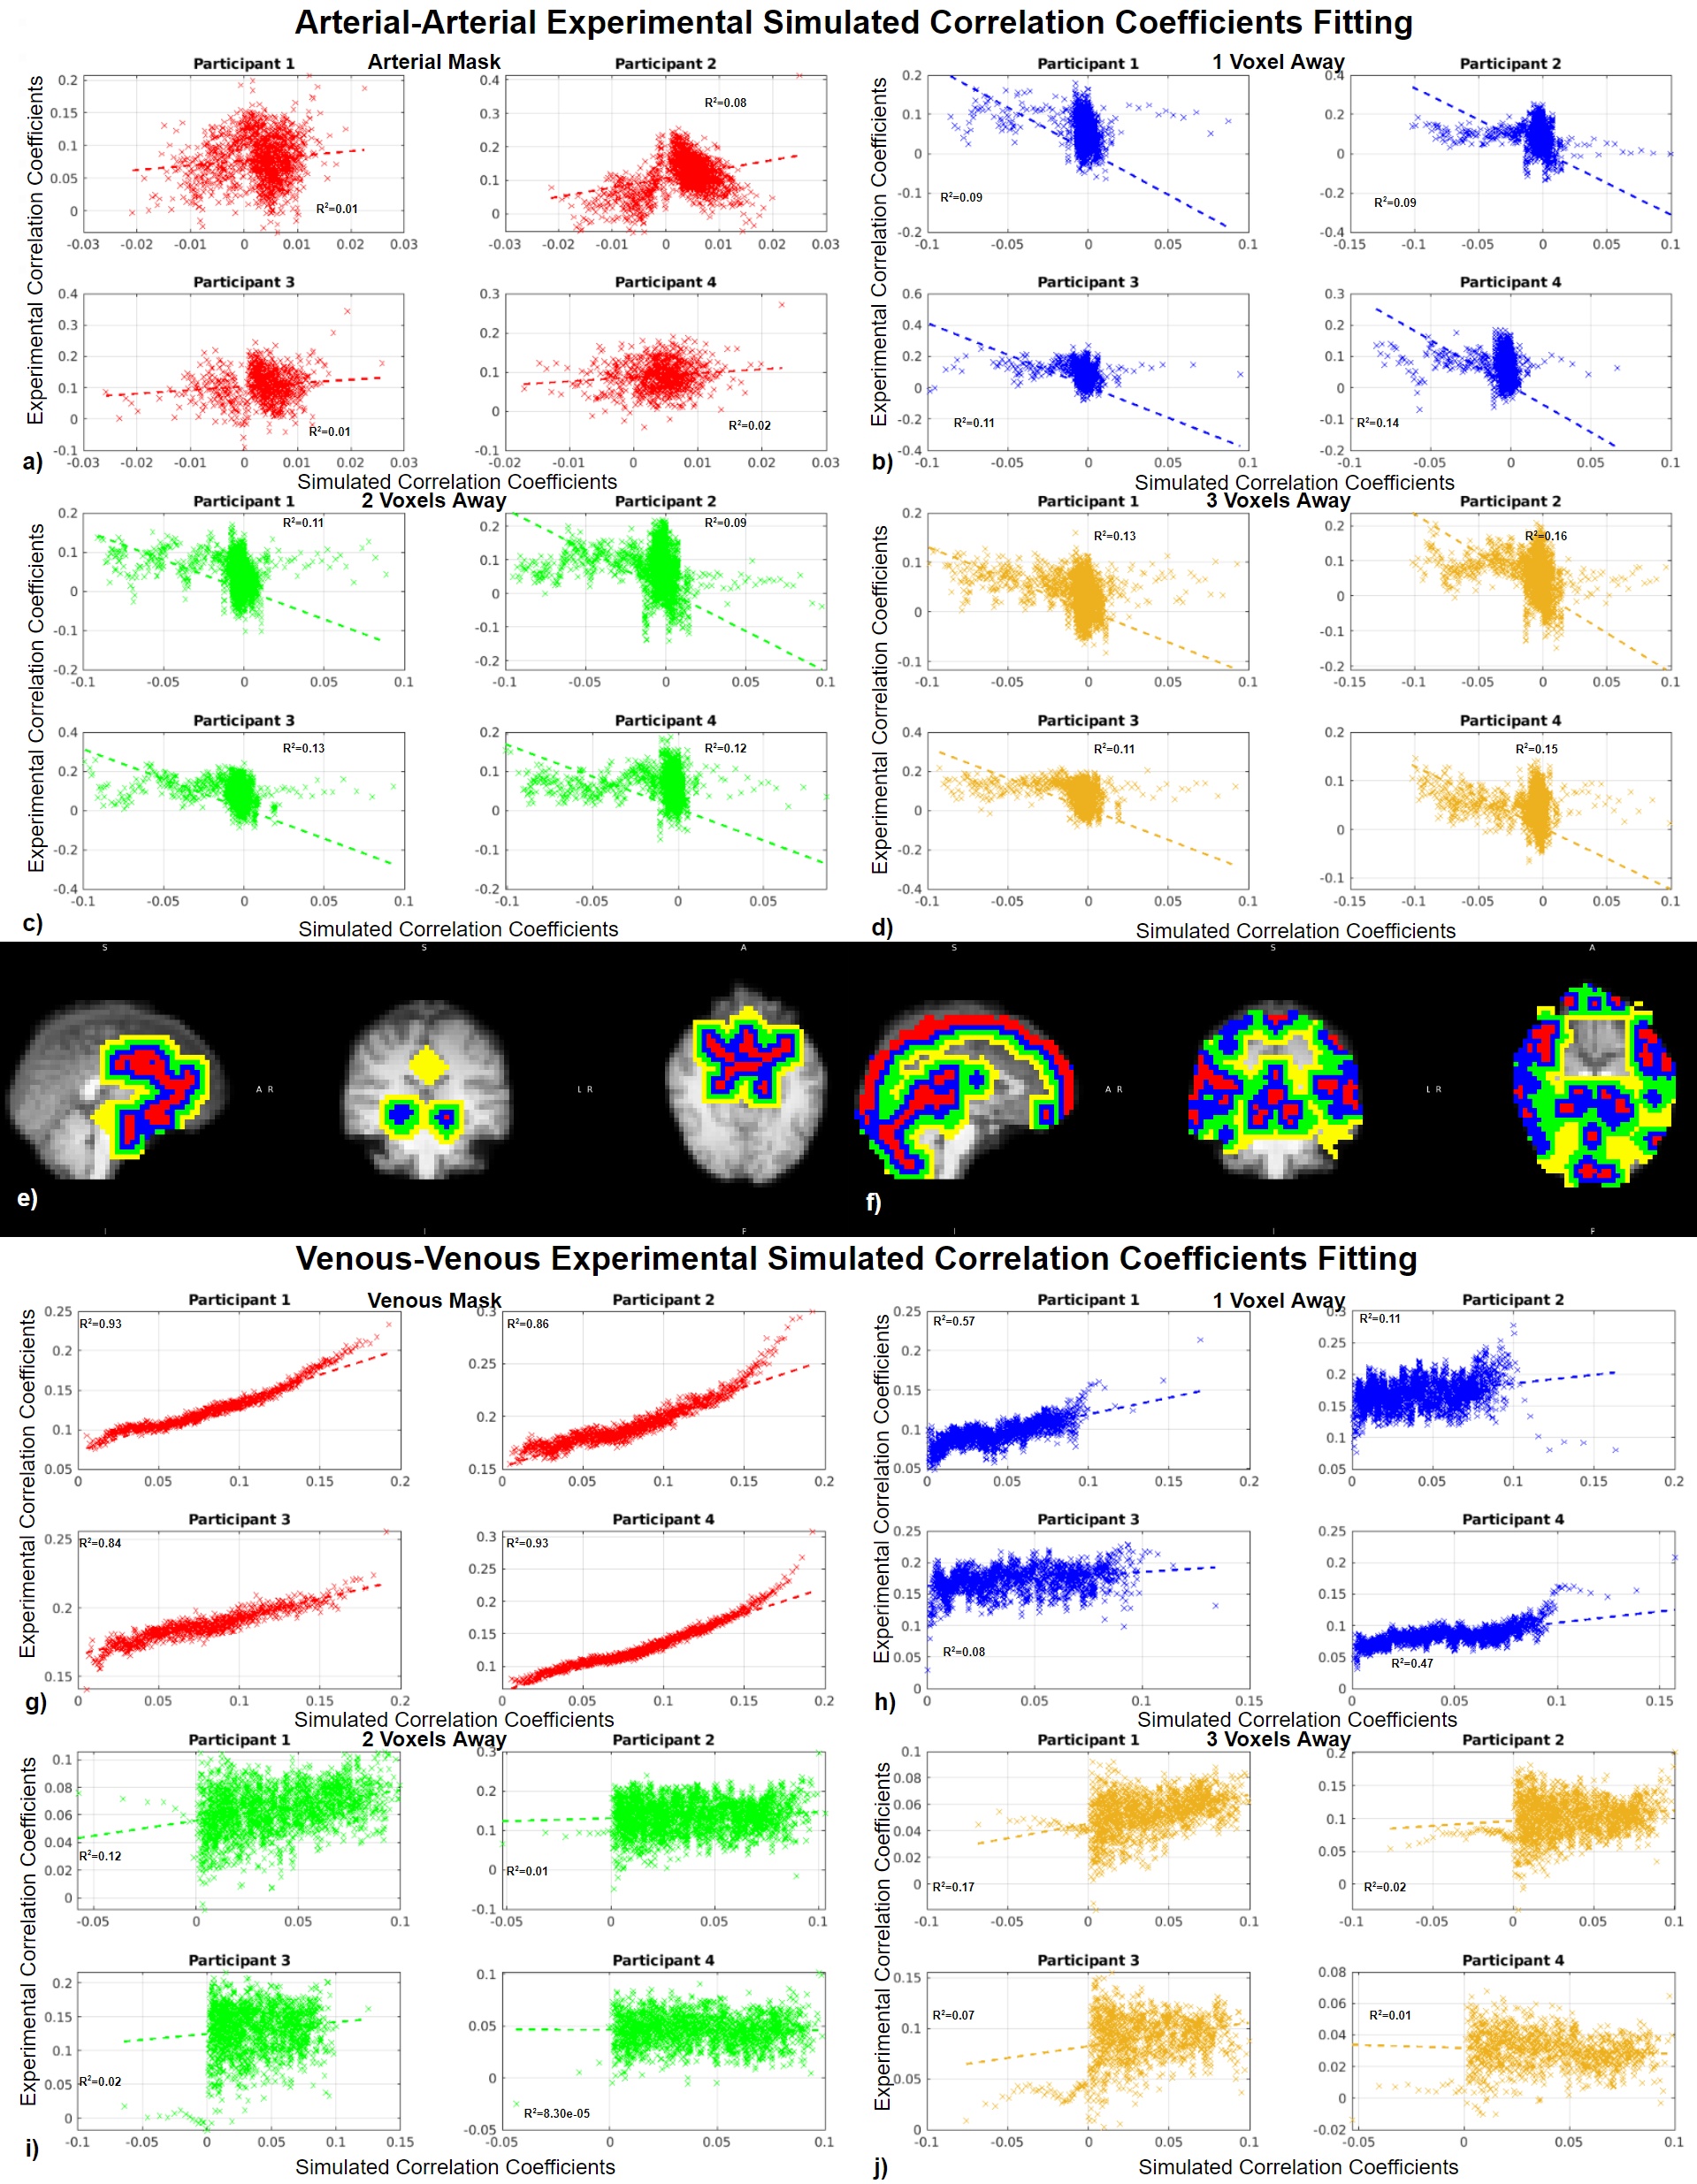
To assess how simulated FC predicts measured FC, linear regression between the simulated correlation coefficients and the experimental correlation coefficients, both of which were binned in ascending order of the simulated correlation coefficients, was performed for each data set. The bin sizes were adapted approximately proportionately to ensure a similar number of fitted data points for all cases.
Results
Despite the inter-subject variability, the following findings are generalizable. The simulated arterial-arterial correlation coefficients showed the lowest predictability of experimental values (R2: 0.01-0.06) (Fig. 4c), followed by arterial-venous correlations (R2: 0.08-0.63) (Fig. 4b). The simulated venous-venous correlation coefficients were the most predictive of experimental values (R2: 0.84-0.93) (Fig. 4a). The perivascular R2 values for venous-venous correlations, while lower than for the vascular ROI, remained high (ranging from 0.08 to 0.57) at one voxel away from the vascular boundary. At two voxels away, however, the venous-venous R2 decreased to only 8.3e-05 to 0.12 (Fig. 5).Discussion
In this study, we demonstrate the prediction of the macrovascular BOLD signal and FC contributions using an mVAN-informed biophysical simulation. Additionally, we found that the biophysical model can accurately predict the BOLD signals for voxels containing large veins, though less accurately for large arteries. Moreover, our model can reasonably predict macrovascular BOLD effects in the surrounding perivascular voxels at up to a 4 mm distance (may vary slightly with voxel size). In light of the current findings, it appears that adjusting correlation coefficients based on simulated correlation coefficients would be the most effective method to minimize the macrovascular bias in rs-fMRI BOLD. However, as the simulations do not account for physiological noise contributions and blood-transit delays rs-fMRI, the correction is only appropriate when considering cross-correlations instead of Pearson’s correlations.Acknowledgements
The authors would like to acknowledge financial support from Canadian Institutes of Health Research and the Canada Research Chairs Program (JJC) and financial support from NIH NIBIB grant P41-EB030006 (JRP).References
1. Zhong, X., Tong, Y. & Chen, J. J. Assessment of the macrovascular contribution to resting-state fMRI functional connectivity at 3 Tesla. bioRxiv 2023.10.19.563131 (2023) doi:10.1101/2023.10.19.563131.
2. Ragot, D. M. & Chen, J. J. Characterizing contrast origins and noise contribution in spin-echo EPI BOLD at 3 T. Magn. Reson. Imaging 57, 328–336 (2019).
3. Stanley, O. W., Kuurstra, A. B., Klassen, L. M., Menon, R. S. & Gati, J. S. Effects of phase regression on high-resolution functional MRI of the primary visual cortex. Neuroimage 227, 117631 (2021).
4. Huck, J. et al. Modeling venous bias in resting state functional MRI metrics. Hum. Brain Mapp. (2023) doi:10.1002/hbm.26431.
5. Bernier, M. et al. Modeling the vascular influences on BOLD fMRI using in vivo brain vasculature: incorporating vessel diameter, orientation, and susceptibility. Proc Intl Soc Mag Reson Med. 29, (2021), 3397.
6. Gordon, E. M. et al. Precision Functional Mapping of Individual Human Brains. Neuron 95, 791–807.e7 (2017).
7. Bernier, M., Cunnane, S. C. & Whittingstall, K. The morphology of the human cerebrovascular system. Hum. Brain Mapp. 39, 4962–4975 (2018).
8. Cheng, Y.-C. N., Neelavalli, J. & Haacke, E. M. Limitations of calculating field distributions and magnetic susceptibilities in MRI using a Fourier based method. Phys. Med. Biol. 54, 1169–1189 (2009).
9. Chu, P. P. W., Golestani, A. M., Kwinta, J. B., Khatamian, Y. B. & Chen, J. J. Characterizing the modulation of resting-state fMRI metrics by baseline physiology. Neuroimage 173, 72–87 (2018).
10. Vazquez, T., Sañudo, J. R., Carretero, J., Parkin, I. & Rodríguez-Niedenführ, M. Variations of the radial recurrent artery of clinical interest. Surg. Radiol. Anat. 35, 689–694 (2013).
11. Uludağ, K. & Blinder, P. Linking brain vascular physiology to hemodynamic response in ultra-high field MRI. Neuroimage 168, 279–295 (2018).
12. Spees, W. M., Yablonskiy, D. A., Oswood, M. C. & Ackerman, J. J. Water proton MR properties of human blood at 1.5 Tesla: magnetic susceptibility, T(1), T(2), T*(2), and non-Lorentzian signal behavior. Magn. Reson. Med. 45, 533–542 (2001).
13. Billett, H. H. Hemoglobin and Hematocrit. in Clinical Methods: The History, Physical, and Laboratory Examinations (eds. Walker, H. K., Hall, W. D. & Hurst, J. W.) (Butterworths, 1990).
14. Leeper, B. Venous Oxygen Saturation Monitoring. in Hemodynamic Monitoring: Evolving Technologies and Clinical Practice (Elsevier Health Sciences, 2015).
15. Fan, A. P. et al. Quantitative oxygenation venography from MRI phase. Magn. Reson. Med. 72, 149–159 (2014).
16. Gagnon, L. et al. Quantifying the microvascular origin of BOLD-fMRI from first principles with two-photon microscopy and an oxygen-sensitive nanoprobe. J. Neurosci. 35, 3663–3675 (2015).
17. Zhang, X. et al. In vivo blood T(1) measurements at 1.5 T, 3 T, and 7 T. Magn. Reson. Med. 70, 1082–1086 (2013).
18. Shin, W., Gu, H. & Yang, Y. Fast high-resolution T1 mapping using inversion-recovery Look-Locker echo-planar imaging at steady state: optimization for accuracy and reliability. Magn. Reson. Med. 61, 899–906 (2009).
Figures