3440
From microscopy data to hemodynamic simulations: a vascular graph approach to understand the fMRI signal formation1UMC Utrecht, Utrecht, Netherlands, 2University of Minnesota, Minneapolis, MN, United States, 3LUMC, Leiden, Netherlands
Synopsis
Keywords: Task/Intervention Based fMRI, fMRI, modeling
Motivation: Understanding the impact of cortical vascular architecture on the spatiotemporal features of hemodynamic responses.
Goal(s): Automatic extraction of realistic cortical vasculature models from microscopy data, and simulation of hemodynamic changes across the extracted vascular network.
Approach: We present a pipeline that utilizes graph theory for extracting the vasculature from microscopy data, representing it as a vascular graph. Simulations were performed using the extracted vascular graphs by converting the connectivity matrix into a dynamic system modeled by RC circuits.
Results: We extracted two realistic vascular graphs and used them to mimic hemodynamic changes resulting from simulated arterial dilation.
Impact: Vascular graphs extracted by the developed pipeline could serve to simulate hemodynamic changes across the cortical vasculature. This provides a tool to enhance fMRI signal interpretation and provide valuable insights into the role of vascular dysfunction in cerebrovascular diseases.
Introduction
Interpretation of fMRI signals requires a deep understanding of the intrinsic biophysical effects induced by the cortical vascular architecture and its functioning. Moreover, this knowledge might help to characterize the contribution of vessel dysfunction to cerebrovascular diseases. Towards this end, we have developed a pipeline that utilizes graph theory to extract realistic virtual models of the vascular architecture from the mouse cortex based on 2-photon microscopy data. Using these realistic vascular models, we simulated hemodynamic changes, e.g. cerebral blood flow, cerebral blood volume, and local blood pressure, caused by a virtual arterial dilation.Methods and Results
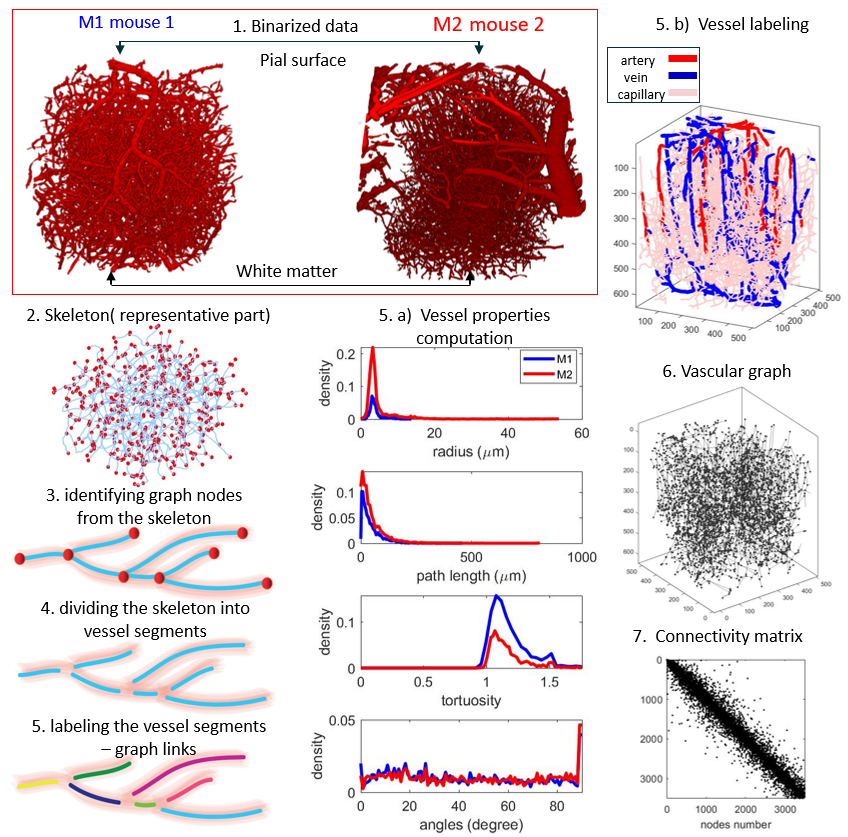
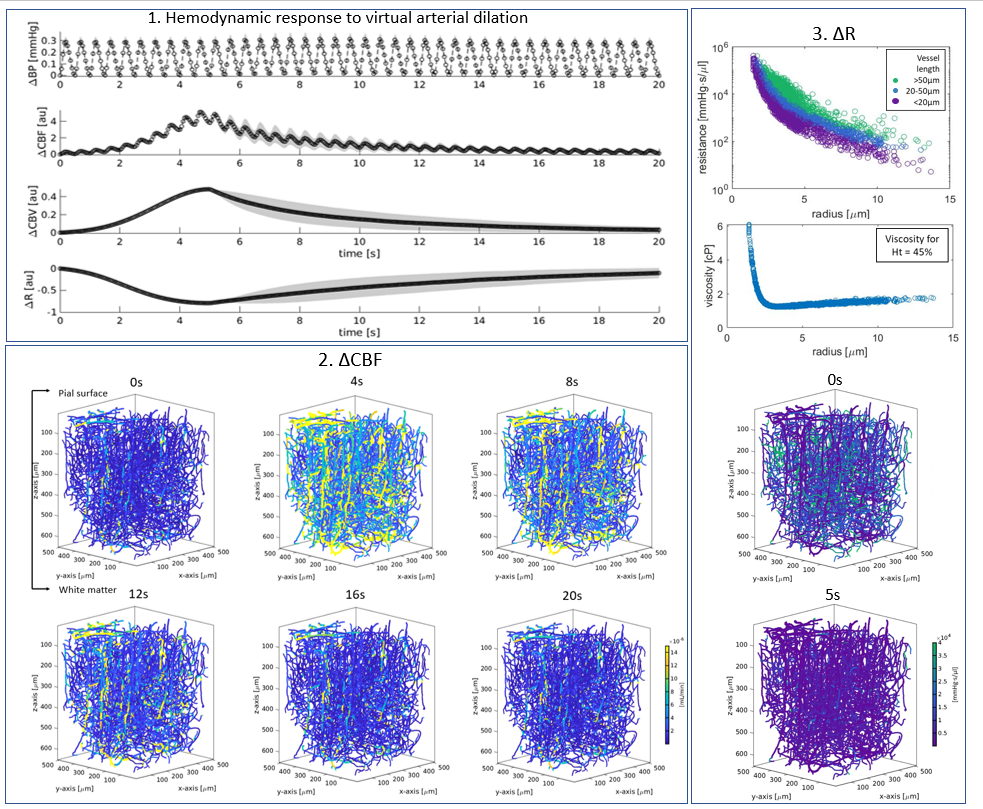
Our pipeline represents the cortical vasculature as a graph composed of nodes and links1. Initially, we extracted the centerlines (skeleton) of the vasculature (Fig 1 panel 2) from two binarized data sets (Fig 1 panel 1). From the skeleton, we identified the branching and ending points of the vessels, which serve as nodes in the vascular graph (Fig 1 panel 3). Using the node coordinates, we divided the skeleton into vessel segments that correspond to the vascular graph links. Next, each segment was labeled with a unique identifier, and its properties (such as radius, length, tortuosity, and the angle with respect to the axes normal to the cortical surface) were computed (Fig 1 panels 4, 5, and 5 a). This information was used to construct the vascular graph (Fig 1. panel 6) which was subsequently converted into a 2D binary connectivity matrix (Fig 1. panel 7). The extracted connectivity matrix accurately represents the vascular topology. Vessels were labeled as arteries, veins, or capillaries (Fig 1 panel 5b) while respecting histological findings on the artery-to-vein ratio in mice cortex and the specific volume fractions of each vessel type 2. Hemodynamic simulations are based on the conservation of energy and they involve converting the graph's connectivity matrix into a connected dynamic system modeled by RC circuits 4. To mimic the hemodynamic response, we simulated a virtual arterial dilation of 50% as a Gaussian with peak dilation occurring at 5s, and heart rate with a frequency of 1.7 Hz. This results in a modification of the vascular resistance throughout the vascular network 3, 4, 6 (Fig 2 panel 3). Considering the blood viscosity, hematocrit, and vessel properties (Fig 2 panel 3), changes in the cerebral blood flow (ΔCBF) and volume (ΔCBV), local blood pressure (ΔBP), and vascular resistance (ΔR) were calculated5. The averaged response to arterial dilation across the whole network is displayed in Fig 2 panel 1.Discussion
Using the developed pipeline, we extracted and described two realistic vascular models from mouse cortex data acquired with two-photon microscopy. The vascular graph approach offers a high degree of flexibility, allowing easy modification of blood vessel characteristics such as radius and compliance. Additionally, it provides the possibility to study hemodynamic changes spatially at any vessel, but also across the whole vascular network. The simulations are based on physiologically relevant assumptions such as that hematocrit is 45%, and blood viscosity is dependent on vessel radius, as shown in Fig 2 panel 3. ΔCBF, ΔCBV, and ΔBP change according to the anatomical and physiological vessel properties (e.g. Fig 2 panel 2). A nonlinear relation between the radius and the vascular resistance is demonstrated together with the dependence on vessel length (Fig 2 panel 3). Note that our vascular model includes vessels running in the boundary of grey matter and white matter (Fig 1 panel 5 b).Conclusion
The presented pipeline offers a flexible approach for extracting realistic vascular models, by converting the vascular architecture into a vascular graph representation. The framework presented here can serve as a valuable approach for investigating how the structure and functional properties of the vasculature affect the spatiotemporal characteristics of the hemodynamic response, thereby facilitating the interpretation of fMRI signals. Moreover, this approach is suitable for simulating different vascular conditions associated with various cerebrovascular diseases.Acknowledgements
No acknowledgement found.References
1. Reichold J et al. Vascular graph model to simulate the cerebral blood flow in realistic vascular networks. J Cereb Blood Flow Metab. 2009;29(8):1429-432. 2. Linninger et al. The capillary bed offers the largest hemodynamic resistance to the cortical blood supply. J Cereb Blood Flow Metab. 2017;37(1):52-68. 3. Boas et al. A vascular anatomical network model of the spatio-temporal response to brain activation. NeuroImage 2008;40(3):1116-1129. 4. Báez-Yáñez MG, Siero JCW, Petridou N. A mechanistic computational framework to investigate thehemodynamic fingerprint of the blood oxygenation level-dependent signal.NMR in Biomedicine. 2023;36(12):e5026. 5. Gagnon L et al. Quantifying the Microvascular Origin of BOLD-fMRI from First Principles with Two-Photon Microscopy and an Oxygen-Sensitive Nanoprobe. J Neurosci 2015;35(8):3663–3675. 6. Hartung et al. Simulated fMRI responses using human Vascular Anatomical Network models with varying architecture and dynamics 2022 Proc. ISMRM 2022, abstract: 0682Figures