3439
Macroscale angioarchitectural properties of functional and structural networks1Department of Cognitive Neuroscience, Maastricht University, Maastricht, Netherlands, 2Brain innovation, Maastricht, Netherlands, 3Neuro-X Institute, École polytechnique fédérale de Lausanne, Geneva, Switzerland, 4Department of Radiology and Medical Informatics (DRIM), University of Geneva, Geneva, Switzerland, 5CIBM Center for Biomedical Imaging, Geneva, Switzerland
Synopsis
Keywords: Functional Connectivity, Multimodal
Motivation: Previous findings from fMRI and from structural microvascular observations link vascular activity or structural organisation with neuronal activity.
Goal(s): To verify whether macrovascular properties are related to functional (FC) and structural connectivity (SC), as well as function-structure coupling (SDI).
Approach: FC and SC node strength, SDI, and vascular density and distance were compared, using a venous atlas, the Human Connectome Project data, and one subject of the Natural Scene Dataset for which we obtained an arteries-dominated vascular map.
Results: Correlations between veins-dominated vascular properties, FC, and SDI, suggest a link between density and proximity of venous structures and connectivity strength of an area.
Impact: Cerebral angioarchitecture is often overlooked in integrated multimodal MRI modelling, but its properties can help understanding the nature of BOLD-fMRI-based “vascular” or “physiological” networks.
Introduction
Since the inception of Resting State (RS) BOLD fMRI1, the study of intrinsic functional organisation, the so-called “functional networks” or “functional connectivity” (FC), became an important approach to study brain activity, even forming a basis for cortical parcellation2,3. Research involving concurrent BOLD fMRI and physiological recordings revealed cortical areas correlating with synchronous physiological fluctuations4,5; such “vascular networks'' seem to support related functional networks activity5. Translated to anatomy, capillaries should support neighbouring neurons and cells6,7, with vascular density correlating with neuronal activity8.We aim at verifying if, at the macroscale level, angioarchitectural properties, relate to structural connectivity (SC), function-structure coupling through structural decoupling index (SDI)9, and total, coupled, and decoupled FC10.
Methods
Group analysis Minimally preprocessed data from the 100 independent subjects release of the Human Connectome Project11 were preprocessed as shown in10. RS timeseries, T1w volumes and diffusion data were used to compute SDI, SC, and total, coupled, and decoupled FC as shown in10 within the Glasser atlas with split hemispheres (360 parcels)3 using nigsp12 (Figure 1). Node strength of SC (SCNS), and all FCs (FCNS) was computed. The density map of the VENAT atlas13 was adopted to mimic a group average venous-dominated vascular density. The vascular tissue probability map was thresholded at .04 to compute geodesic distance from vessels using LayNii14. Average distance and density were computed for all 360 parcels of the Glasser atlas. The nodal spatial correlation between all metrics was then computed.Single-subject analysis Preprocessed data from subject 01 of the Natural Scenes Dataset15 were chosen as pilot single-subject data. T1w, T2w, and Time of Flight (ToF) images were brain extracted, and their intensity folded on a 2D plane16. Manual clustering was carried out on the resulting 2D plane to extract vascular positions with Segmentator17, and vessel masks were further manually corrected with ITK-SNAP18 (Figure 2). Preprocessed fibre tracts and RS timeseries were further processed to match the group level preprocessing and metrics computation. The vessel mask, arteries-dominated, was used in addition to the VENAT atlas, veins-dominated.
Results and Discussion
Figures 3 and 4 show the ROI metric distributions for the group and single-subject data, respectively.Figure 5 shows the spatial correlation between different measures at the group (left) and at the single-subject (right) level. The spatial correlation between SCNS and all FCNSs is overall comparable at the group and at the single-subject level. While group data feature stronger correlation between FCNS and SCNS and weaker correlation between FCNS and decoupled FCNS than single-subject data, the most prominent differences between group and single-subject data lay in the correlation of FCNS and SCNS with vascular properties.
At the group level, FCNS weakly but positively (r=.2) correlates with vascular density and negatively (r=-.27) with vascular distance; SDI shows the opposite trend (r=-.23 and r=.27). These results indicate a tendency for areas with more prominent FC to maximise on blood supply redundancy by increasing vascular density and maximise efficiency by lowering the distance from major vessels, in line with previous hypotheses7.
We expected coupled FCNS to feature strong correlations with vascular properties: coupled FC embeds non-individual-specific characteristics of functional organisation10. Instead, a negligible correlation with vascular density and a low correlation with vascular distance (r=-.2) was found. Little to no link between SCNS or decoupled FCNS and vascular properties was found.
At the single-subject level, the correlations of all metrics with vascular properties based on VENAT are negligible, except a weak positive correlation between SDI and vascular distance (r=.14). Vascular distance based on the subject map weakly correlates negatively with SDI (r=-.12) and positively with FCNS (r=.17) and decoupled FCNS (r=.11).
The opposite relationship of SC and FCs with vascular distance based on VENAT or on the subject-specific vascular map is possibly due to the different nature of the two sets of vessels, venous in the former and arterial in the latter case, since the BOLD contrast is mainly a venous effect. The difference between the single-subject result and the group results indicate how individual-specific vascular properties can be. In the future, we will add all NSD subjects to this analysis to corroborate these findings.
Conclusions
We investigated how macroscale vascular properties relate to multimodal brain connectivity finding weak correlation between them. Our results suggest to better differentiate and further investigate the type of vasculature (arterial vs. venous) that relate with BOLD-fMRI-based FC, while paying attention to individual specificity of vascular properties.Acknowledgements
The authors would like to thank Merel Van Der Thiel for the help with abstract rewordings.References
1. Biswal B, Yetkin F, Haughton V, Hyde J. Functional connectivity in the motor cortex of resting human brain using. Magn Reson Med. 1995;34(9):537-541. doi:10.1002/mrm.1910340409
2. Yeo BTT, Krienen FM, Sepulcre J, et al. The organization of the human cerebral cortex estimated by intrinsic functional connectivity. J Neurophysiol. 2011;106:1125-1165. doi:10.1152/jn.00338.2011.
3. Glasser MF, Coalson TS, Robinson EC, et al. A multi-modal parcellation of human cerebral cortex. Nature. 2016:1-11. doi:10.1038/nature18933
4. Chen JE, Lewis LD, Chang C, et al. Resting-state “physiological networks.” Neuroimage. 2020;213(March):116707. doi:10.1016/j.neuroimage.2020.116707
5. Bright MG, Whittaker JR, Driver ID, Murphy K. Vascular physiology drives functional brain networks. Neuroimage. 2020;217. doi:10.1101/475491
6. Harel N, Bolan PJ, Turner R, Ugurbil K, Yacoub E. Recent Advances in High-Resolution MR Application and Its Implications for Neurovascular Coupling Research. Front Neuroenergetics. 2010;2(September):1-8. doi:10.3389/fnene.2010.00130
7. Uludağ K, Blinder P. Linking brain vascular physiology to hemodynamic response in ultra-high field MRI. Neuroimage. 2018;168(December 2016):279-295. doi:10.1016/j.neuroimage.2017.02.063
8. Woolsey TA, Rovainen CM, Cox SB, et al. Neuronal units linked to microvascular modules in cerebral cortex: Response elements for imaging the brain. Cereb Cortex. 1996;6(5):647-660. doi:10.1093/cercor/6.5.647
9. Preti MG, Van De Ville D. Decoupling of brain function from structure reveals regional behavioral specialization in humans. Nat Commun. 2019;10(1):1-7. doi:10.1038/s41467-019-12765-7
10. Griffa A, Amico E, Liégeois R, Van De Ville D, Preti MG. Brain structure-function coupling provides signatures for task decoding and individual fingerprinting. Neuroimage. 2022;250(November 2021):118970. doi:10.1016/j.neuroimage.2022.118970
11. Glasser MF, Sotiropoulos SN, Wilson JA, et al. The minimal preprocessing pipelines for the Human Connectome Project. Neuroimage. 2013;80:105-124. doi:10.1016/j.neuroimage.2013.04.127
12. Moia S. NiGSP: A python library (and toolbox!) to run Graph Signal Processing on multimodal MRI data. Zenodo. July 2022. doi:10.5281/ZENODO.6855998
13. Huck J, Wanner Y, Fan AP, et al. High resolution atlas of the venous brain vasculature from 7 T quantitative susceptibility maps. Brain Struct Funct. 2019;224(7):2467-2485. doi:10.1007/s00429-019-01919-4
14. Huber L (Renzo) R, Poser BA, Bandettini PA, et al. LayNii: A software suite for layer-fMRI. Neuroimage. 2021;237(February):118091. doi:10.1016/j.neuroimage.2021.118091
15. Allen EJ, St-Yves G, Wu Y, et al. A massive 7T fMRI dataset to bridge cognitive neuroscience and artificial intelligence. Nat Neurosci. 2022;25(1):116-126. doi:10.1038/s41593-021-00962-x
16. Gulban OF. The relation between color spaces and compositional data analysis demonstrated with magnetic resonance image processing applications. Austrian J Stat. 2018;47(5):34-46. doi:10.17713/ajs.v47i5.743
17. Gulban OF, Schneider M, Marquardt I, Haast RAM, De Martino F. A Scalable Method to Improve Gray Matter Segmentation at Ultra High Field MRI. Vol 13.; 2018. doi:10.1371/journal.pone.0198335
18. Yushkevich PA, Piven J, Hazlett HC, et al. User-guided 3D active contour segmentation of anatomical structures: Significantly improved efficiency and reliability. Neuroimage. 2006;31(3):1116-1128. doi:10.1016/j.neuroimage.2006.01.015
Figures
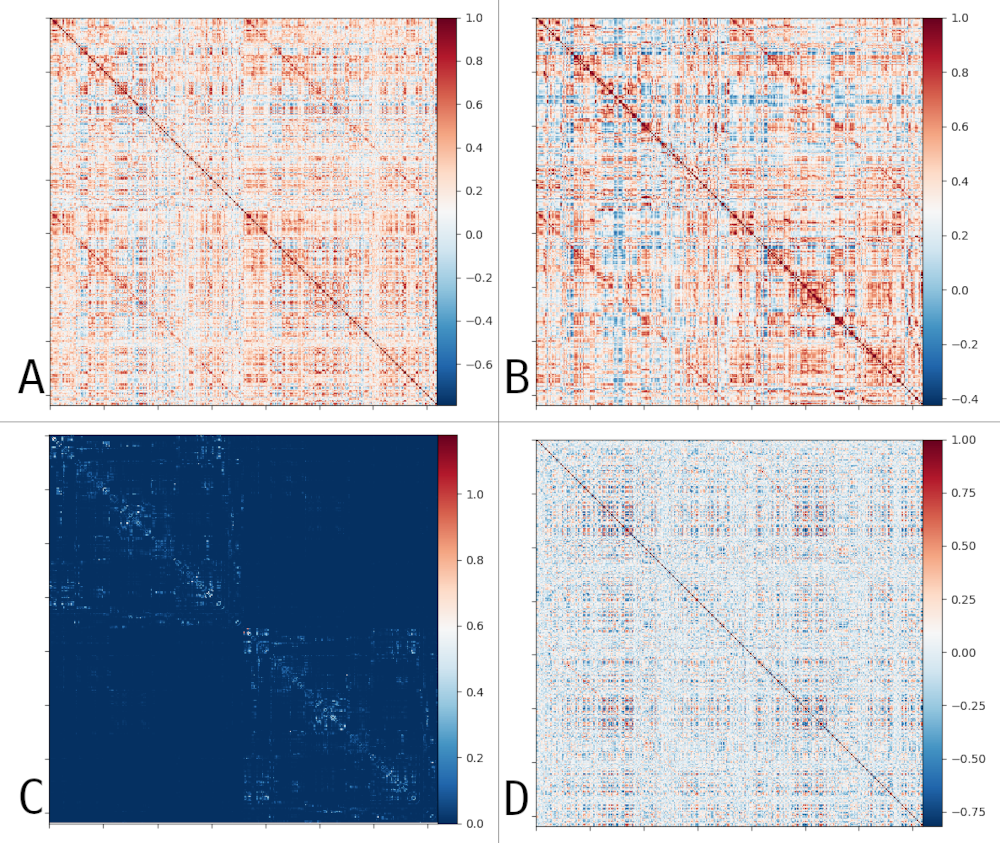
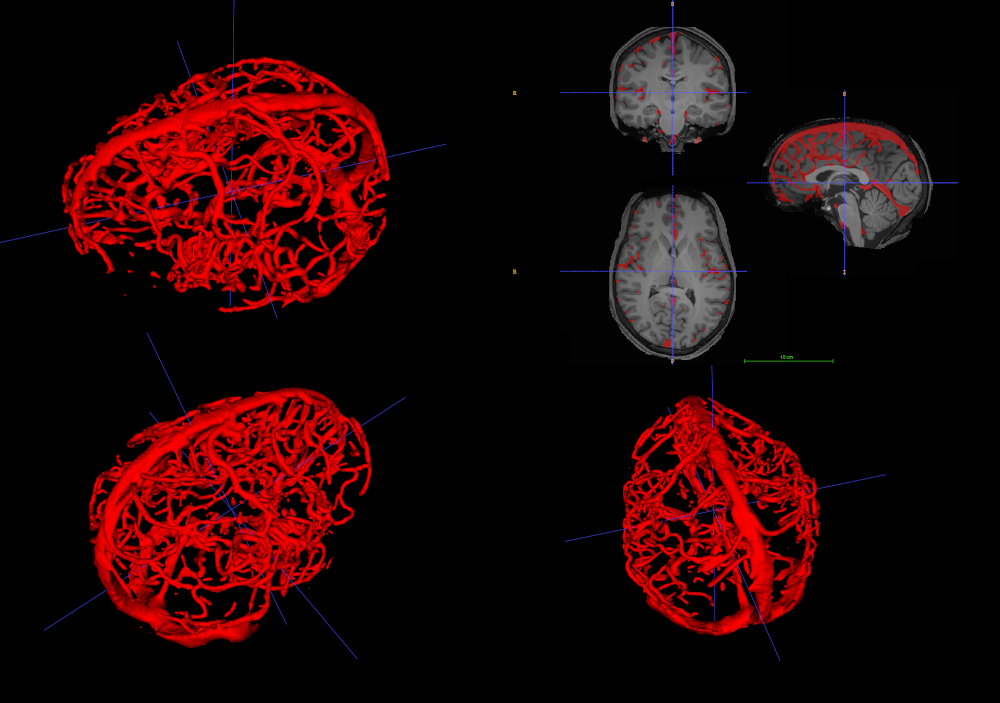
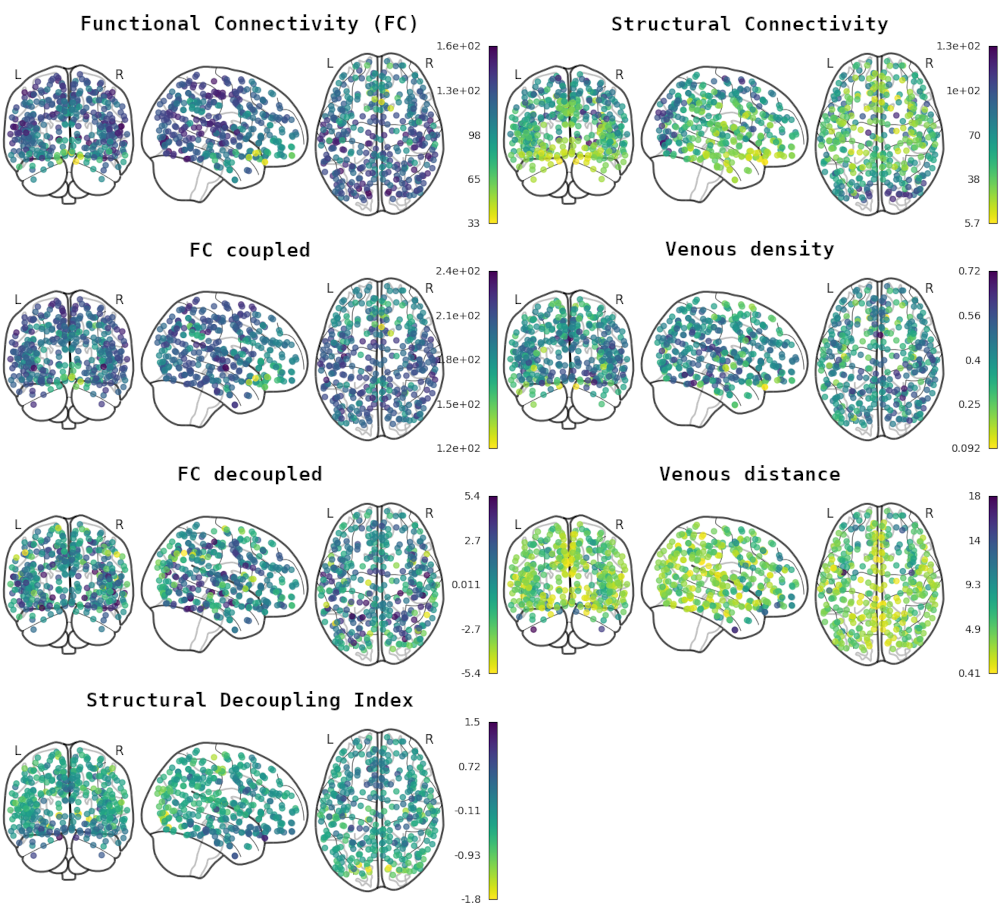
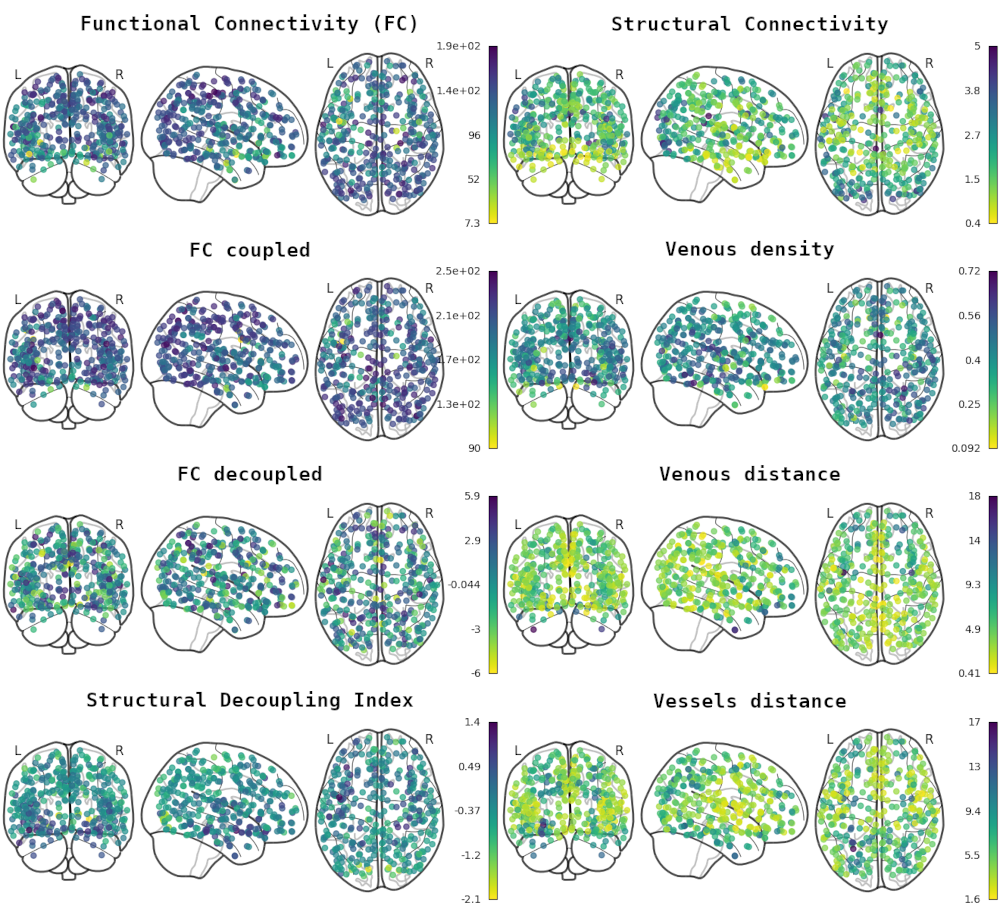
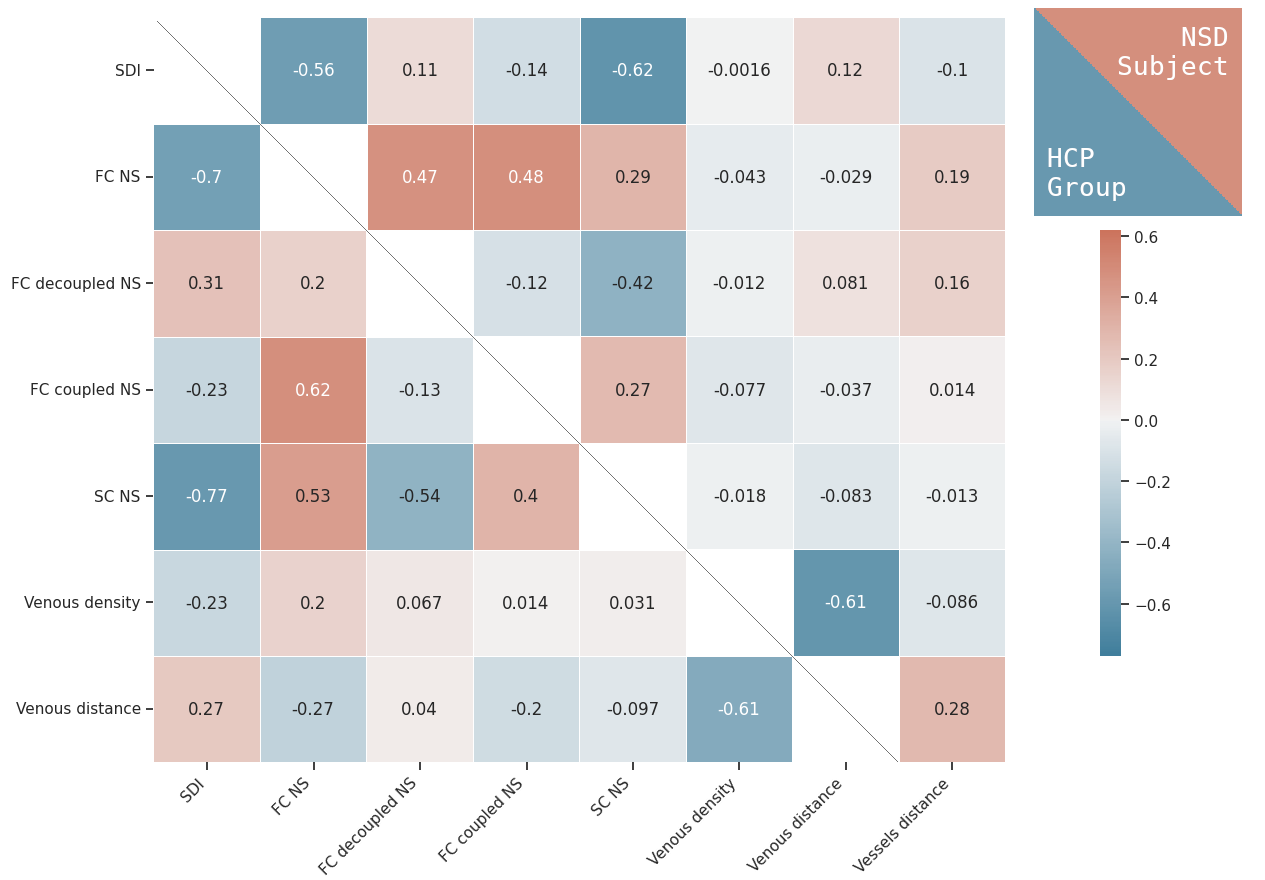
Figure 5: Nodal spatial correlation of connectivity and vascular measures in the two datasets. Upper triangle: NSD data, lower triangle: HCP data. Note the similarity of connectivity correlation across the two datasets, the correlation between veins-dominated vascular properties, FC, and SDI in the HCP dataset but not in the NSD dataset, and the inverse correlation with arteries-sominated vascular properties in the NSD dataset.