3434
QSM-Guided Functional Connectivity of Subcortical Nuclei: A Robust Approach for Parkinson's Disease Diagnosis1Department of Radiology, The Second Affiliated Hospital, Zhejiang University School of Medicine, Hangzhou, China, 2State Key Laboratory of Computer-aided Design & Computer Graphics, Zhejiang University, Hangzhou, China, 3Department of Electrical Engineering and Computer Sciences, University of California, Berkeley, CA, USA., Berkeley, CA, United States, 4MR Research, GE Healthcare, Shanghai, China
Synopsis
Keywords: fMRI Analysis, Neurodegeneration, Quantitative Susceptibility Mapping;Subcortical Nuclei;Registration
Motivation: Conventional rs-fMRI analysis of basal ganglia in Parkinson's disease(PD) relies on T1WI atlases, posing challenges to localizing subcortical nuclei in fMRI.
Goal(s): This study aims to validate a novel method incorporating Quantitative Susceptibility Mapping(QSM) into fMRI analysis for precise subcortical nuclei segmentation.
Approach: fMRI registration to QSM and T1WI respectively in the study. Intraclass Correlation Coefficient and Mutual Information to assess the consistency and accuracy of the two registration approaches. Various Machine learning models utilized functional connectivity derived from two methods for PD classification.
Results: Two methods showed measurement inconsistency. The QSM-guided approach displayed superior accuracy and significantly outperformed in classification models.
Impact: Our study introduces a groundbreaking approach by incorporating QSM into the fMRI analysis of subcortical nuclei in Parkinson’s disease. Shedding light on the potential of the QSM-guided method in capturing meaningful alterations in Parkinson's disease-related neural networks.
Introduction
Parkinson's disease (PD) is a common neurodegenerative disorder characterized by the core injury circuit: basal ganglia -thalamus-cortex neural loop1. Traditional resting-state functional MRI (rs-fMRI) analysis of basal ganglia (BG) in Parkinson's Disease (PD) depends on atlases generated from T1-weighted MRI (T1WI). However, the BG are deep subcortical nuclei in the brain, and accurate localization on images is challenging. Despite numerous research efforts, there are still inconsistencies. Therefore, there is a pressing need for achieving precise localization of subcortical nuclei on fMRI analysis.Notably, Quantitative Susceptibility Mapping(QSM)not only excels in quantifying brain iron content (paramagnetic) and myelin(diamagnetic) but also provides high Signal-to-Noise Ratio (SNR) and Contrast-to-Noise Ratio (CNR) for subcortical nuclei2. This study aims to propose and validate a novel approach utilizing QSM for accurate subcortical nucleus segmentation on fMRI.
Methods
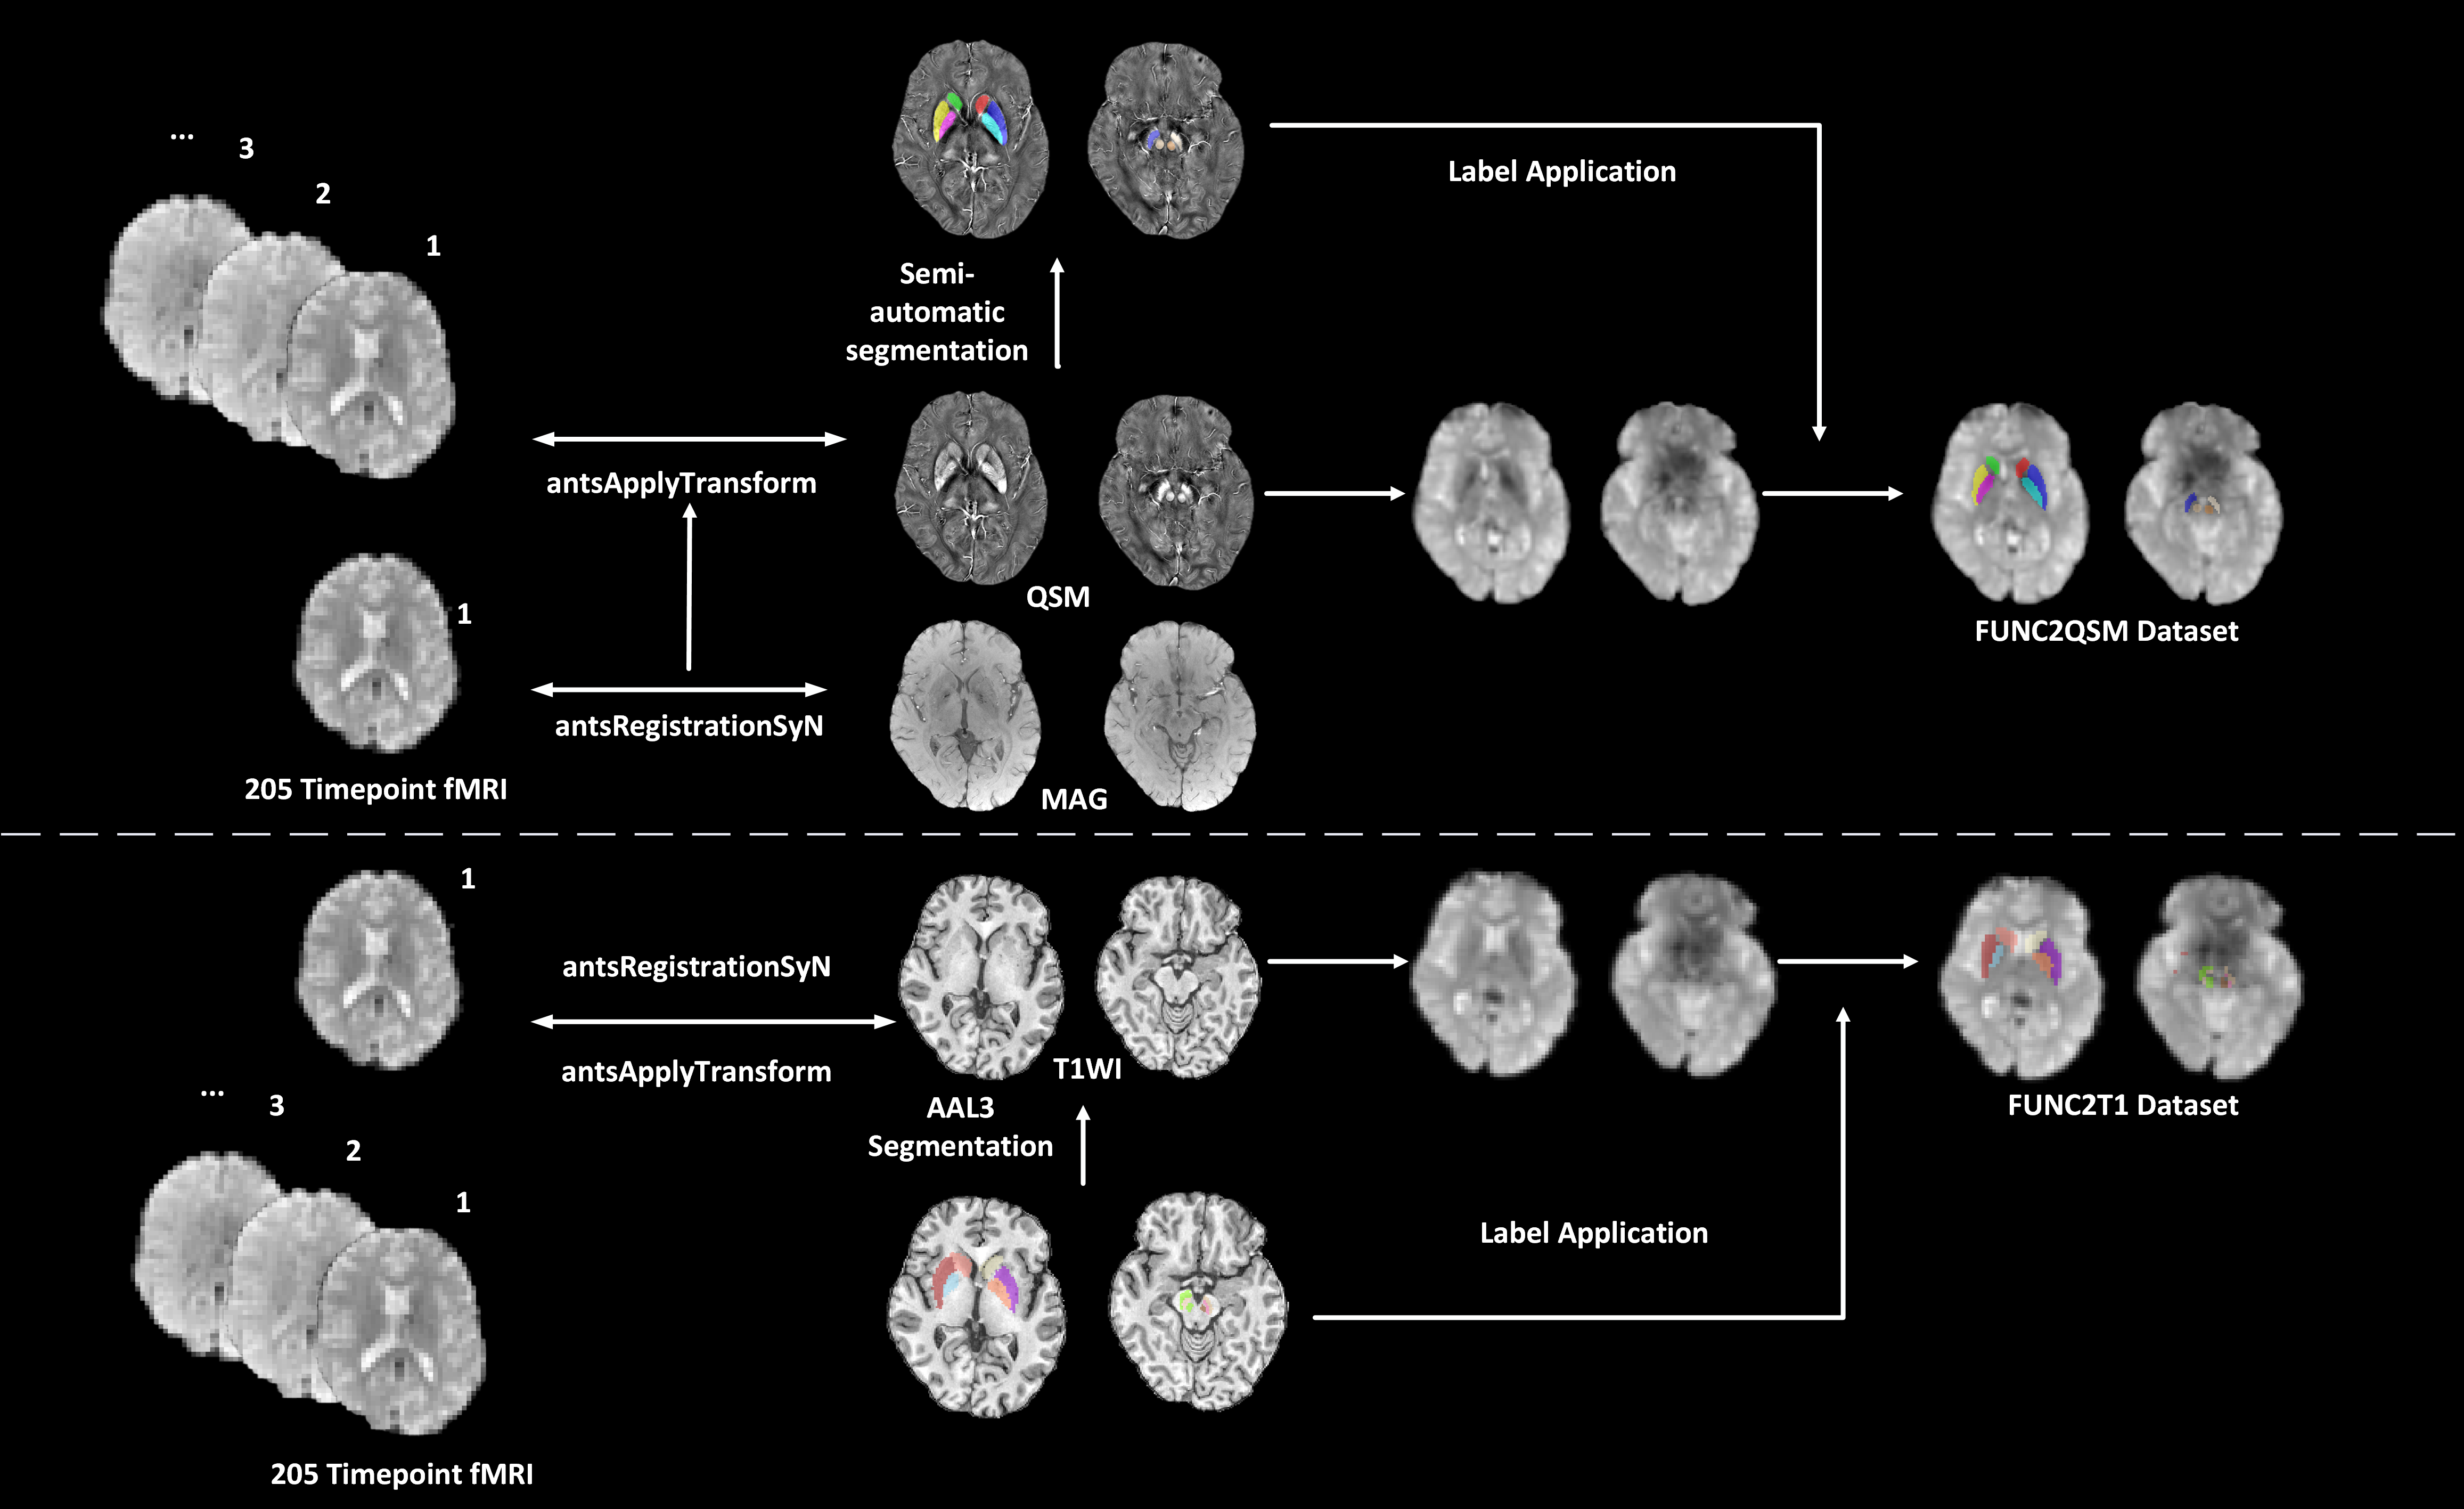
Recruited retrospectively 148 PD patients and 173 normal controls (NC). Participants with a history of neurologic or psychiatric disorders, brain trauma, or exclusion criteria for MR scanning and analyzing were excluded. All participants were scanned on a 3.0 T MRI scanner (Discovery 750) equipped with an 8-channel head coil. T1WI were acquired using a fast spoiled gradient recalled sequence: TR/TE = 7.336/3.036 ms; FOV = 260×260mm2, matrix = 256×256; slice thickness = 1.2 mm. Enhanced susceptibility-weighted angiography (ESWAN) images were acquired using gradient recalled echo sequence: TR =33.7 ms; first echo time/spacing/eighth echo time = 4.556/3.648/30.092 ms; FOV = 240×240mm2, matrix =416×384; slice thickness = 2 mm; 64 continuous axial slices. Rs-fMRI were acquired using gradient recalled echo-echo planar imaging sequence: repetition time = 2000 ms; echo time = 30 ms; FOV = 240×240mm2, matrix = 64×64; slice thickness = 4 mm.Advanced Normalization Tools (ANTs), a popular medical image registration toolkit, was employed for the study. Bilateral subcortical nuclei (caudate, putamen, globus pallidus, red nucleus, and substantia nigra) were delineated on QSM by using a semi-automatic segmentation method on the ANTs-R language environment as shown in the previous study3. The mean magnitude image with optimal SNR was selected as an intermediary for fMRI and QSM registration. Additionally, fMRI and T1WI were also co-registered, using the Automated Anatomical Labeling Atlas 34 for nuclei localization. ANTs-SyN algorithms5 are used to complete all image co-registration work (See Figure 2. for the flowchart). All the automatically segmented data were checked and revised manually by an experienced neuroradiologist. ROI-based functional connectivity (FC) within 5 pairs of subcortical nuclei was extracted from two registration methods creating FUNC2QSM and FUNC2T1 datasets.
- Intraclass Correlation Coefficient (ICC)6 and Mutual Information7 value are calculated to evaluate the consistency and accuracy of the two methods.
- FC matrix differences between PD and NC across nuclei were compared on the two datasets.
- All FCs served as features input to diverse machine learning (ML) classification models for PD patient classification, and the DeLong test is used to compare the receiver operating characteristic-area under the curve (ROC-AUC) of models on two datasets.
Results
- ICC≥0.41 was observed in 55.6% of FC, while only 6.67% of FC had ICC≥ 0.61, indicating two methods have poor measurement consistency.
- The proposed QSM-guided approach achieved a high mutual information value (0.90) compared to the FUNC2T1 dataset (0.73), signifying superior cross-modal registration accuracy.
- The distribution patterns of significant FC from the two datasets varied greatly, showing methodological heterogeneity. Only two commonalities with significant differences stood out: In both datasets, compared with NC, the FC between the right caudate and the left globus pallidus was reduced (FUNC2QSM: p < 0.001, FUNC2T1: p < 0.01), and the FC between the right putamen and the right globus pallidus was increased in PD patients (FUNC2QSM: p < 0.05, FUNC2T1: p < 0.01)
- All machine learning models exhibited better performance in the FUNC2QSM dataset than in the FUNC2T1 dataset. Particularly in the Logistic Regression, achieved an accuracy of 72.3% in the testing group, and demonstrated significantly superior performance in FUNC2QSM compared to FUNC2T1, with a higher ROC-AUC of 0.79. (p <0.05)
Discussion
The Intraclass Correlation Coefficient results showed that the functional connectivity measurements of the two methods were poorly consistent, thus robust and accurate approaches are needed. Furthermore, the machine learning classification models showcase the preliminary practical implications of our findings, demonstrating superior performance when utilizing FC features extracted from the FUNC2QSM dataset. The enhanced accuracy provided by QSM-guided localization of subcortical nuclei contributed to the improved discriminative power of these models.Conclusion
The QSM-guided approach holds promise for truly capturing the functional signals status of the basal ganglia, helping our understanding of the underlying PD-related neural mechanisms and offering the potential for developing neuroimaging biomarkers for Parkinson's disease.Acknowledgements
This work was supported by the National Natural Science Foundation of China (Grant Nos. 82271935, 81971577, 82171888, 82202091 and 82001767), the Natural Science Foundation of Zhejiang Province (Grant No. LSZ19H180001, LY22H180002 and LQ21H180008), and the 13th Five-year Plan for National Key Research and Development Program of China (Grant No. 2016YFC1306600). Chunlei Liu was supported in part by US National Institutes of Health (Grant No. R01MH096979).
I would like to thank all the subjects who participated in our experiment and Yiran Ma for his help and support during my research.
References
1. Obeso, J. A., Rodriguez-Oroz, M. C., Rodriguez, M., Lanciego, J. L., Artieda, J., Gonzalo, N., et al. (2000). Pathophysiology of the basal ganglia in Parkinson’s disease. Trends Neurosci. 23(10 Suppl), S8–S19. doi: 10.1016/S1471-1931(00)00028-8.
2. Deistung A, Schweser F, Reichenbach JR. Overview of quantitative susceptibility mapping. NMR Biomed. 2017 Apr;30(4). doi: 10.1002/nbm.3569.
3. Guan X, Guo T, Zhou C, et al. Asymmetrical nigral iron accumulation in Parkinson’s disease with motor asymmetry: An explorative, longitudinal and test-retest study. Aging (Albany NY) 2020;12(18):18622-18634.
4. Edmund T. Rolls, Chu-Chung Huang, Ching-Po Lin, Jianfeng Feng, Marc Joliot, Automated anatomical labelling atlas 3, NeuroImage, Volume 206,2020,116189, ISSN 1053-8119.
5. Avants BB, Epstein CL, Grossman M, Gee JC. Symmetric diffeomorphic image registration with cross-correlation: evaluating automated labeling of elderly and neurodegenerative brain. Med Image Anal. 2008; 12:26–41.
6. Shrout PE, Fleiss JL. Intraclass correlations: uses in assessing rater reliability. Psychol Bull. 1979 Mar;86(2):420-8. doi: 10.1037//0033-2909.86.2.420.
7. Tang Z. Algorithm Research Based on Mutual Information and Demons Medical Image Registration [Dissertation]. Liaoning Normal University (2015).
Figures
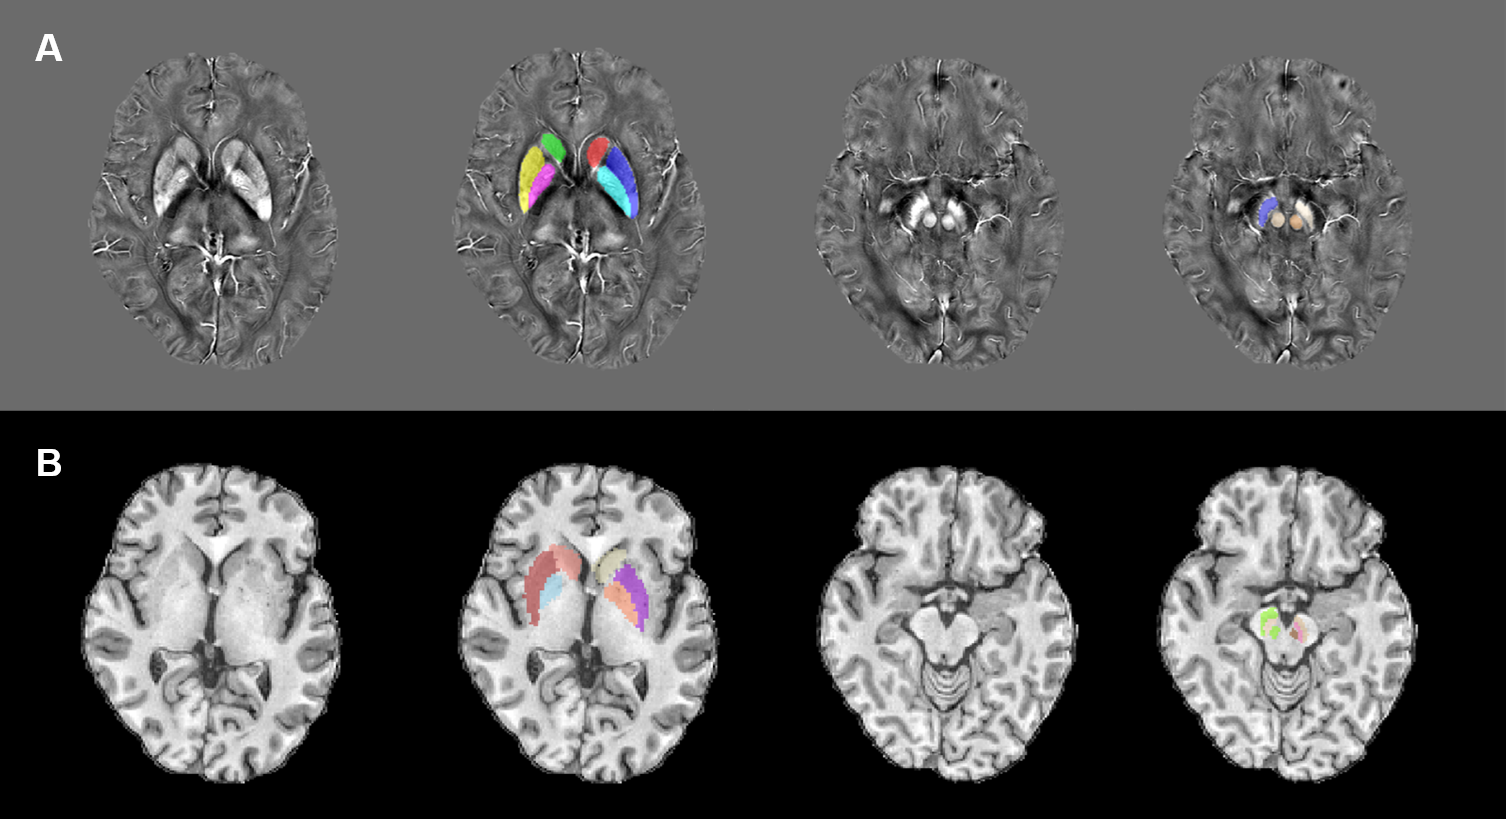
(A) Semi-automatic segmentation of bilateral subcortical nuclei (caudate, putamen, globus pallidus, red nucleus, and substantia nigra) in native QSM images. (B) ROI of bilateral Subcortical nuclei automatically segmented by Automated anatomical labelling atlas 3 on T1WI.
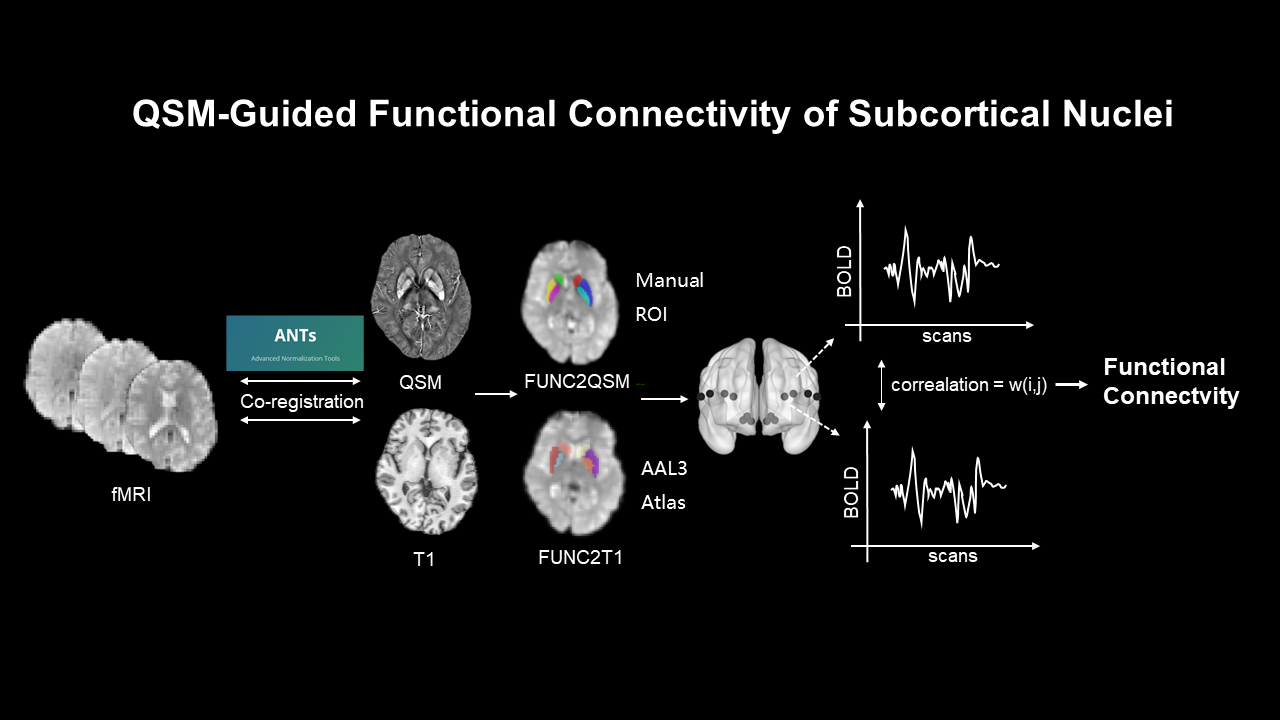
Preview Figure
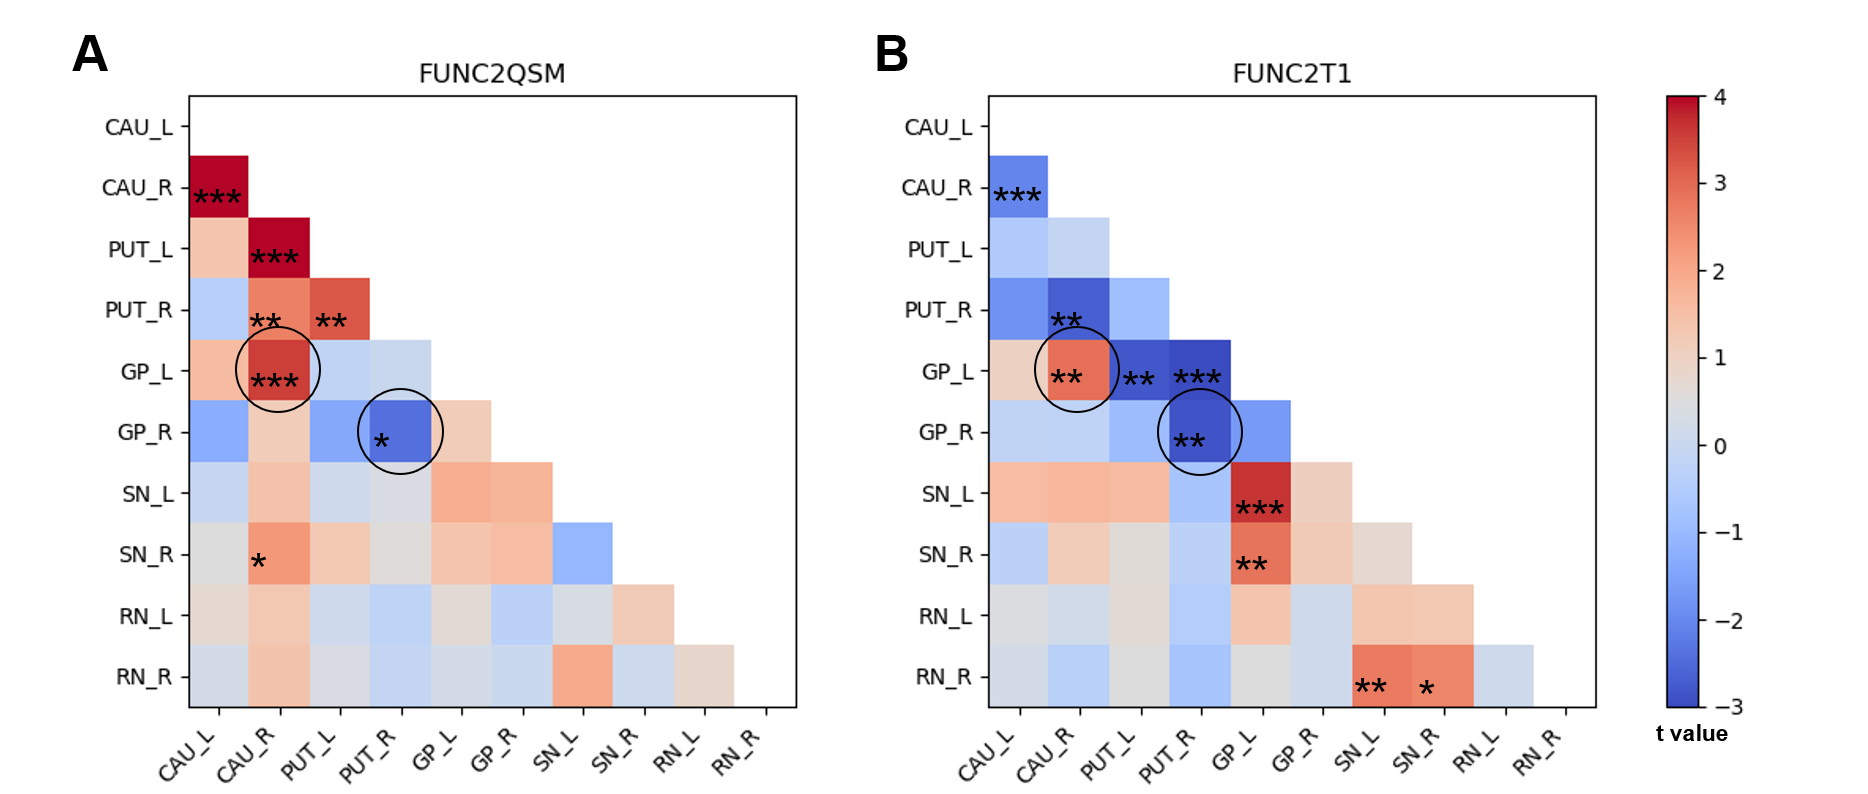
Intergroup comparisons (t-value matrix; NC-PD) of functional connectivity among the subcortical nuclei in the FUNC2QSM dataset(A) and the FUNC2T1 dataset(B). Single asterisk (*) represents p < 0.05; double asterisk (**) represents p < 0.01; triple asterisk (***) represents p < 0.001. ○represents the common functional connectivity with significant differences in both datasets. The color bar shows the numerical t value. Abbreviations: L = Left; R = Right; CAU = Caudate, PUT = Putamen, GP = Globus pallidus, SN = Substantia nigra, RN = Red nucleus.
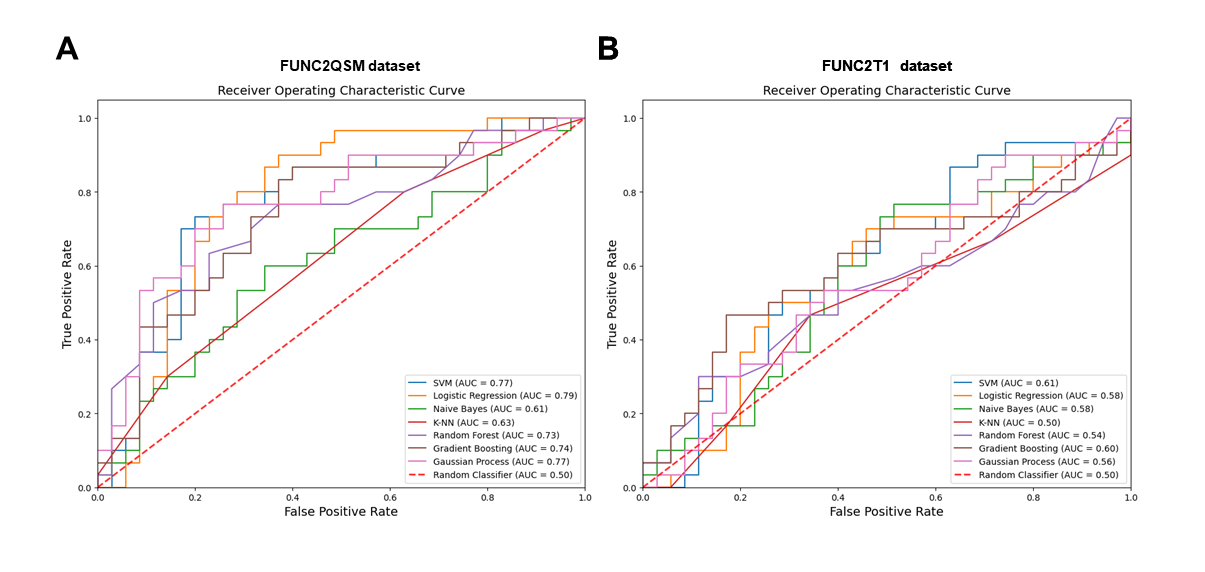
Receiver operating characteristic curves of diverse machine learning classification models on the FUNC2QSM dataset(A) and the FUNC2T1 dataset(B).