3433
Functional Connectivity and Tract Integrity of the Ventral Tegmental Area in Parkinson’s Disease with Depressive Symptoms1Duke University School of Medicine, Durham, NC, United States, 2Duke-NUS Medical School, Singapore, Singapore, 3Department of Diagnostic Radiology, Singapore General Hospital, Singapore, Singapore, 4Department of Neurology, National Neuroscience Institute, Tan Tock Seng Hospital, Singapore, Singapore
Synopsis
Keywords: Functional Connectivity, Diffusion/other diffusion imaging techniques, Multimodal, Ventral Tegmental Area, resting state
Motivation: The ventral tegmental area (VTA) is theorized to contribute to the unique pathogenesis of depressive symptoms in Parkinson’s Disease (PD) but remains understudied.
Goal(s): We aim to characterize the functional and structural connectivity changes in the VTA as they relate to depressive symptoms in PD.
Approach: Resting state functional MRI and correlational tractography approaches were used to map the functional connectivity and tract projection changes associated with increased depressive symptoms in 54 patients and 100 controls.
Results: The left VTA was found to have functional connectivity changes and tract profiles that correlate with clinical symptoms in manners unique to the PD subgroup.
Impact: This study supports the idea of the ventral tegmental area playing a role in and potentially becoming a therapeutic target for the unique pathogenesis of depressive symptoms in patients with Parkinson’s disease.
Introduction
Despite classic associations with motor symptoms, specific non-motor symptoms of Parkinson’s Disease (PD) such as depression have been shown to precede the first motor signs by over a decade1. These depressive symptoms are thought to have a PD-specific pathogenesis through both deficiencies in mescortical noradrenergic and serotonergic projections and mesocorticolimbic dopamine projections2. Neurodegeneration of dopaminergic neurons in PD specifically targets the substantia nigra while leaving the dopaminergic neurons of the adjacent ventral tegmental area (VTA) relatively spared in early phases of the disease3. However, given the VTA’s role in executive function and motivations, it is theorized to contribute to mood disorders and their unique pathogenesis in PD4. Resting state functional magnetic resonance imaging (rs-fMRI)5 and diffusion spectrum imaging (DSI)6 have proven useful in elucidating the pathophysiology of PD and present a unique opportunity in combination to address questions related to the functional connectivity (FC) and structural changes of the VTA as they relate to depressive symptoms in PD.Methods
This project received institutional ethics board approval and informed consent from each subject. Demographic information and clinical motor and non-motor assessments, including the Unified Parkinson’s Disease Rating Scale (UPDRS), Hoehn & Yahr Scale (H&Y), Montreal Cognitive Assessment (MoCA), Hospital Anxiety and Depression Scale (HADS), and Apathy scale were obtained from 54 patients with PD and 100 healthy controls (HCs).MRI data was acquired from a 3T Siemens MR scanner for all 154 subjects. rs-fMRI images were acquired with TR/TE 1500/30ms, flip angle 80°, voxel size 3x3x3mm3. Distortion correction was performed with FSL topup and images underwent the standard preprocessining and denoising pipelines with a Guassian kernel at 8mm FWHM and a band-pass filter of 0.008-0.09Hz in CONN. Seed-to-whole brain analysis was performed for left and right VTA-atlased regions7 for estimation of VTA FC maps that are significantly correlated with HADS depression scores (HADS-d). Group interaction analyses were controlled for age, gender, handedness, UPDRS III score, the effects of PD-group membership, and the effects of HC-group membership. Significant clusters were determined through non-parametric threshold-free cluster enhancement on 1000 simulations with a voxel threshold of p<0.05 after family-wise error rate correction. Post-hoc Spearman correlation analyses between the FC maps and clinical variables were performed with p<0.05.
DSI images were acquired with TR/TE 4100/110 ms, 129 diffusion sampling directions with b=3000s/mm2, and voxel size 2x2x2mm3. Whole brain correlational tractography analysis was completed in DSI Studio with the left and right VTA marked as seeds for the identification of projections that significantly correlated with HADS depression scores. The analysis was controlled for age and gender with the false discovery rate p-value threshold set at 0.05. Quantitative anisotropy (QA) values were calculated for the identified projections and Spearman correlation tests with a threshold p<0.05 were used to characterize the relationship between neuropsychologic testing and diffusion metrics.
Results
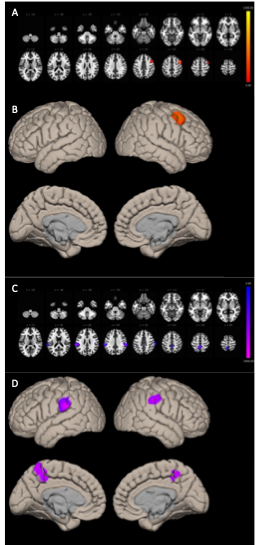
Table 1 summarizes the demographic and clinical scores for the cohort.Figure 1 summarizes the across-group interaction and PD-subgroup FC patterns for ROI-to-voxel analyses with a left VTA seed. Interaction analysis identifies the right middle frontal gyrus (MFG) as a cluster of significant difference. PD subgroup analysis identifies decreased FC to clusters in the bilateral supramarginal gyri (SMG) and precuneus area. No significant FC clusters in the HC subgroup analysis.
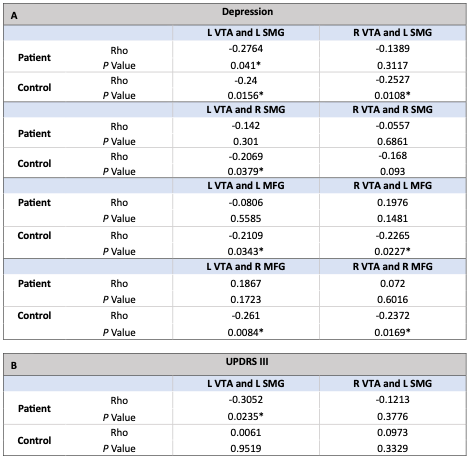
Table 2 summarizes the correlational analyses for neuropsychological assessments and FC values of previously identified clusters of interest. No significant correlations to HADS-Anxiety, Apathy, or MoCA scores. No significant correlations to precuneus regions.
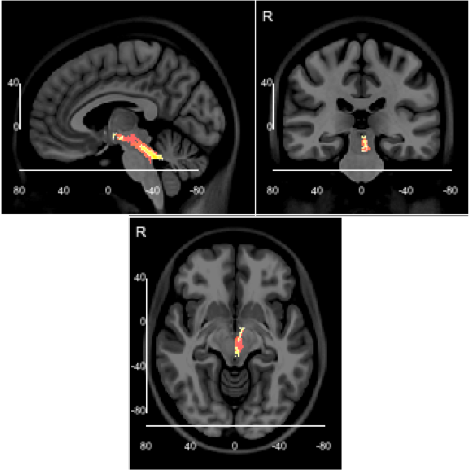
Figure 2 highlights the QA tracts passing through the left VTA that are correlated with HADS-d across all subjects and within the PD subgroup. No QA tracts identified within the HC subgroup.
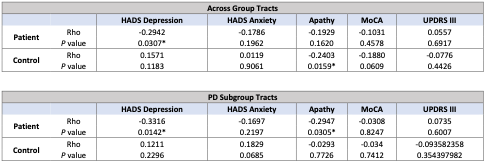
Table 3 summarizes the correlations between the neuropsychologic assessments and QA values of previously identified tracts.
Discussion/Conclusion
This study aimed to characterize the FC and tract changes of PD-related depressive symptoms as they affect the ventral tegmental area, which has been classically under-characterized in its relationship to non-motor symptoms of PD. From the analyses showing FC changes and QA-correlational relationships unique to the PD subgroup, we can infer the VTA is changed differently in the development of depressive symptoms in PD versus in the development of similar symptoms in otherwise healthy controls. The intermediates that connect the elucidated tract changes to the functional connectivity patterns seen is not yet fully understood. This question may benefit from further studies that characterize the specific VTA neuron type affected by depression in PD. This study offers increasing support for the consideration of the VTA in the treatment of the unique depressive symptoms that affect many with PD.Acknowledgements
We would like to express our gratitude to the participants and their families.References
1. Chaudhuri, K. R., & Schapira, A. H. (2009). Non-motor symptoms of Parkinson’s disease: dopaminergic pathophysiology and treatment. The Lancet Neurology, 8(5), 464–474. https://doi.org/10.1016/s1474-4422(09)70068-7
2. Poewe, W. (2008b). Non-motor symptoms in Parkinson’s disease. European Journal of Neurology, 15(s1), 14–20. https://doi.org/10.1111/j.1468-1331.2008.02056.x
3. O’Shea, I. M., Popal, H. S., Olson, I. R., Murty, V. P., & Smith, D. V. (2022). Distinct alterations in cerebellar connectivity with substantia nigra and ventral tegmental area in Parkinson’s disease. Scientific Reports, 12(1), 3289. https://doi.org/10.1038/s41598-022-07020-x
4. Alberico, S. L., Cassell, M. D., & Narayanan, N. S. (2015). The vulnerable ventral tegmental area in Parkinson’s disease. Basal Ganglia, 5(2-3), 51–55. https://doi.org/10.1016/j.baga.2015.06.001
5. Tessitore, A., Cirillo, M., & De Micco, R. (2019). Functional Connectivity Signatures of Parkinson’s Disease. Journal of Parkinson’s Disease, 9(4), 637–652. https://doi.org/10.3233/jpd-191592
6. Zhang, Y., & Burock, M. A. (2020). Diffusion Tensor Imaging in Parkinson’s Disease and Parkinsonian Syndrome: A Systematic Review. Frontiers in Neurology, 11, 531993. https://doi.org/10.3389/fneur.2020.531993
7. Trutti, A. C., Fontanesi, L., Mulder, M. J., Bazin, P.-L., Hommel, B., & Forstmann, B. U. (2021). A probabilistic atlas of the human ventral tegmental area (VTA) based on 7 Tesla MRI data. Brain Structure and Function, 226(4), 1155–1167. https://doi.org/10.1007/s00429-021-02231-w
Figures
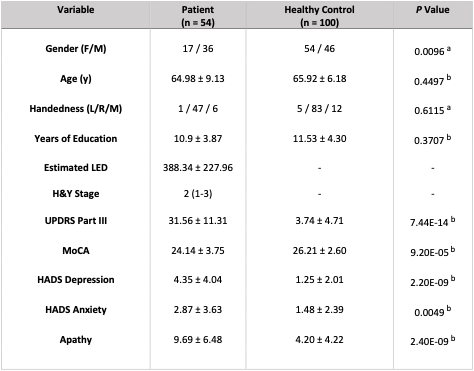
Table 1: Demographic and Clinical Characteristic Summary for Patients and Healthy Controls. Data represented as n1/n2/n3, median (range), and mean ± SD.
a: Chi-square statistic
b: Two-sample t-test
No significant difference between the PD and HC group in age, handedness, or years of education. Significant across-group differences in gender distribution, UPDRS scores, MoCA scores, HADS-d, HADS-anxiety, and apathy scores.