3430
Probing the relationship between structure & function in the human thalamus: a contrast-focused, high-resolution study at 7T1CSEM- Swiss Center for Electronics and Microtechnology, Bern, Switzerland, 2CIBM Center for Biomedical Imaging, Lausanne, Switzerland, 3Donders Centre for Cognitive Neuroimaging, Radboud University, Nijmegen, Netherlands, 4Department of Clinical Neurosciences, Neurosurgery Service and Gamma Knife Center, Centre Hospitalier Universitaire Vaudois (CHUV), Lausanne, Switzerland, 5Signal Processing Laboratory 5 (LTS5), École Polytechnique Fédérale de Lausanne, Lausanne, Switzerland, 6Faculty of Biology and Medicine, University of Lausanne (UNIL), Lausanne, Switzerland, 7Department of Radiology, Lausanne University Hospital (CHUV) and University of Lausanne (UNIL), Lausanne, Switzerland
Synopsis
Keywords: Functional Connectivity, fMRI (resting state), High-Field MRI, Neuroscience, fMRI, Thalamus, Thalamic nuclei
Motivation: The thalamic nuclei play vital roles in brain function, but are challenging to image. Notably, clusters found by fMRI approaches do not fully match features from structural MRI studies.
Goal(s): To clarify the existing mismatches via high-resolution fMRI, contrast-focused structural MRI, and atlas information, at 7T.
Approach: From the same individual brains, we compared structural MRI, atlas delineations and functional clusters in the thalamus, using ICA and seed-based analysis of rs-fMRI.
Results: Clusters from fMRI tend to coincide with nuclei labels from histological atlases, but deviate in some cases, while remaining more consistent with the individual’s structural MRI features.
Impact: This study provides novel insights into the structural and functional organization of the thalamus. The ability to localize and characterize thalamic nuclei is of strong interest to basic and clinical neuroscience, and for development of effective non-invasive surgical targeting approaches.
Introduction
The thalamus is a key brain structure that is subdivided into smaller specialized nuclei. Certain nuclei have been suggested as morphological biomarkers for disorders like schizophrenia[1], while others are historically effective surgical targets to treat e.g. tremor[2] or epilepsy[3],[4]. Unfortunately, most thalamic nuclei are indistinguishable with conventional MRI contrasts (T1w,T2w), prompting studies exploring dedicated structural[5],[6], functional[7],[8], and diffusion approaches[9].Notably, significant disparities have been found between fMRI-derived thalamic organization and structural MRI/histological atlases[10]. While function and structure may not necessarily strictly match, given the small scale and intricate morphology of these nuclei, anatomical variability may strongly affect thalamic clusters estimated with (intermediate) group-level steps[7],[8],[10], compromising comparisons with other modalities. It is highly pertinent to clarify these disparities, because structural imaging is clinically more practical and yields the highest spatial specificity, but function is ultimately the variable of interest for diagnosis and treatment.
Recently, we have collected an extensive selection of high-resolution structural sequences at 7T for thalamic imaging on the same individual brains, to identify the most informative contrasts without anatomical variability confounds[11]. We now expand this work with BOLD-fMRI (also at 7T, benefitting from its high functional sensitivity), in the same subjects, for direct function-structure comparisons at the individual level.
Methods
Data acquisition: Performed at 7T (MAGNETOM Terra, Siemens Healthcare) with a single-channel transmit/32-channel receive head coil (Nova Medical), in 4 healthy adults (2M/2F, 28±2yo). From a comprehensive selection of structural sequences[11] and fMRI, the relevant acquisitions to this work were:i. T1-weighted anatomical (T1w) (MP2RAGE, TI1/TI2=800/2700ms);
ii. T1-weighted optimized for gray-to-white matter contrast (GWMopt) (TI1/TI2=700/1600ms)[6];
iii. Five-echo 3D-GRE (ΔTE=5.2ms), repeated for 5–9 head orientations, to estimate QSM[12];
iv. fMRI using SMS-2D-EPI (TR/TE=1050/23ms, 2x4acc), at rest watching a film (“MOVIE1”) from the Human Connectome Project[13] (TA»15min).
GWMopt and QSM were previously identified as top choices for thalamic nuclei differentiation[11]. All sequences were whole-brain, with 0.6mm (structural) or 1.6mm (fMRI) isotropic resolution. The transmit voltage was calibrated for the thalamus.
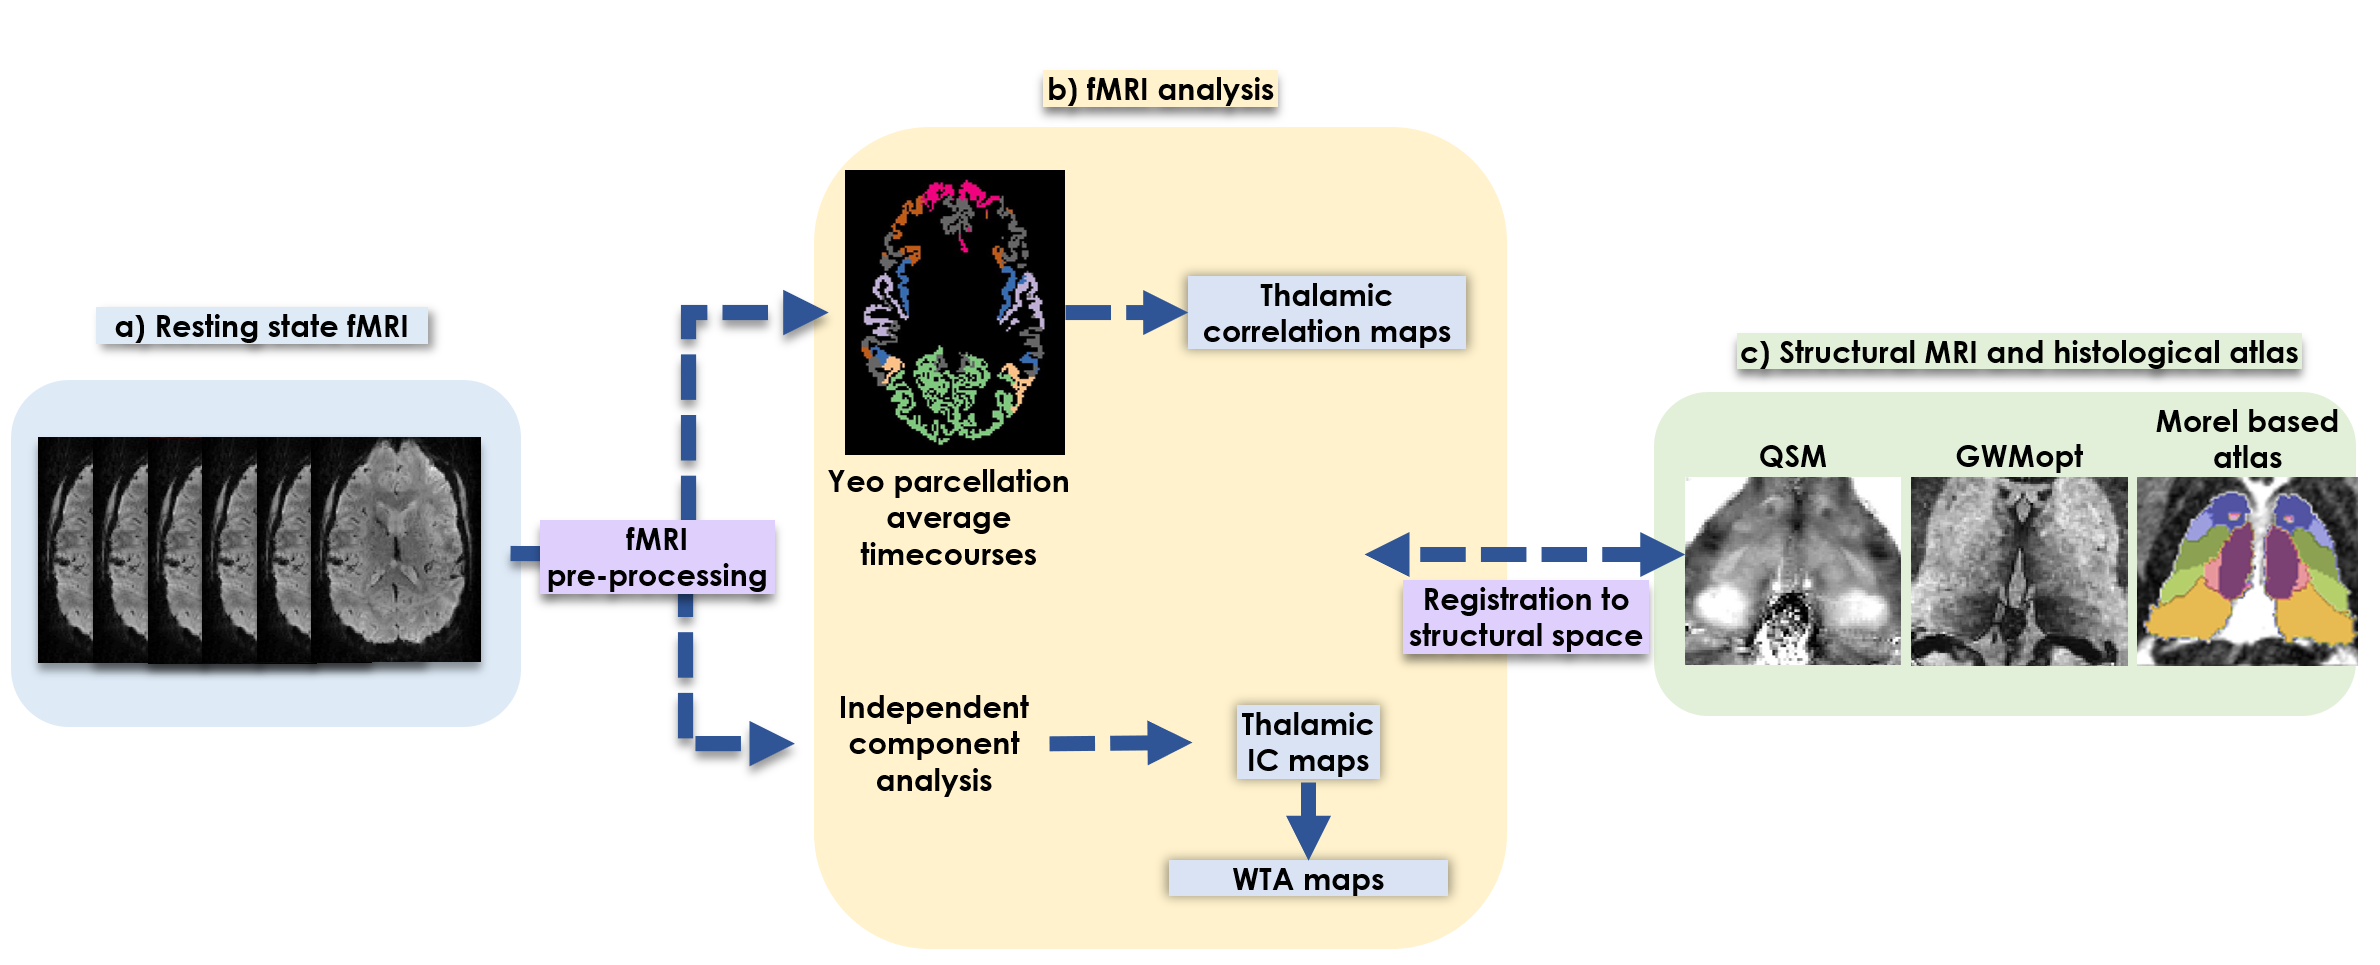
Pre-processing: fMRI data pre-processing included motion correction, detrending, spatial smoothing (5mm), and voxel-wise linear regression to remove motion, white matter and CSF signal contributions. For reference and masking purposes, a histological (Morel-based) thalamic atlas was aligned to the data using the THOMAS method[14]. A thalamic mask was obtained from the atlas, and refined by excluding vessels/CSF-containing voxels based on their EPI image intensity. The Yeo et al. 7-region cortex parcellation., defining dominant functional networks[15], was aligned to the data via T1w image segmentation using Freesurfer[16] followed by non-linear warping to the fMRI-space.
Data analysis: To identify functional clusters in the thalamus, two approaches were explored (Figure 1):
- Independent component analysis (ICA): Thalamic voxels underwent single-level ICA using FSL-MELODIC(10 ICs). The ICs exhibiting temporal and spectral characteristics consistent with artifacts were excluded after visual inspection[17]. A winner-takes-all (WTA) approach assigned each voxel to its most probable IC.
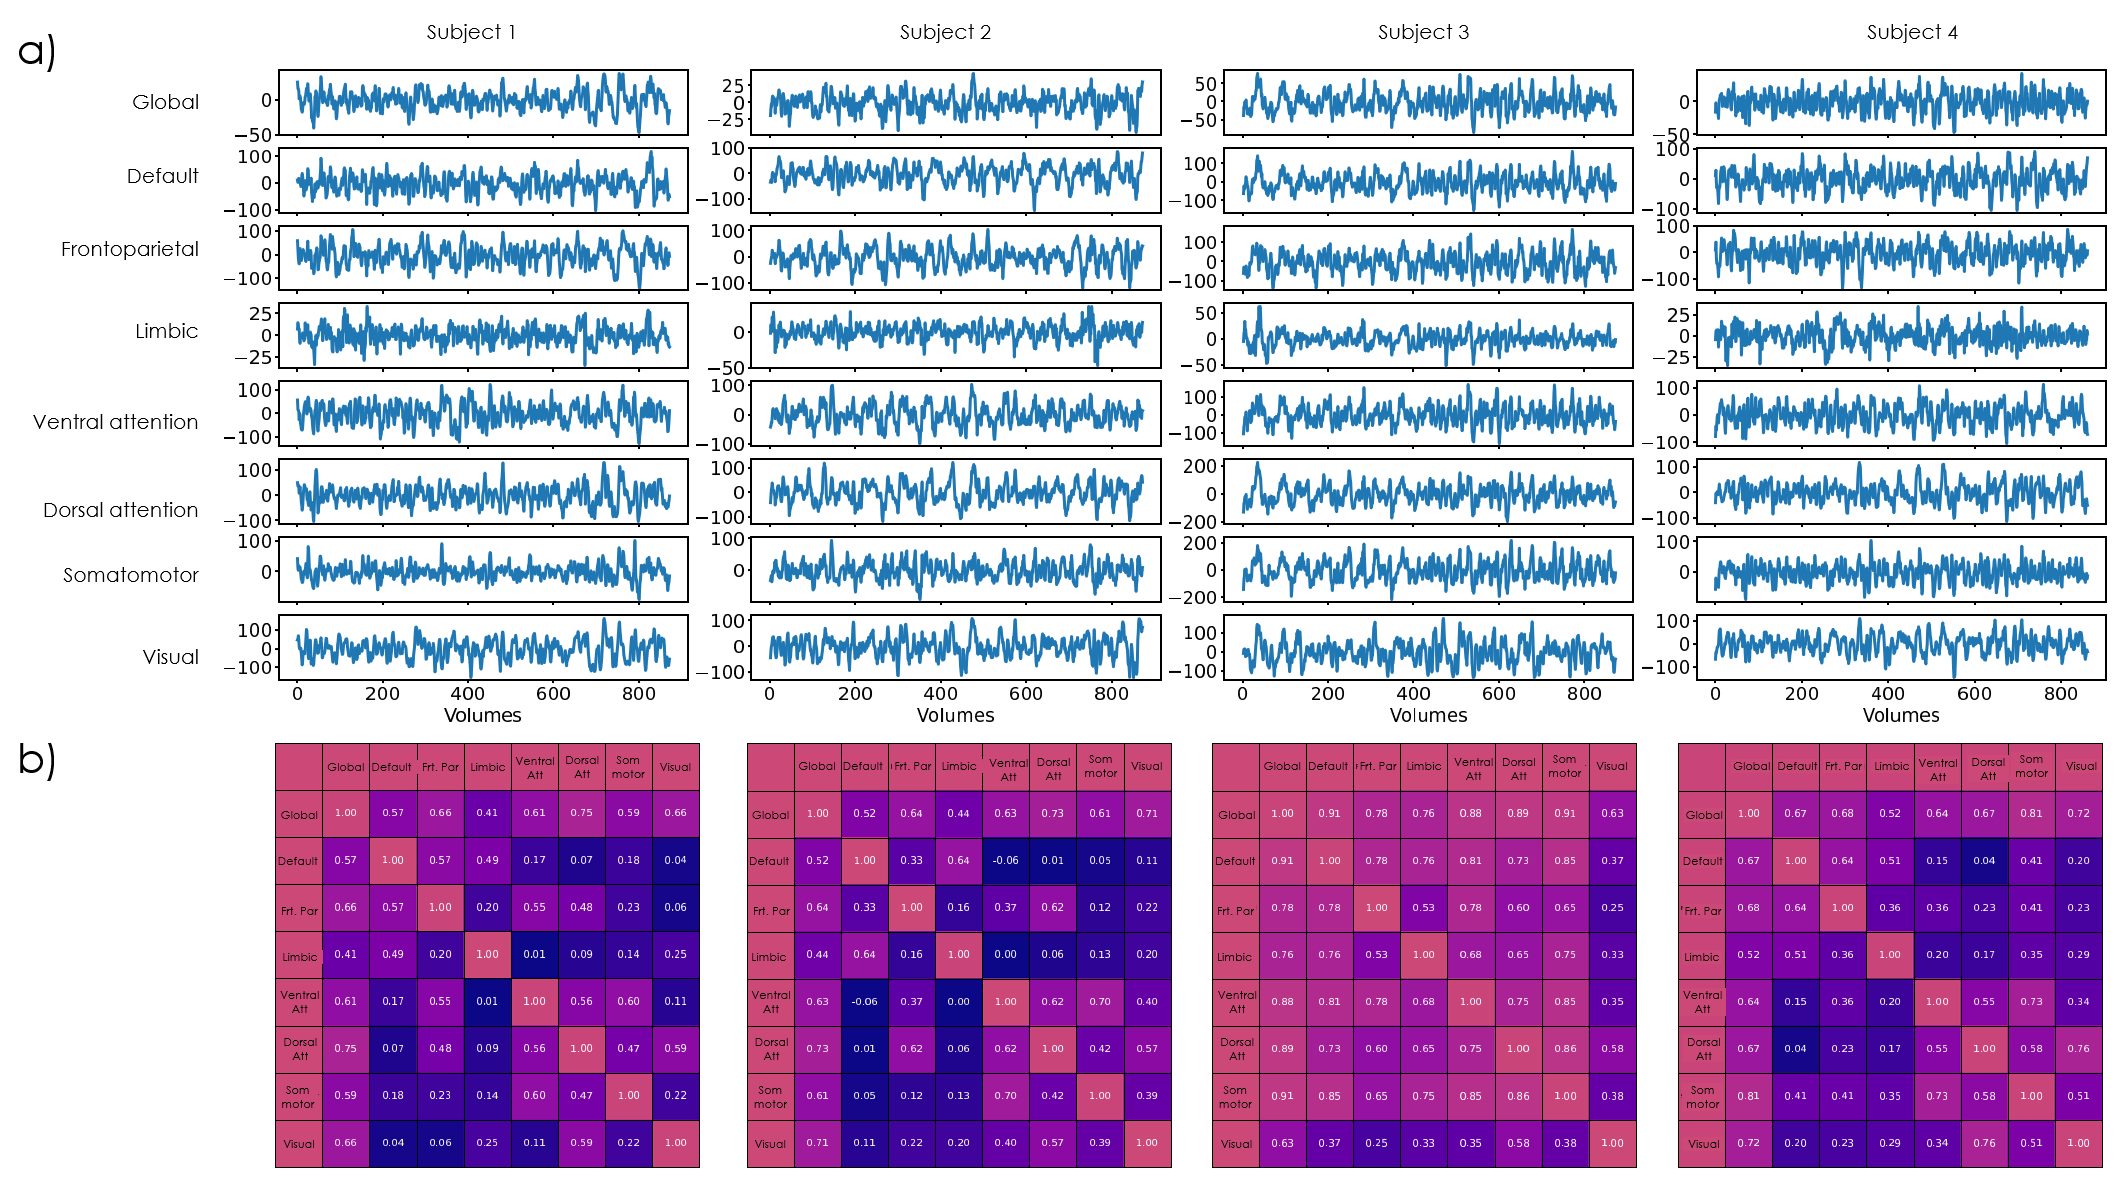
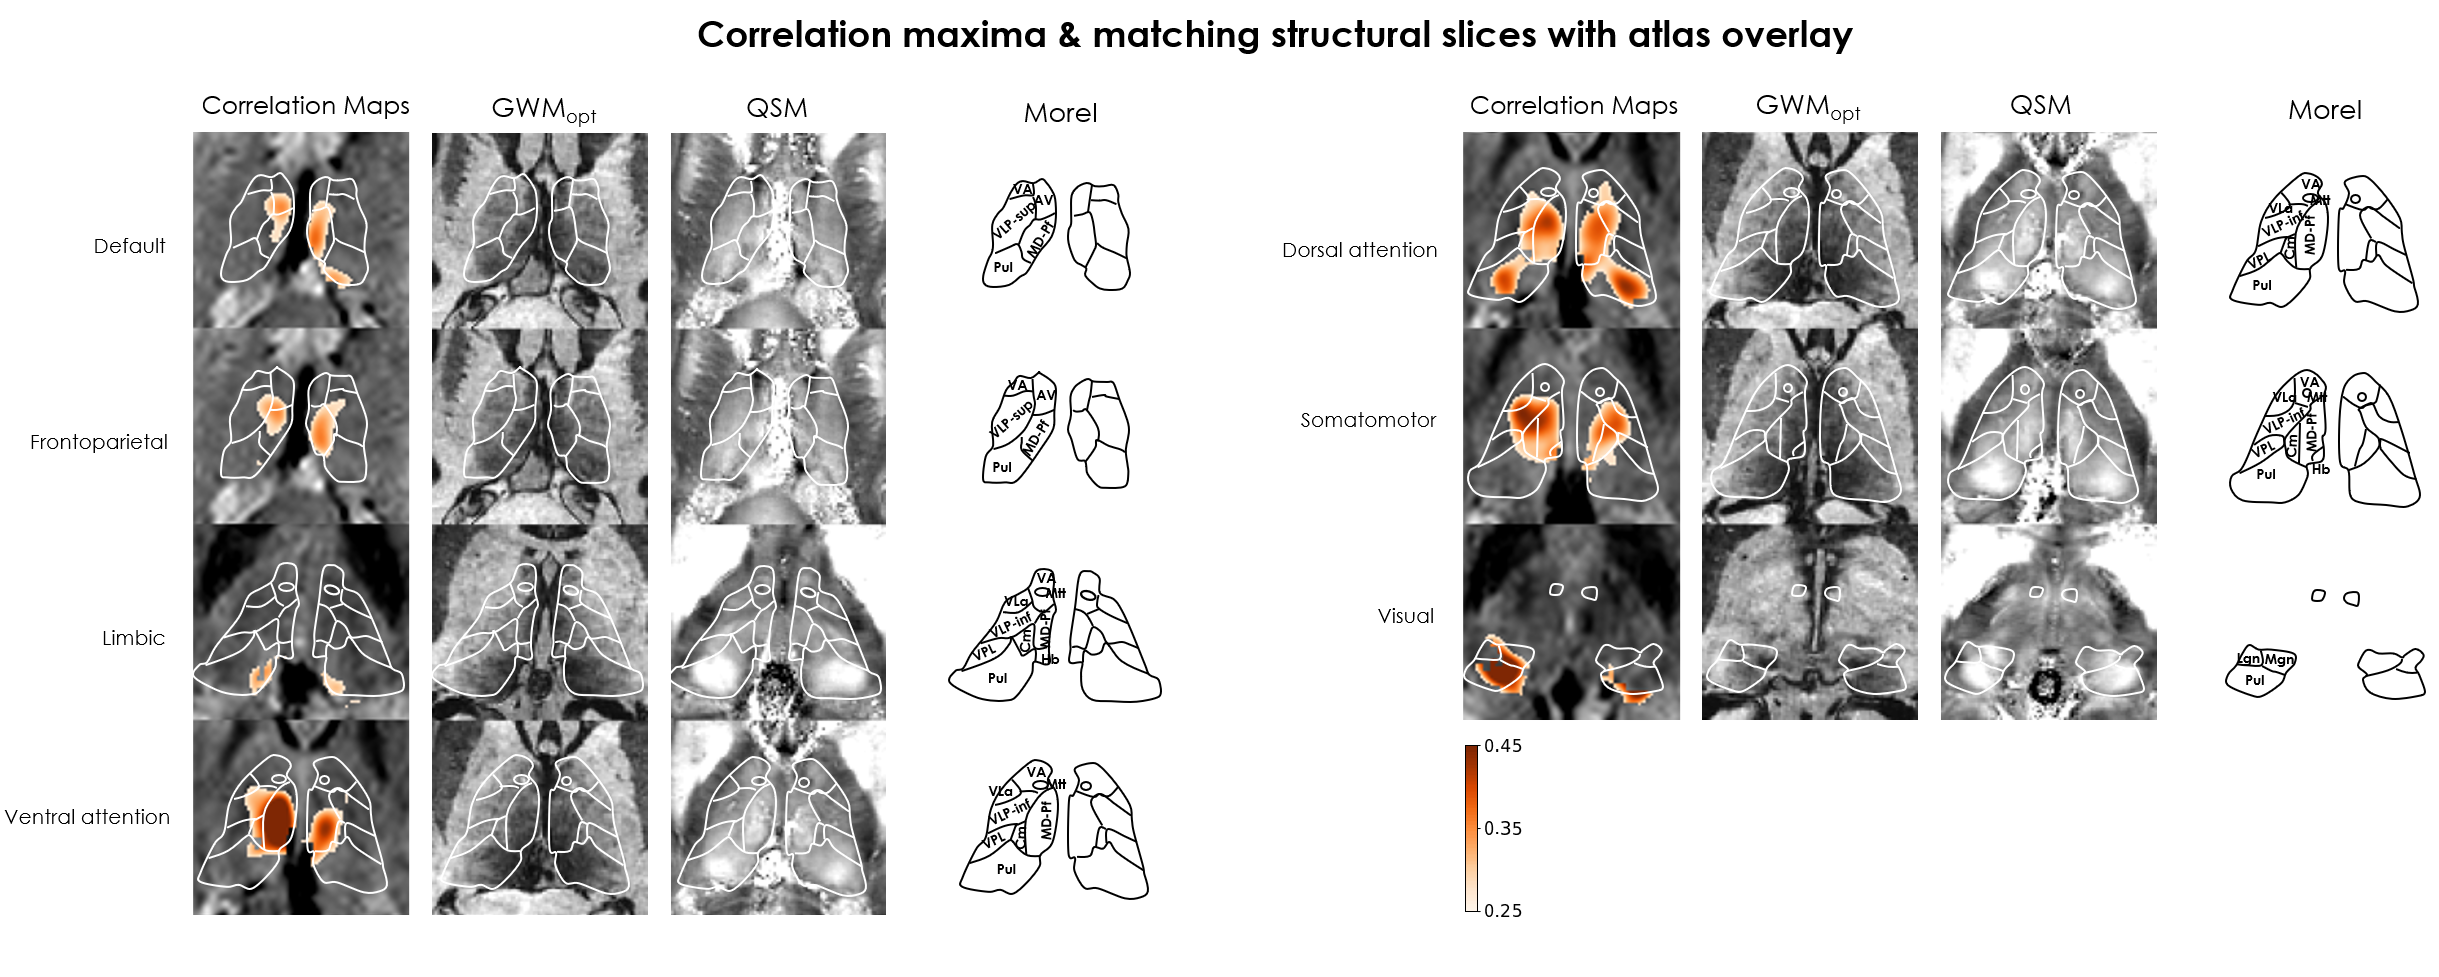
- Seed-based analysis: The mean BOLD time course from each cortical Yeo parcel was Pearson-correlated with each thalamic voxel timecourse to generate functional connectivity maps.
Results
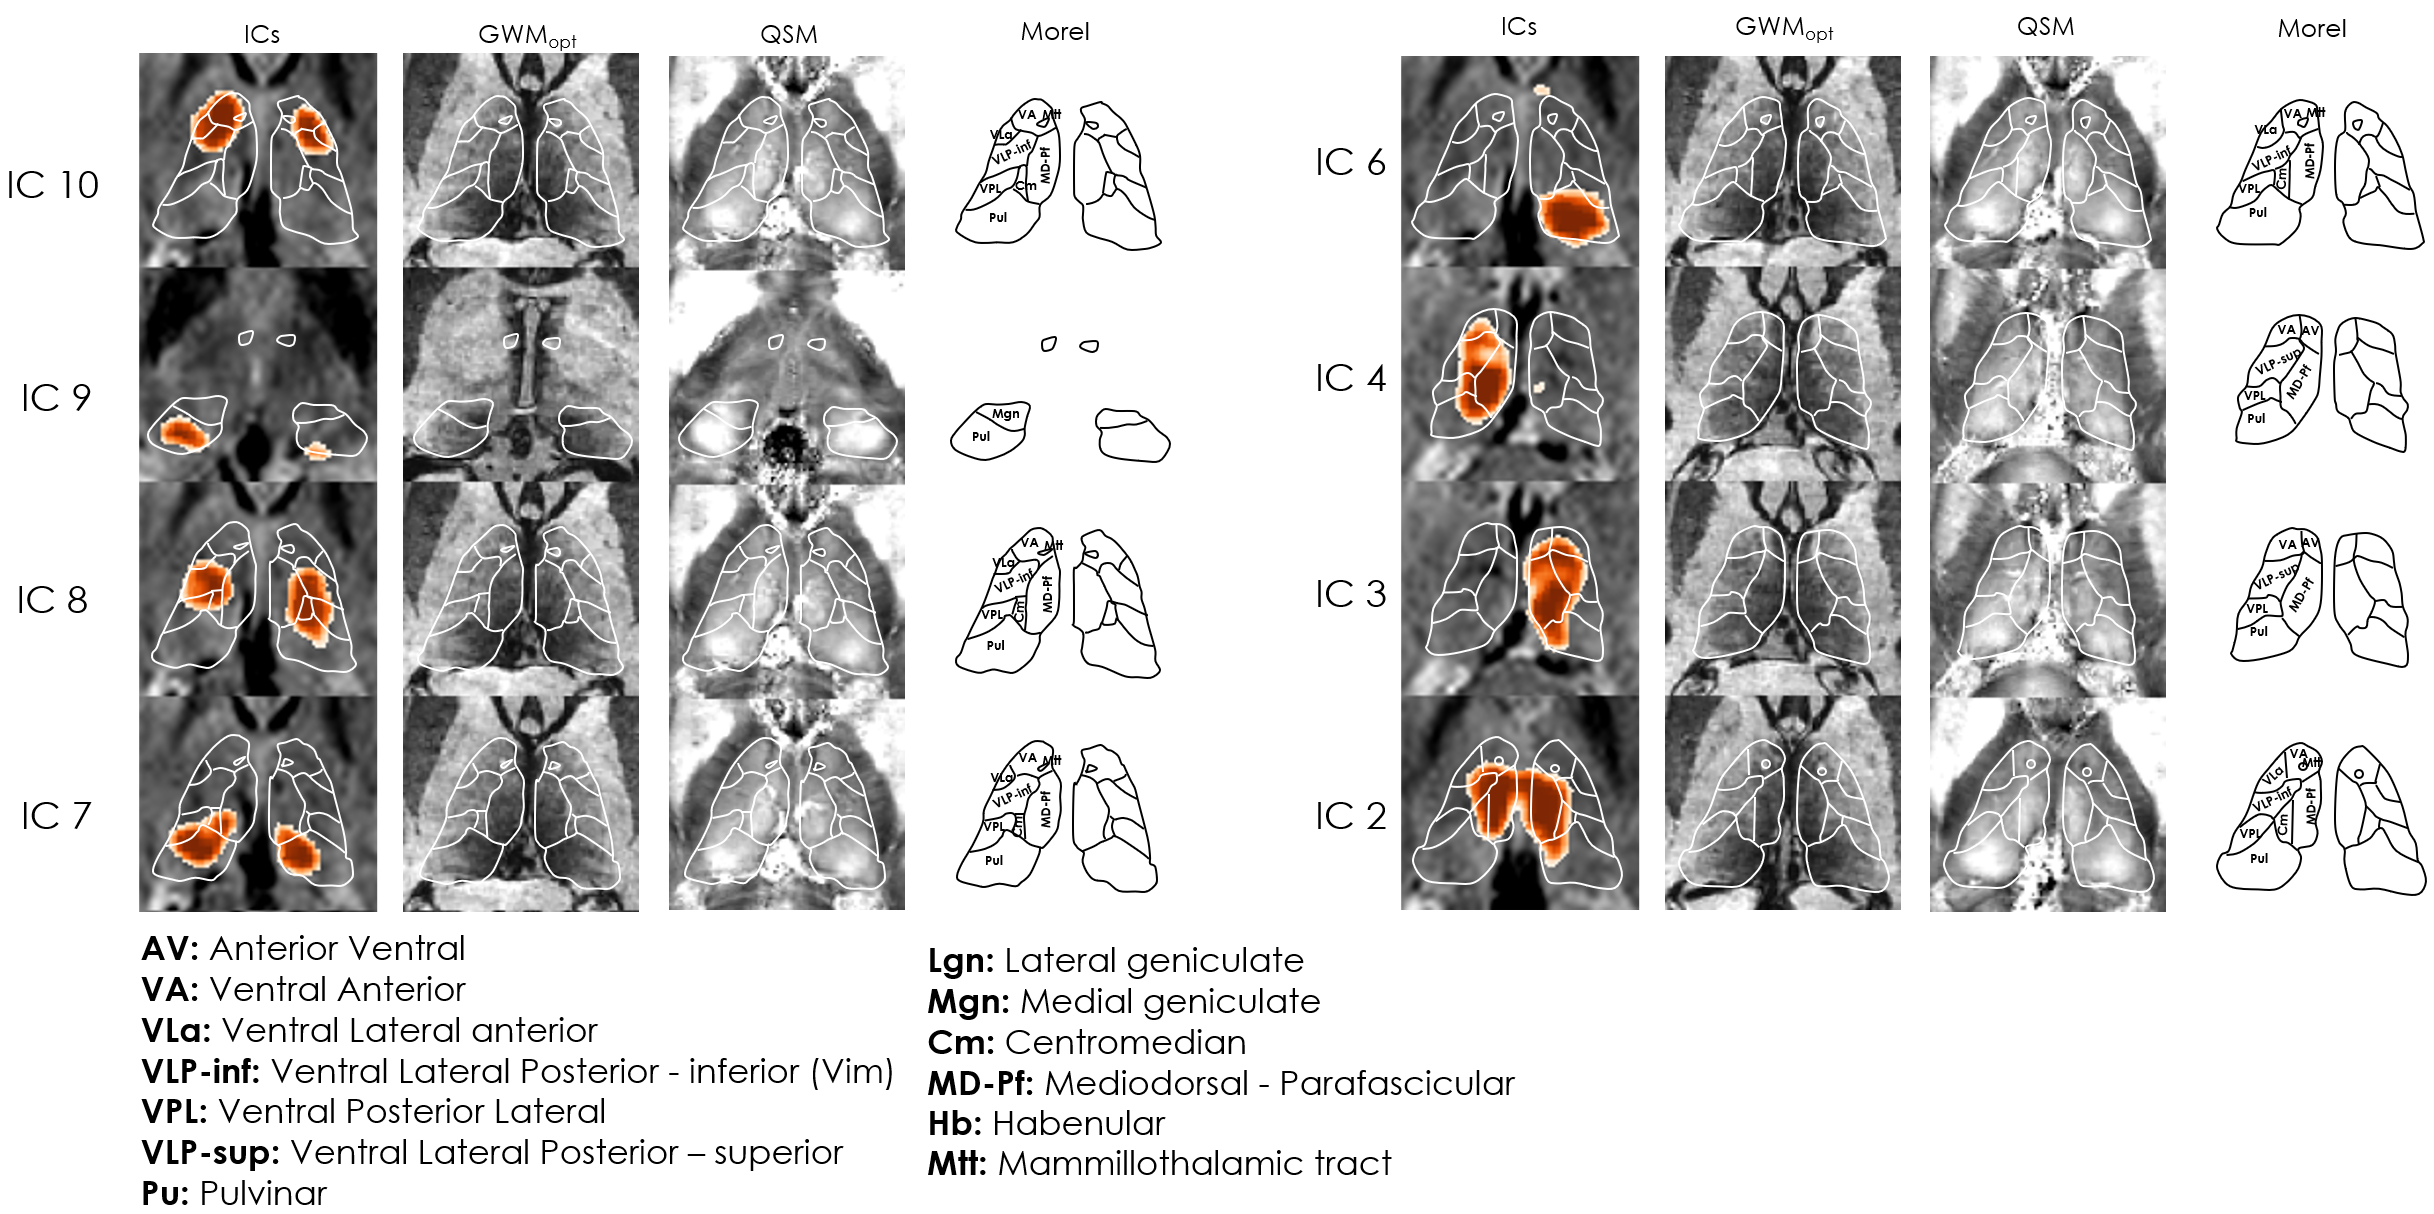
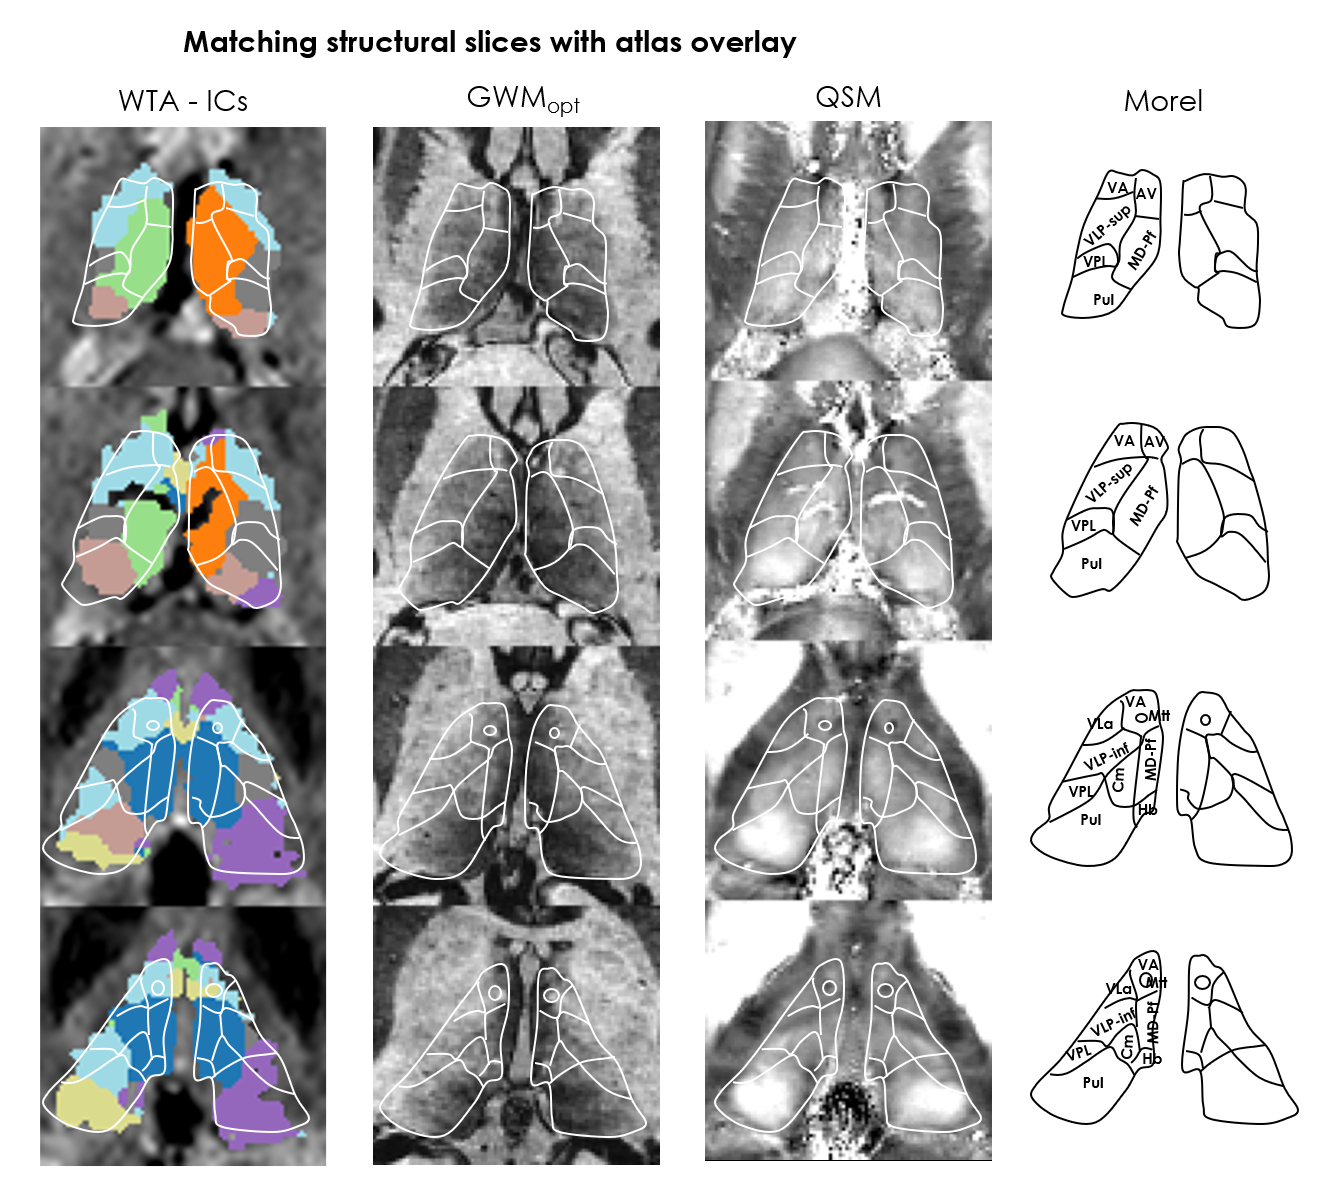
ICA: Across subjects, 1–5 ICs were considered artifactual and excluded. The remaining ICs varied in agreement with structural and atlas contours; e.g. in Subj.1, IC2 aligned closely with the mediodorsal/parafascicular delineation (atlas), and matched GWMopt hypo- and QSM hyperintensities; IC7 partially matched the pulvinar delineation, but better colocalized with local GWMopt hypointensities (Figure 2). The WTA demonstrated good symmetry between hemispheres, and generally good agreement with structural and atlas organization (Figure 3).Seed-based analysis: The movie elicited a connectivity structure between the Yeo parcels that was consistent across 3 of the 4 subjects (Figure 4b), and which determined the distinguishability of some of the respective thalamic connectivity maps (Figure 5). Nonetheless, e.g., in Subj.1 the visual parcel connectivity cluster co-localized with the pulvinar and LGN atlas delineations, and the ventral attention cluster matched the mediodorsal/parafascicular delineation; both cases were well aligned with GWMopt hypo- and QSM hyperintensities. The dorsal attention cluster co-localized with the mediodorsal/parafascicular delineation and extended into pulvinar; it did not fully match the pulvinar atlas delineation, but showed an excellent match to local QSM hyperintensities.
Conclusion
This work provides strong indications that thalamic fMRI clusters do tend to coincide with known nuclei from standard histological atlases. However, in some cases, they might deviate from the atlas delineations while remaining consistent with individual anatomical features (structural MRI). These observations strongly suggest that anatomical variability may be an important factor in the mismatches observed within and across previous studies.Acknowledgements
This work was funded by the Swiss National Science Foundation through grant 185909, and supported by CSEM – Swiss Center for Electronics and Microtechnology, by the Translational Imaging Center (TIC) of the Swiss Institute for Translational and Entrepreneurial Medicine (SITEM), and by the CIBM Center for Biomedical Imaging, Switzerland.References
[1] N. D. Woodward, H. Karbasforoushan, and S. Heckers, “Thalamocortical Dysconnectivity in Schizophrenia,” AJP, vol. 169, no. 10, pp. 1092–1099, Oct. 2012, doi: 10.1176/appi.ajp.2012.12010056.
[2] A. Kooshkabadi et al., “Gamma Knife thalamotomy for tremor in the magnetic resonance imaging era: Clinical article,” JNS, vol. 118, no. 4, pp. 713–718, Apr. 2013, doi: 10.3171/2013.1.JNS121111.
[3] J. F. Kerrigan et al., “Electrical Stimulation of the Anterior Nucleus of the Thalamus for the Treatment of Intractable Epilepsy,” Epilepsia, vol. 45, no. 4, pp. 346–354, Apr. 2004, doi: 10.1111/j.0013-9580.2004.01304.x.
[4] A. Sitnikov, Y. Grigoryan, and L. Mishnyakova, “Bilateral stereotactic lesions and chronic stimulation of the anterior thalamic nuclei for treatment of pharmacoresistant epilepsy,” Surg Neurol Int, vol. 9, no. 1, p. 137, 2018, doi: 10.4103/sni.sni_25_18.
[5] A. Deistung et al., “Toward in vivo histology: A comparison of quantitative susceptibility mapping (QSM) with magnitude-, phase-, and R2⁎-imaging at ultra-high magnetic field strength,” NeuroImage, vol. 65, pp. 299–314, Jan. 2013, doi: 10.1016/j.neuroimage.2012.09.055.
[6] P. Marques and R. Gruetter, “New Developments and Applications of the MP2RAGE Sequence - Focusing the Contrast and High Spatial Resolution R1 Mapping,” PLoS ONE, vol. 8, no. 7, p. e69294, Jul. 2013, doi: 10.1371/journal.pone.0069294.
[7] J. R. Hale et al., “Comparison of functional thalamic segmentation from seed-based analysis and ICA,” NeuroImage, vol. 114, pp. 448–465, Jul. 2015, doi: 10.1016/j.neuroimage.2015.04.027.
[8] D. Kim, B. Park, and H. Park, “Functional connectivity‐based identification of subdivisions of the basal ganglia and thalamus using multilevel independent component analysis of resting state fMRI,” Human Brain Mapping, vol. 34, no. 6, pp. 1371–1385, Jun. 2013, doi: 10.1002/hbm.21517.
[9] G. Battistella et al., “Robust thalamic nuclei segmentation method based on local diffusion magnetic resonance properties,” Brain Struct Funct, vol. 222, no. 5, pp. 2203–2216, Jul. 2017, doi: 10.1007/s00429-016-1336-4.
[10] C. Iglehart et al., “A systematic comparison of structural-, structural connectivity-, and functional connectivity-based thalamus parcellation techniques,” Brain Struct Funct, vol. 225, no. 5, pp. 1631–1642, Jun. 2020, doi: 10.1007/s00429-020-02085-8.
[11] C. Sainz Martinez et al., “In-vivo imaging of the human thalamus: a comprehensive evaluation of structural imaging approaches for thalamic nuclei differentiation at 7T,” N 1357, presented at the ISMRM, 2023.
[12] T. Liu, P. Spincemaille, et al., “Calculation of susceptibility through multiple orientation sampling (COSMOS): A method for conditioning the inverse problem from measured magnetic field map to susceptibility source image in MRI: COSMOS Susceptibility Imaging,” Magn. Reson. Med., vol. 61, no. 1, pp. 196–204, Jan. 2009, doi: 10.1002/mrm.21828.
[13] E. S. Finn and P. A. Bandettini, “Movie-watching outperforms rest for functional connectivity-based prediction of behavior,” NeuroImage, vol. 235, p. 117963, Jul. 2021, doi: 10.1016/j.neuroimage.2021.117963.
[14] J. H. Su et al., “Thalamus Optimized Multi Atlas Segmentation (THOMAS): fast, fully automated segmentation of thalamic nuclei from structural MRI,” NeuroImage, vol. 194, pp. 272–282, Jul. 2019, doi: 10.1016/j.neuroimage.2019.03.021.
[15] B. T. Thomas Yeo et al., “The organization of the human cerebral cortex estimated by intrinsic functional connectivity,” Journal of Neurophysiology, vol. 106, no. 3, pp. 1125–1165, Sep. 2011, doi: 10.1152/jn.00338.2011.
[16] B. Fischl, “FreeSurfer,” NeuroImage, vol. 62, no. 2, pp. 774–781, Aug. 2012, doi: 10.1016/j.neuroimage.2012.01.021.
[17] L. Griffanti et al., “Hand classification of fMRI ICA noise components,” NeuroImage, vol. 154, pp. 188–205, Jul. 2017, doi: 10.1016/j.neuroimage.2016.12.036.
Figures