3423
Changed gray matter volume and functional connectivity in cerebellar subregions in T2DM patients with insulin resistance1Gansu Provincial Hospital, Lanzhou, China, 2Ningxia Medical University, Yinchuan, China, 3Gansu University of Traditional Chinese Medicine, Lanzhou, China
Synopsis
Keywords: fMRI Analysis, Diabetes, Cerebellum; Insulin Resistance;
Motivation: The neuropathophysiological mechanisms of cerebellar damage in type 2 diabetes mellitus patients with insulin resistance (T2DM-IR) are not yet fully understood.
Goal(s): To investigate how insulin resistance affects the cerebellar structure and function.
Approach: We employed voxel-based morphometry analysis based on SUIT template and seed-based functional connectivity (FC) to assess the gray matter volume (GMV) and functional connectivity in cerebellar subregions of T2DM patients with insulin resistance and examine their correlation with clinical variables.
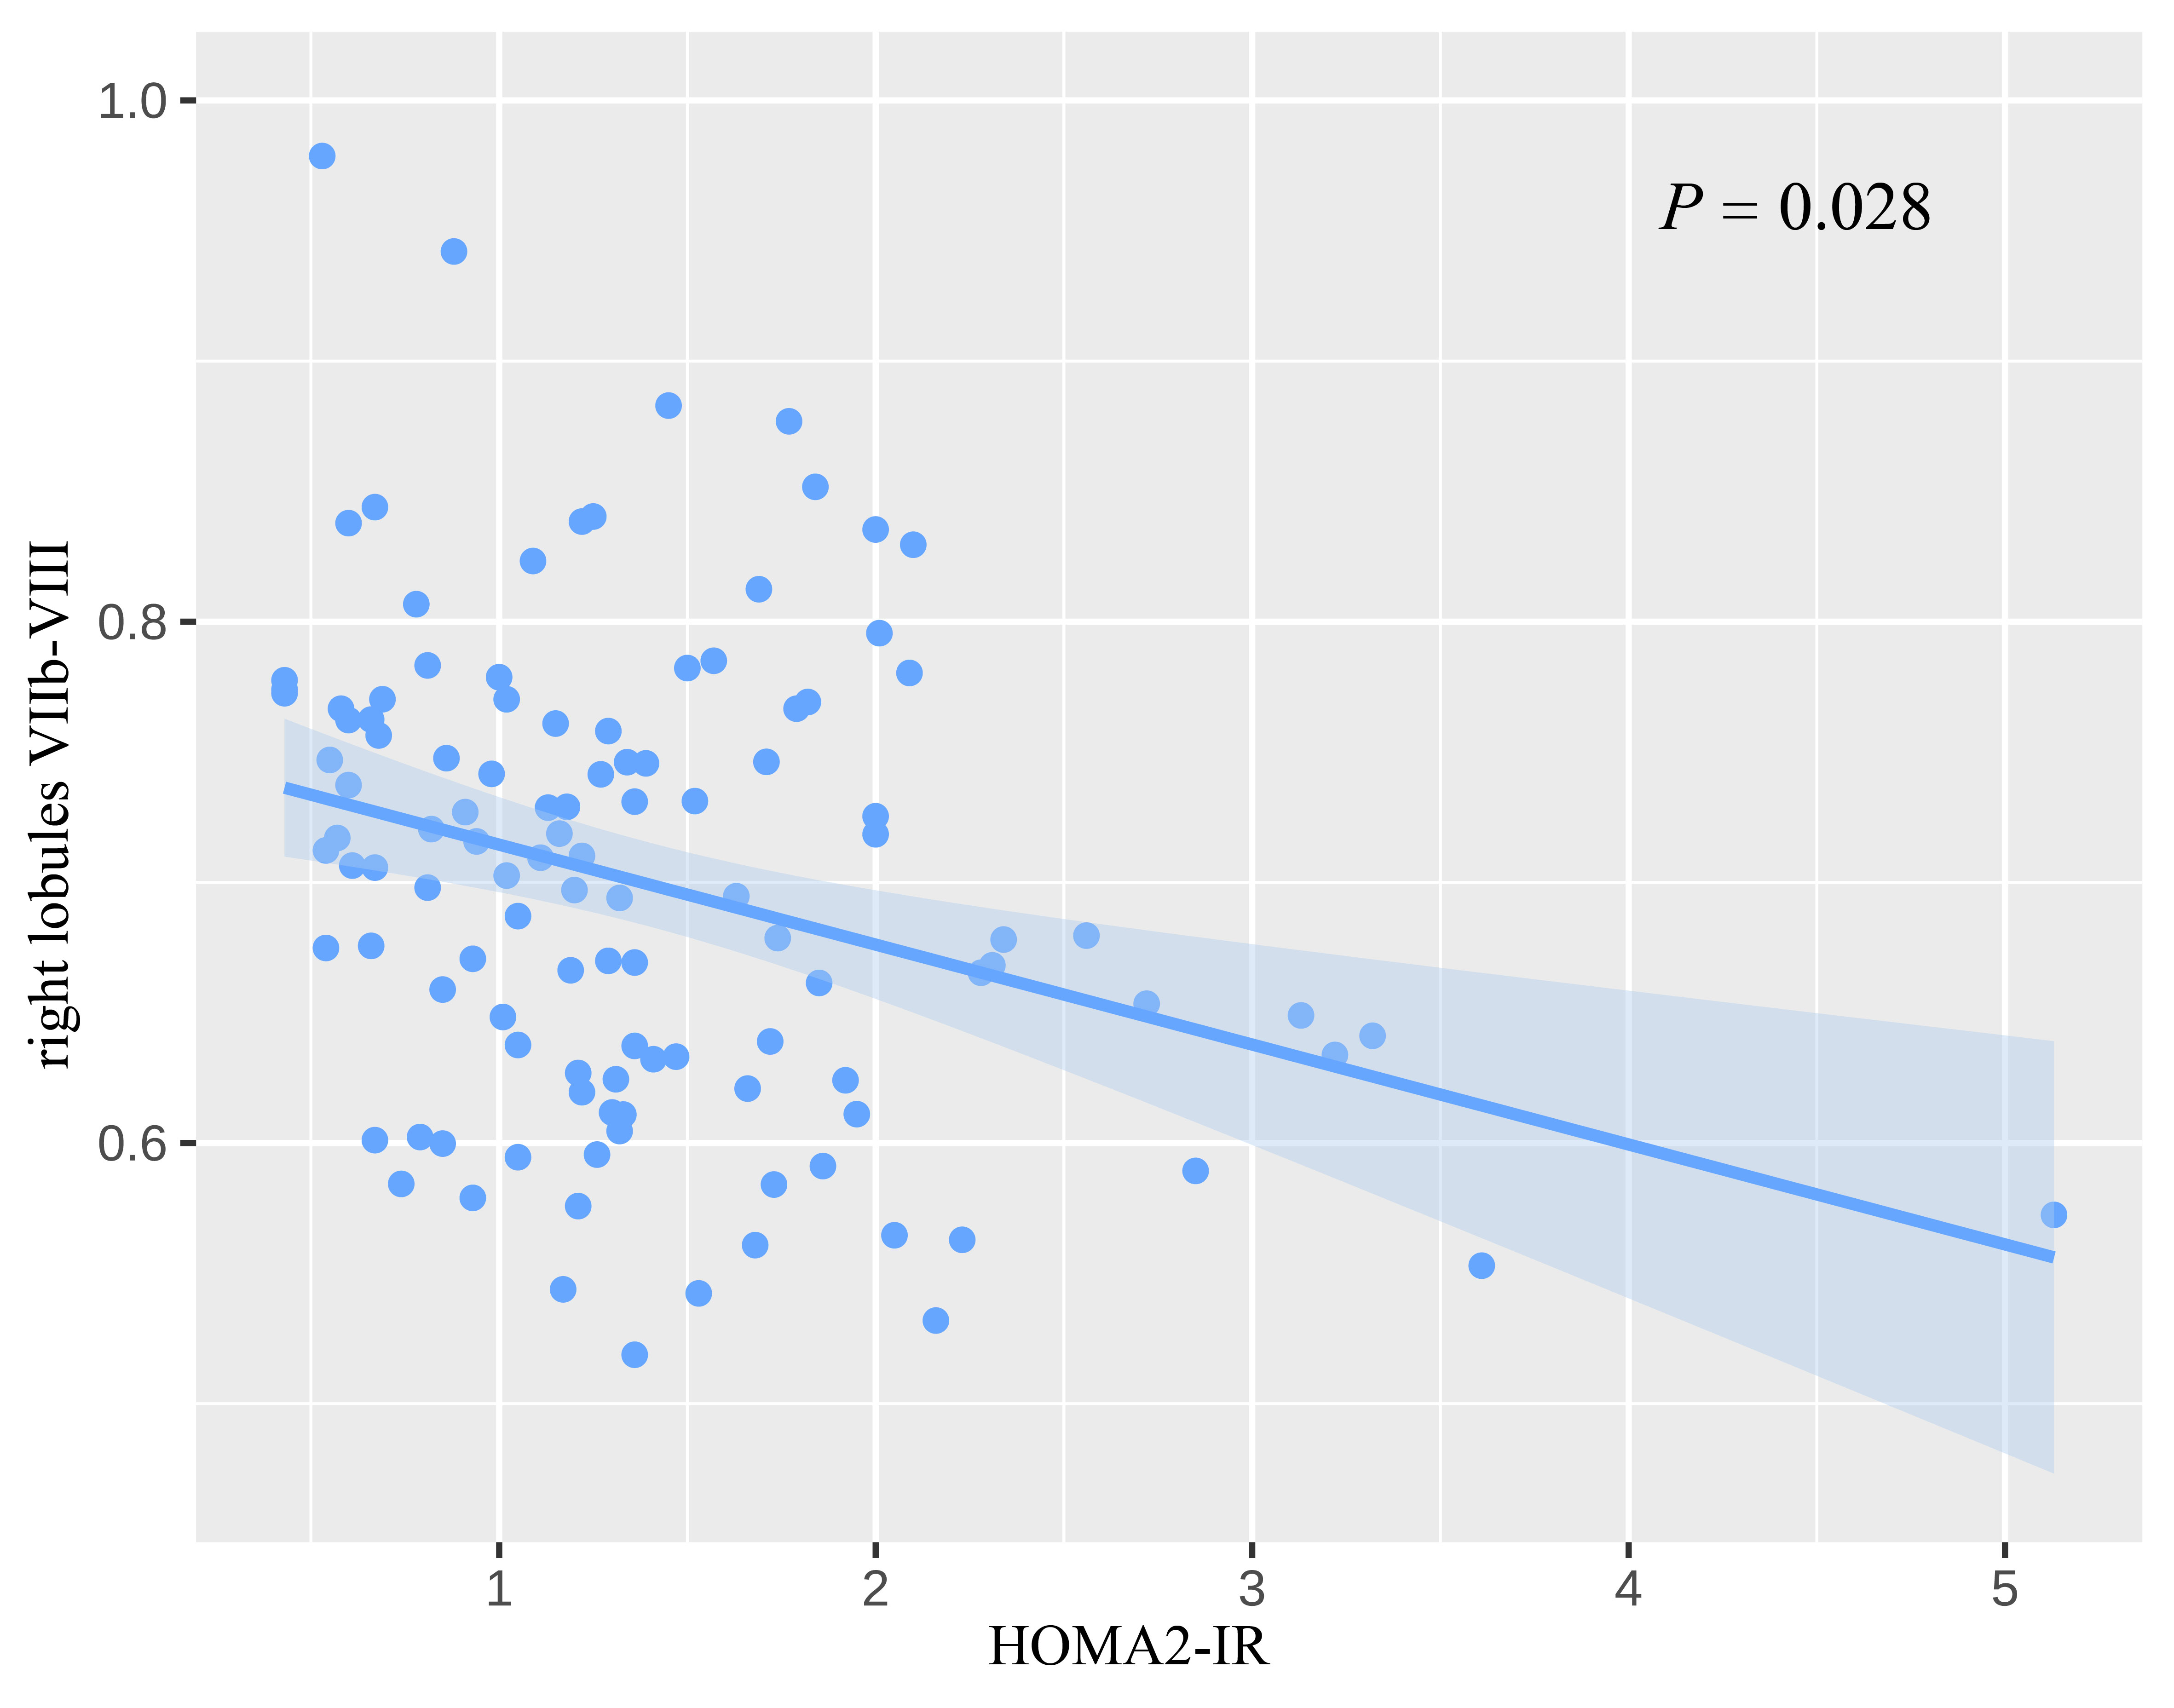
Results: We exhibited more pronounced reductions in GMV and FC of specific cerebellar subregions in T2DM-IR and negative correlation between GMV of lobules VIIb-VIII and insulin resistance.
Impact: These findings contribute to our understanding of the pathophysiological role of cerebellum damage in T2DM-IR. It provides a new research idea and method for us to elucidate brain impairment of T2DM.
Introduction
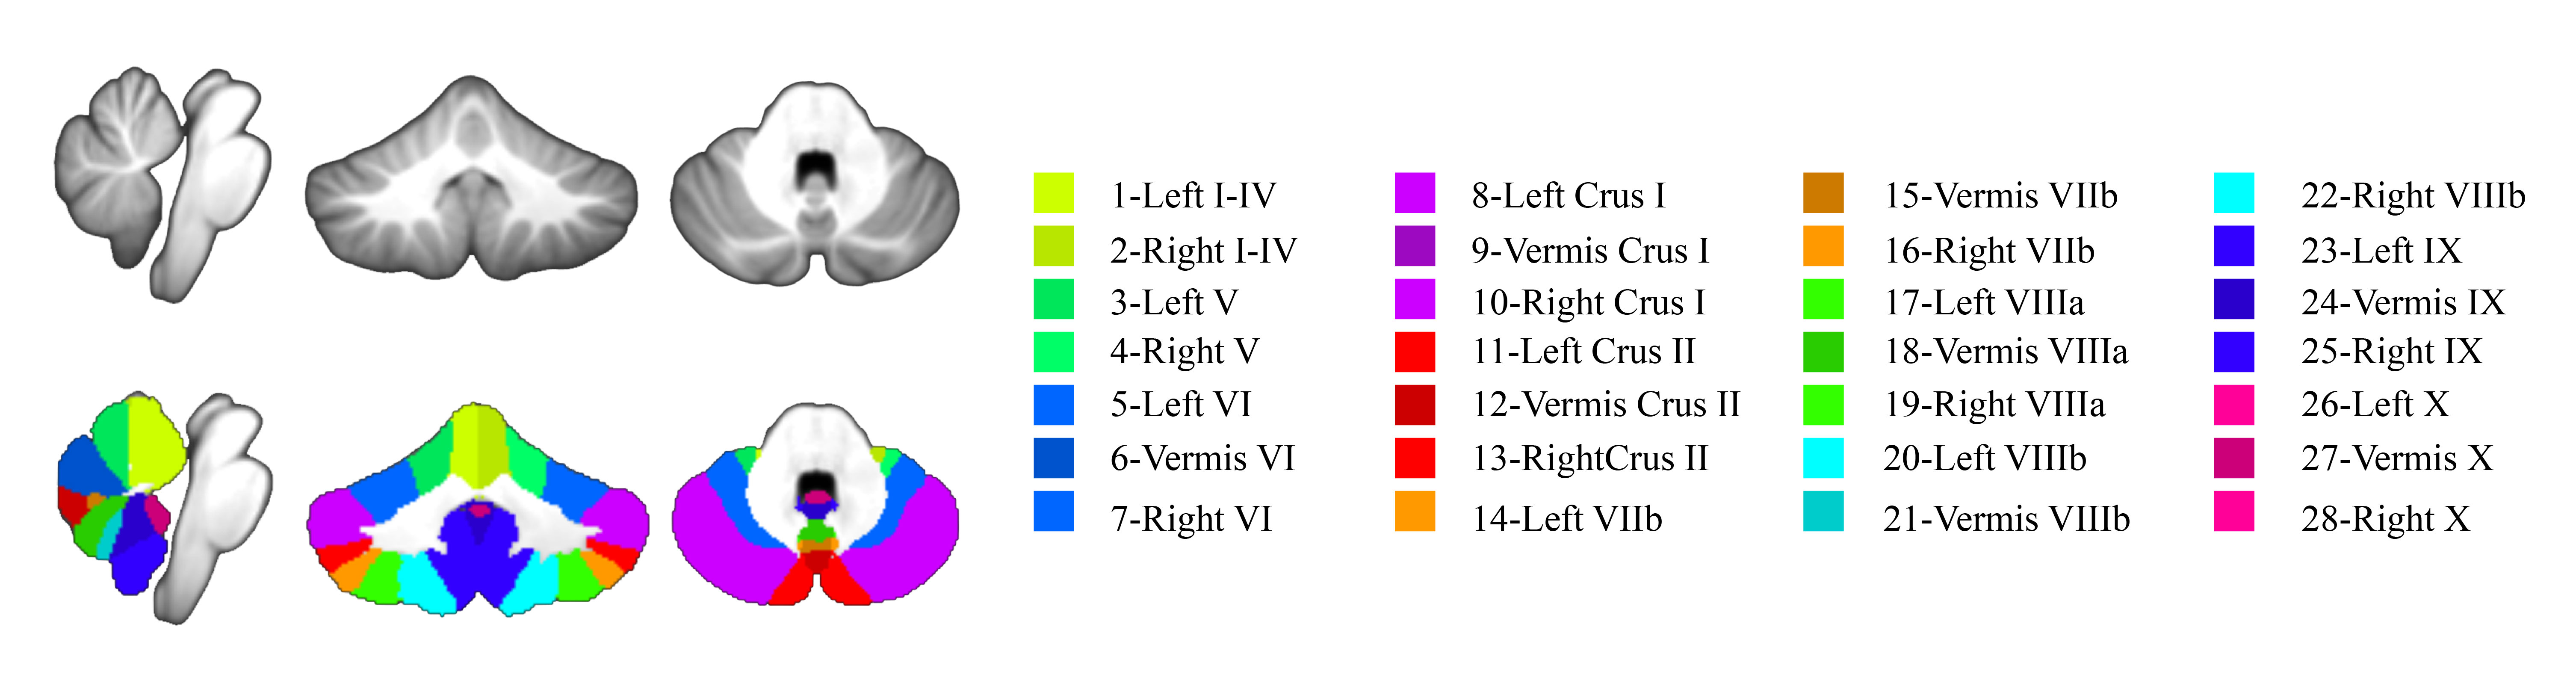
Insulin resistance is a key characteristic of type 2 diabetes mellitus (T2DM). Brain insulin resistance (IR) can be defined as the impaired response of brain cells to insulin [1], this can lead to various central symptoms, including cognitive and emotional impairment. Researchers have identified higher insulin receptor gene expression in the cerebellum than cerebrum in the human postmortem brain [2]. And emerging evidence suggests that the cerebellum plays a important role in cognitive, emotional and reward-related processes [3]. Studies from neuroimaging have revealed cerebellar structural and functional connectivity abnormalities in T2DM [4, 5]. Recent studies have also found that cerebellar atrophy was associated with insulin resistance and poorer cognitive performance in older adults with dysglycemia [4]. However, it is still unclear whether cerebellar changes in individuals with T2DM are linked to insulin resistance and how these changes impact cognitive and emotional function. The emerging Spatially Unbiased Infratentorial (SUIT, Figure 1) [6] template improve the organization of individual fissures and preserves more anatomical details of the cerebellum by employing a nonlinear atlas generation algorithm compared to traditional voxel-based morphometry (VBM) analysis based on the Montreal Neurological Institute (MNI) template [7]. Therefore, in this study, The VBM analysis based on SUIT template and seed-based functional connectivity analysis were used to identify specific vulnerable cerebellar subregions in T2DM with insulin resistance and explore their potential association with cognitive-emotional functions.Materials and Methods
Forty-three T2DM with insulin resistance (T2DM-IR) patients (the updated homeostatic model assessment of insulin resistance, HOMA2-IR >1.4) [8-10], 72 T2DM patients without insulin resistance (T2DM-nonIR, HOMA2-IR < 1.4), and 50 healthy controls (HCs) were included. This study was approved by the Medical Ethics Committee of Gansu Provincial Hospital. All participants have signed the informed consent. All participants completed the collection of clinical variables and neuropsychological scales. Brain Magnetic Resonance Imaging (MRI) data were collected using a 3.0 T MRI scanner (MAGNETOM Skyra, Siemens Healthcare, Erlangen, Germany) equipped with a 32-channel head coil. High-resolution three-dimensional T1WI structural images were acquired using a three-dimensional magnetization prepares repaid acquisition gradient echo (3D-MPRAGE) sequence, Resting-state functional images were acquired using Blood Oxygen Level-Dependent (BOLD) Gradient echo-Echo planar imaging (GRE-EPI) sequence. The GMV data of the cerebellum were acquired and analyzed using SUIT toolbox, Statistical parametric mapping software (SPM12) and Matrix Laboratory platform (MATLAB R2018b). The estimated total intracranial volume (eTIV) of all participants was acquired using FreeSurfer software for subsequent statistical analysis as a covariate. The functional data were preprocessed and analyzed using Data Processing & Analysis for Brain Imaging toolbox (DPABI_V5.1) based on SPM12 on MATLAB. SPSS (version 26) or R (version 4.2.1) was used for statistical analysis. A P-value < 0.05 was statistically significant.Results
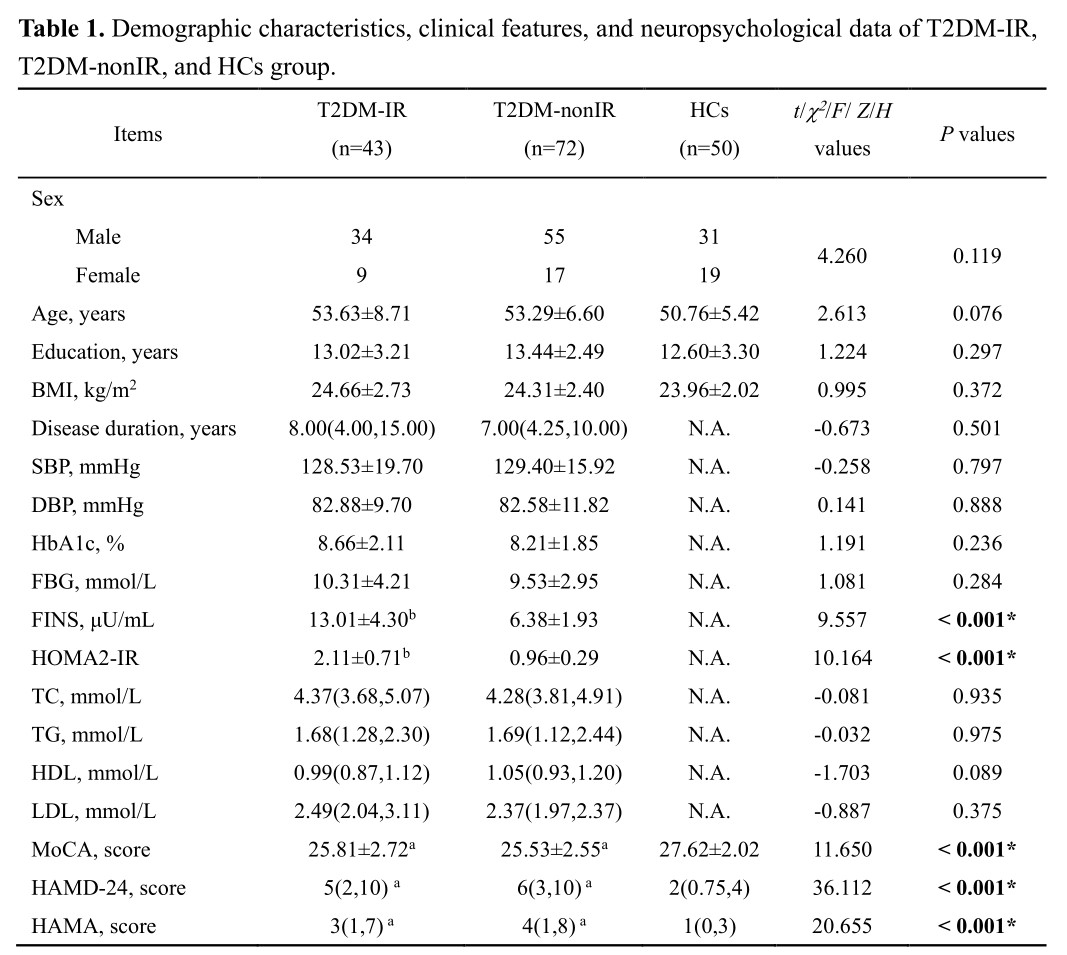
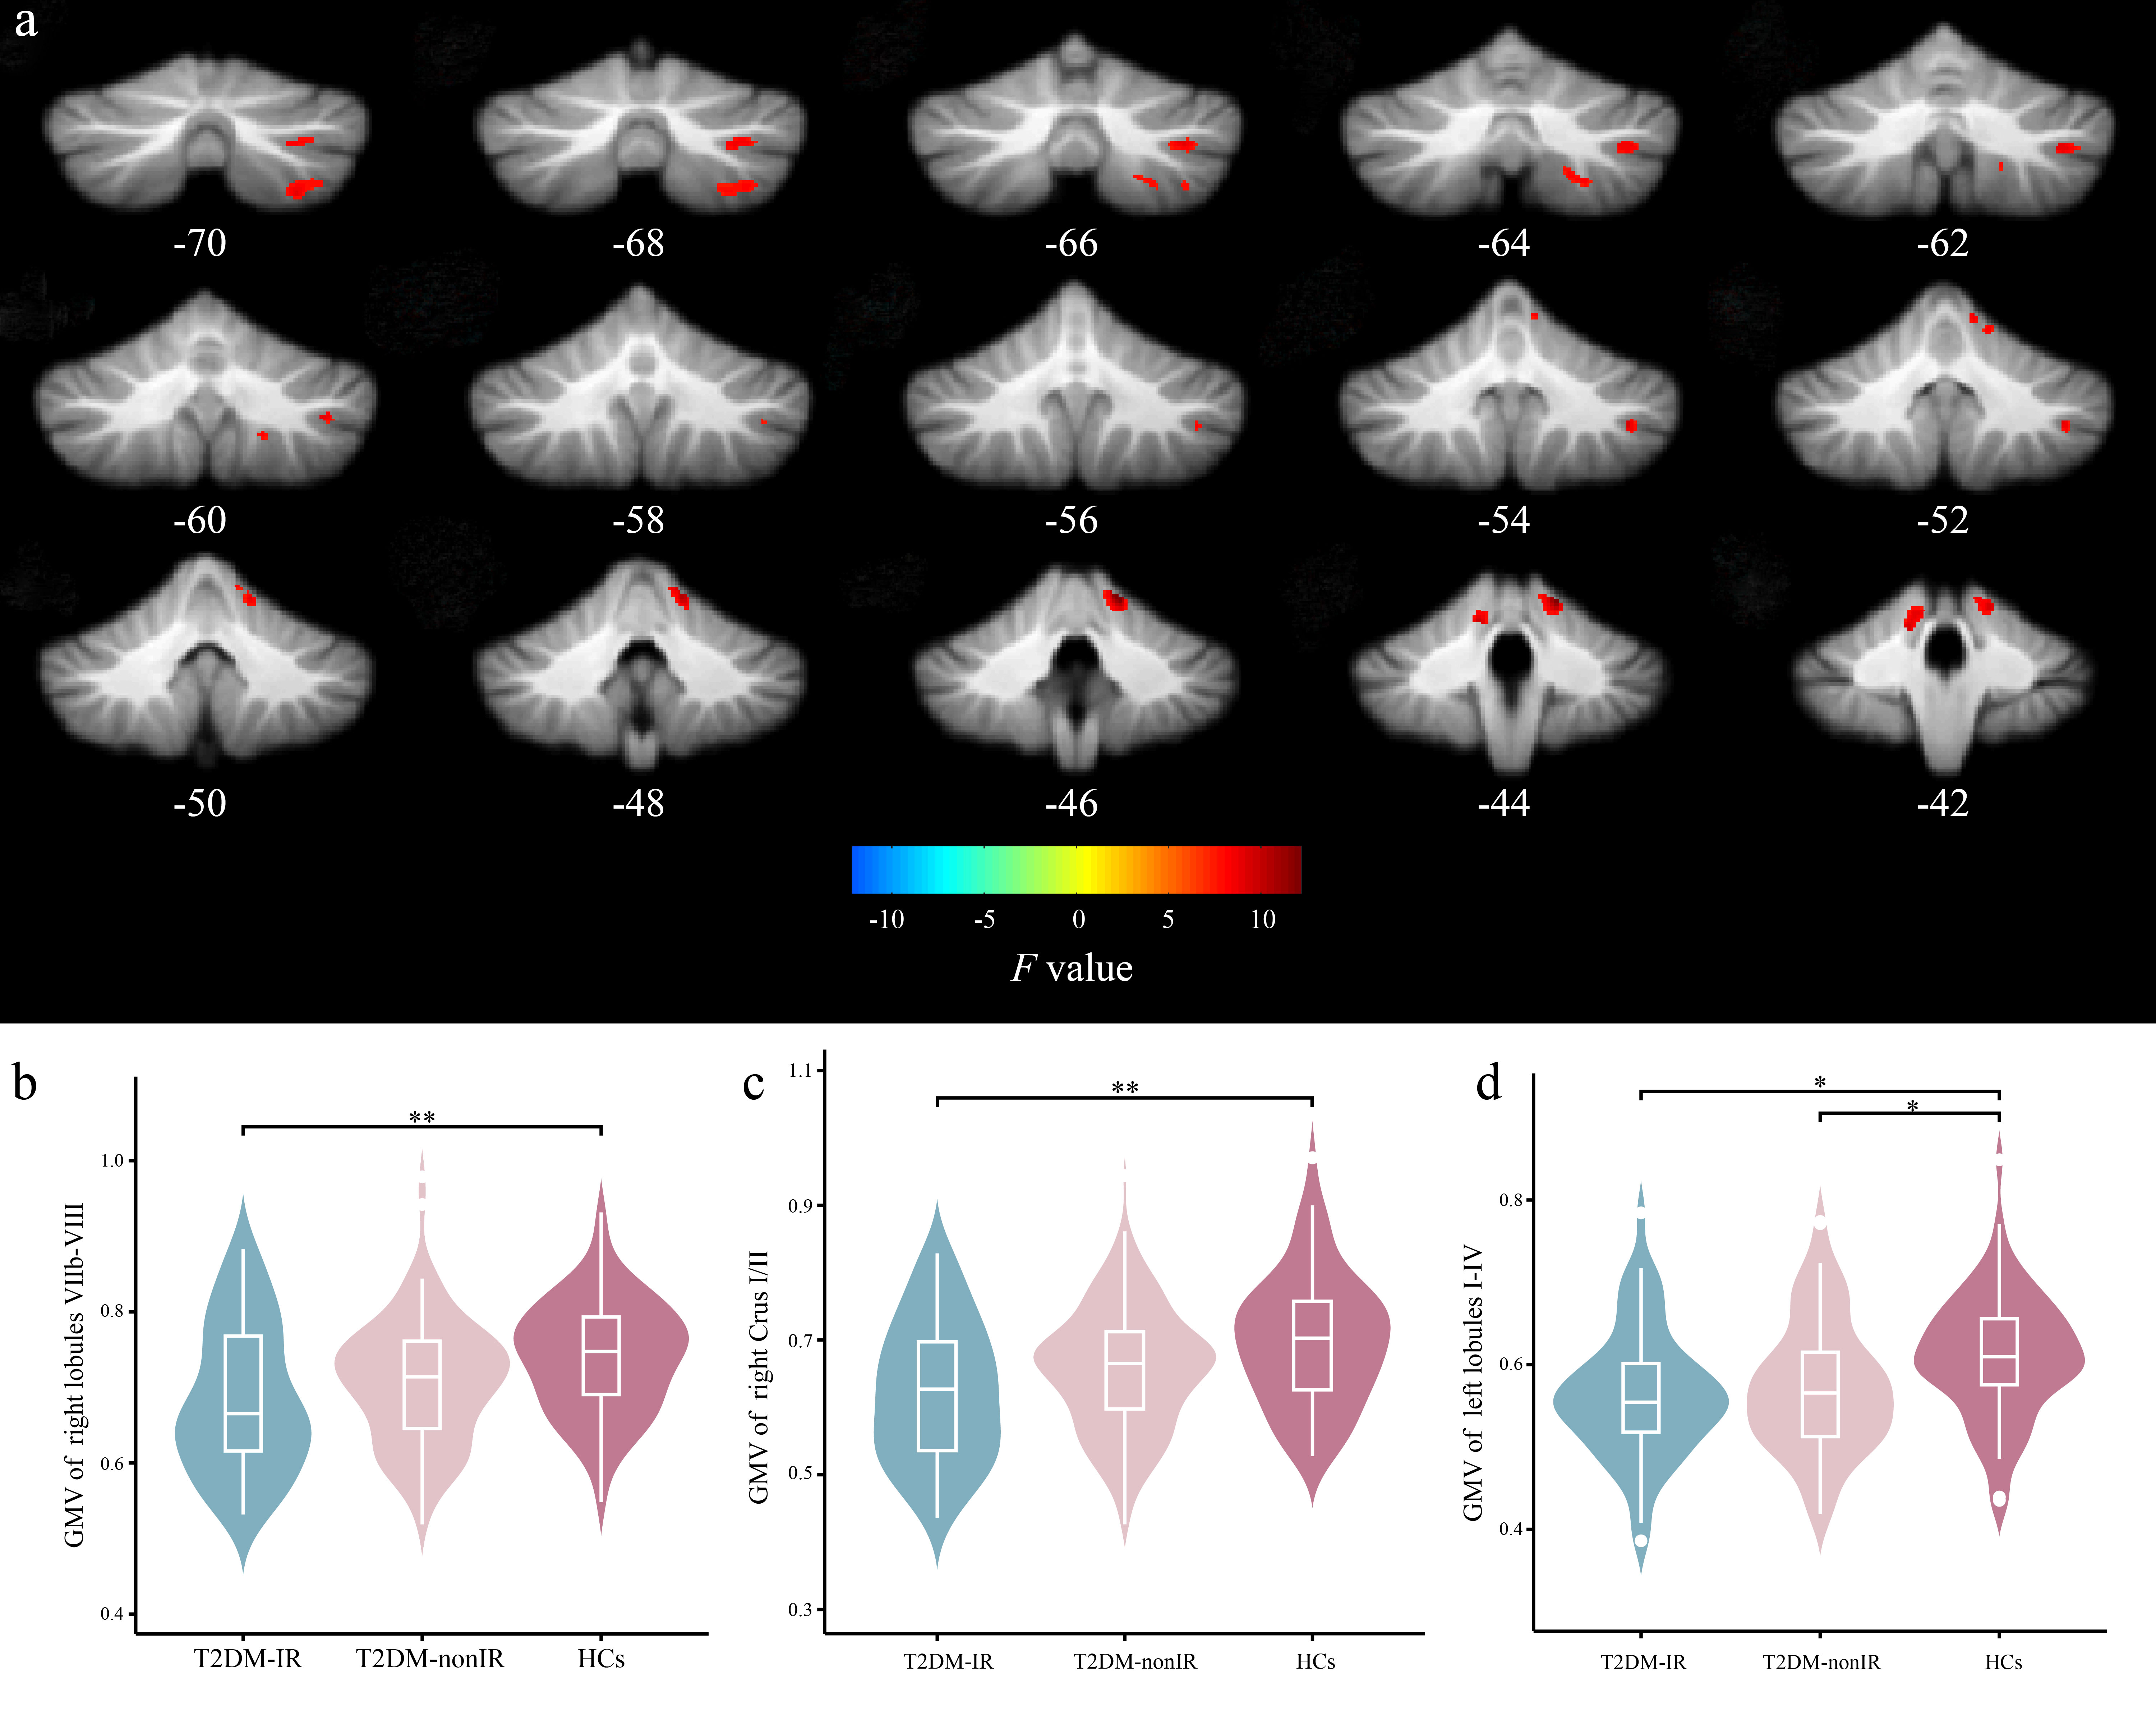
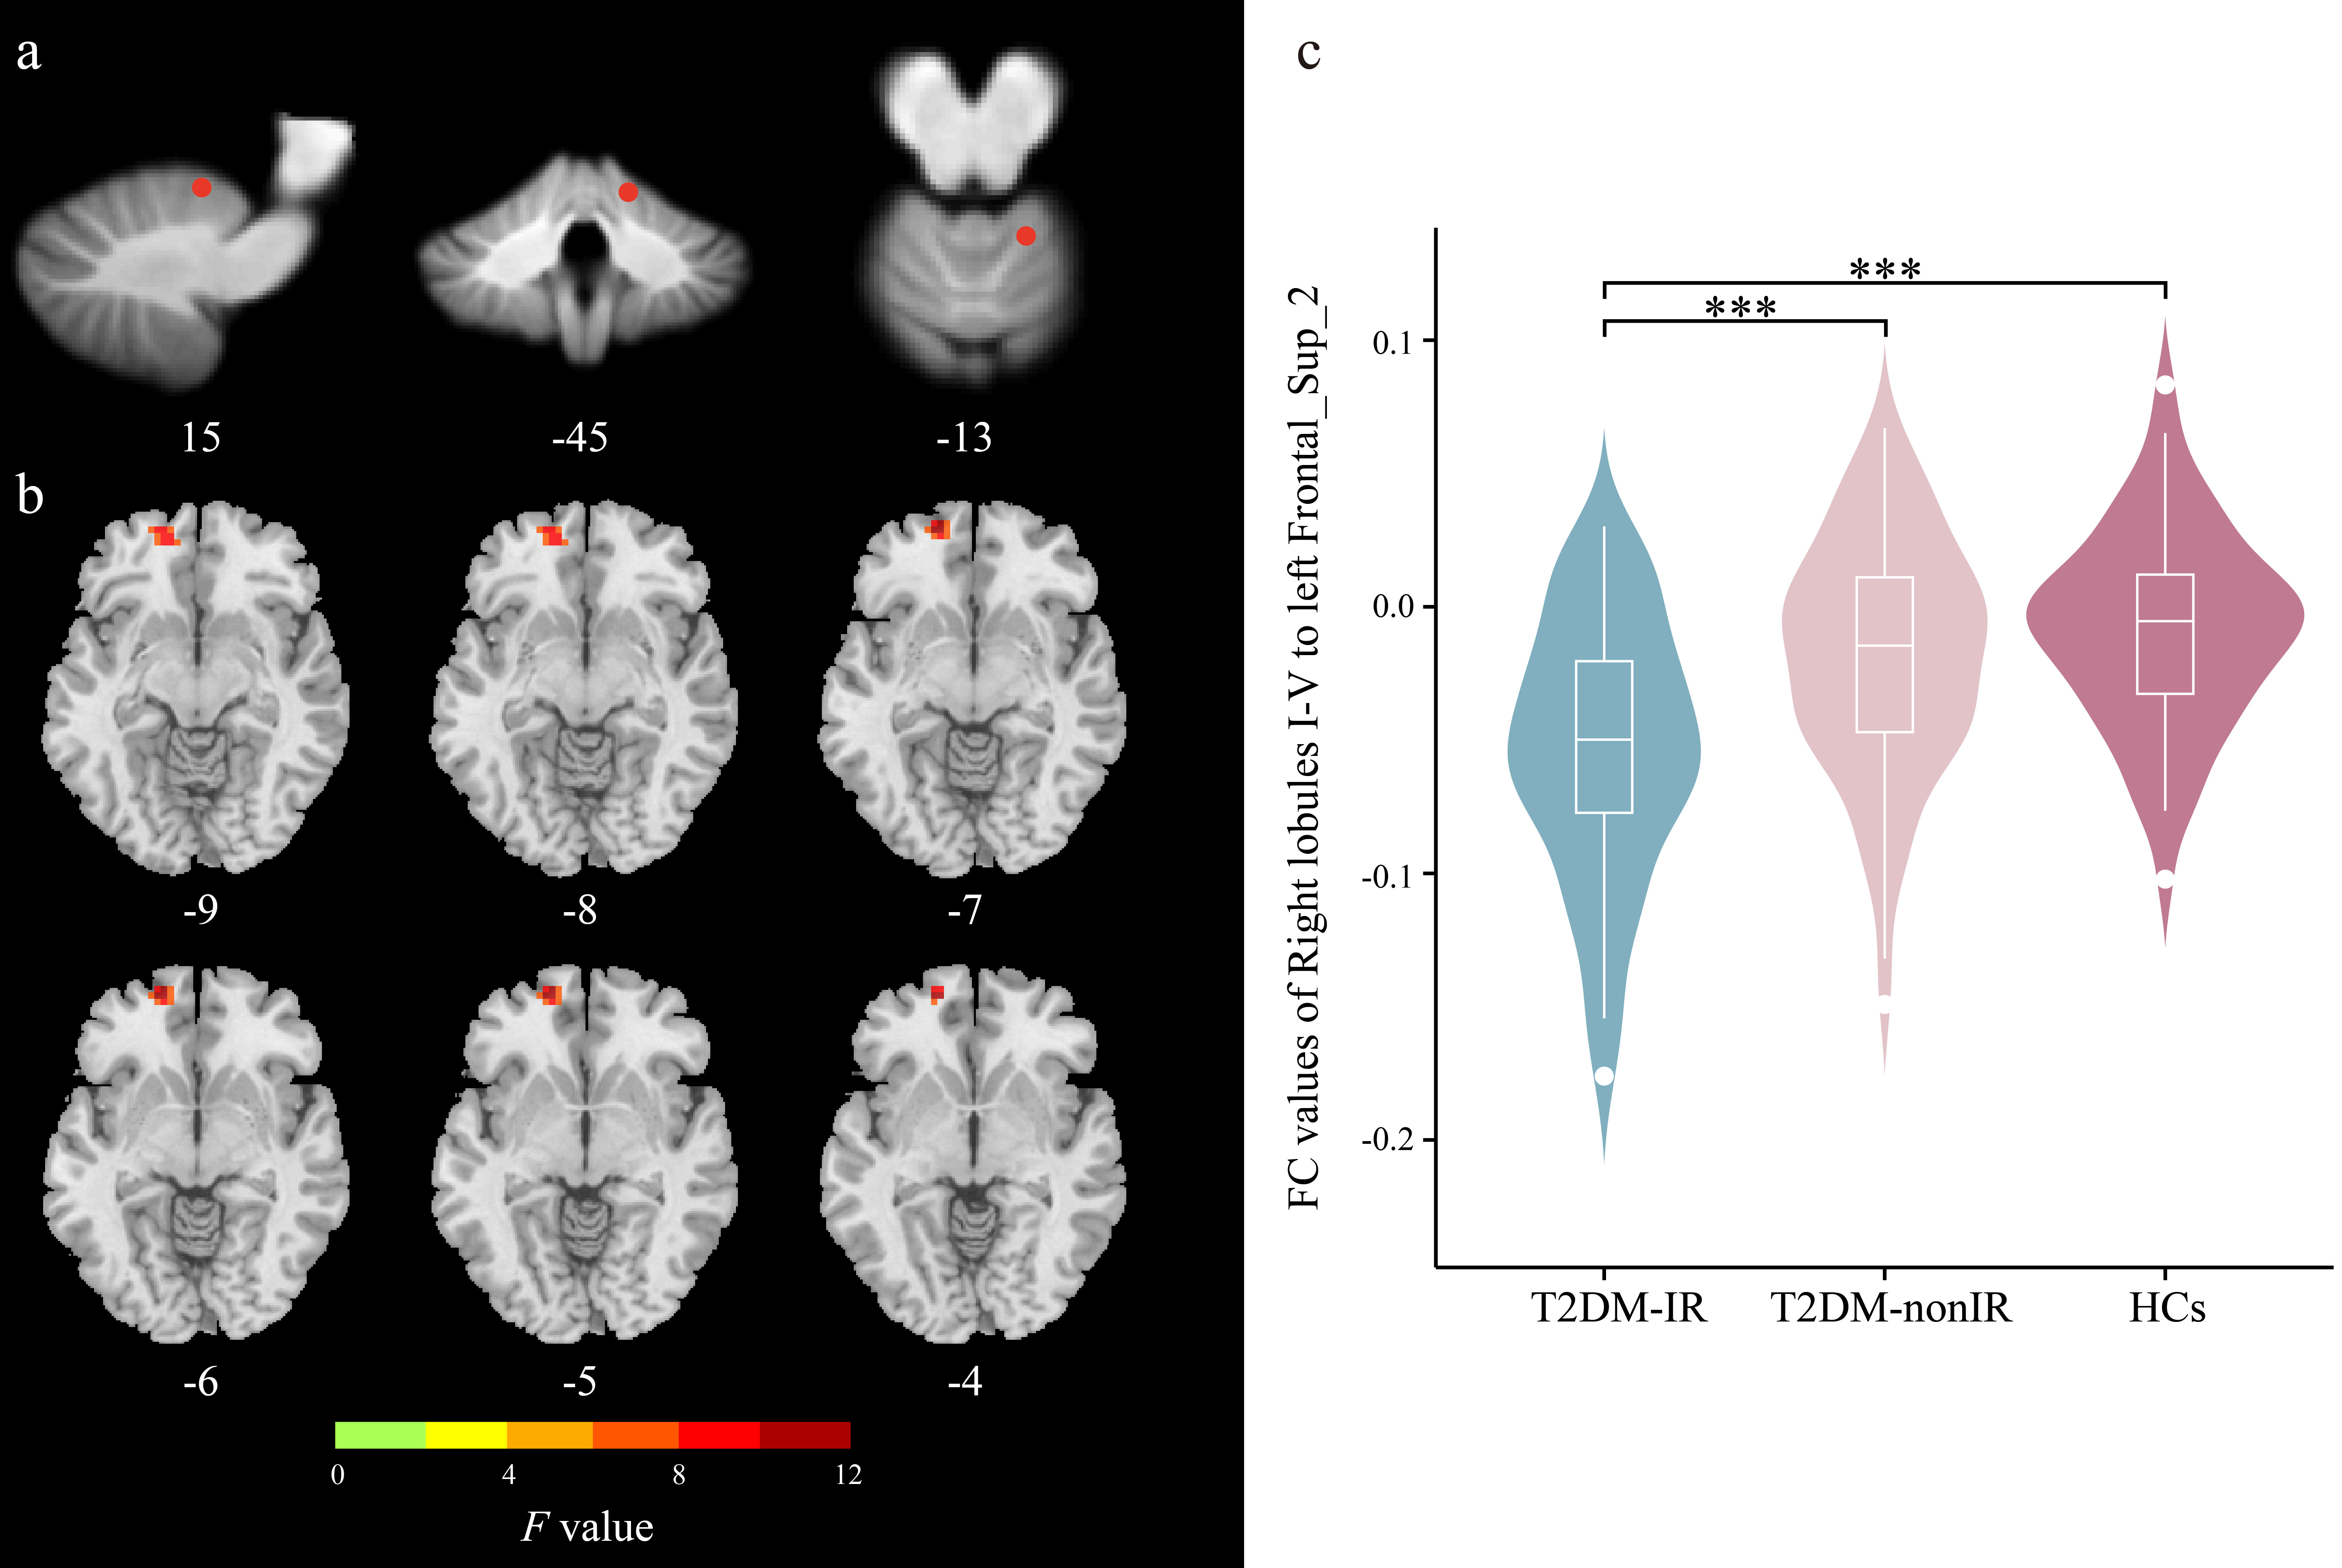
Clinical variables are presented in Table 1. Compared to HCs, both T2DM-IR and T2DM-nonIR groups showed significantly lower Montreal Cognitive Assessment scores and higher 24-item Hamilton Depression Scale and Hamilton Anxiety Scale scores. Additionally, compared to the T2DM-nonIR group, the T2DM-IR group exhibited higher fasting insulin levels and HOMA2-IR values. Compared to HCs, T2DM-IR patients showed decreased GMV in the right lobules VIIb-VIII, Crus I/II, and the left lobules I-IV; meanwhile, T2DM-nonIR patients exhibited decreased GMV in the left lobules I-IV (Figure 2). Decreased functional connectivity was observed between the right lobules I-V and left superior frontal gyrus in T2DM-IR vs. T2DM-nonIR, as well as T2DM-IR vs. HCs (Figure 3). Importantly, the correlation between the GMV of the lobules VIIb-VIII and HOMA2-IR was observed (Figure 4).Discussion
Cerebellar lobules VIIb-VII and CrusI/II play an important role in cognition and emotion [11, 12], which involved in the frontal-parietal, default mode and executive control brain network. This may be the cause of cognitive and emotional decline in T2DM patients [13, 14]. The correlation between lobules VIIb-VIII and HOMA2-IR may indicate that those cerebellar subregions are sensitive to insulin resistance, and its specific mechanism is expected to be further explored. Lobules I_IV is associated with motor function [15], Regrettably, our study could not explore the relationship between the reduction of GMV and motor function due to the lack of evaluation of motor function in T2DM. Prefrontal lobes play a crucial role in higher cognitive functions, especially working memory. Reduced functional connectivity between the cerebellar lobules and prefrontal lobes may indicate more severe cognitive impairment in T2DM-IR. In conclusion, this study can provide a new research idea for the brain impairment of T2DM with insulin resistance.Conclusion
The current findings enhance our understanding of the pathophysiological role of the cerebellum in T2DM-IR and emphasize its potential as a therapeutic target for mitigating brain impairment in T2DM with insulin resistance.Acknowledgements
We are grateful to all the participants for their cooperation and patience.References
1. Arnold, S.E., et al., Brain insulin resistance in type 2 diabetes and Alzheimer disease: concepts and conundrums. Nat Rev Neurol, 2018. 14(3): p. 168-181.
2. Kullmann, S., et al., Central nervous pathways of insulin action in the control of metabolism and food intake. Lancet Diabetes Endocrinol, 2020. 8(6): p. 524-534.
3. Metoki, A., Y. Wang, and I.R. Olson, The Social Cerebellum: A Large-Scale Investigation of Functional and Structural Specificity and Connectivity. Cereb Cortex, 2022. 32(5): p. 987-1003.
4. Oh, D.J., et al., Brain Structural Alterations, Diabetes Biomarkers, and Cognitive Performance in Older Adults With Dysglycemia. Front Neurol, 2021. 12: p. 766216.
5. Hirabayashi, N., et al., Association Between Diabetes and Gray Matter Atrophy Patterns in a General Older Japanese Population: The Hisayama Study. Diabetes Care, 2022. 45(6): p. 1364-1371.
6. Price, M., V.A. Cardenas, and G. Fein, Automated MRI cerebellar size measurements using active appearance modeling. Neuroimage, 2014. 103: p. 511-21.
7. Diedrichsen, J., A spatially unbiased atlas template of the human cerebellum. Neuroimage, 2006. 33(1): p. 127-38.
8. Manco, M., et al., Cross-sectional investigation of insulin resistance in youths with autism spectrum disorder. Any role for reduced brain glucose metabolism? Transl Psychiatry, 2021. 11(1): p. 229.
9. Saber-Ayad, M., et al., The FTO rs9939609 "A" allele is associated with impaired fasting glucose and insulin resistance in Emirati population. Gene, 2019. 681: p. 93-98.
10. Wallace, T.M., J.C. Levy, and D.R. Matthews, Use and abuse of HOMA modeling. Diabetes Care, 2004. 27(6): p. 1487-95.
11. Yang, H., et al., Cerebellar atrophy and its contribution to motor and cognitive performance in multiple system atrophy. NeuroImage: Clinical, 2019. 23.
12. Stoodley, C.J. and J.D. Schmahmann, Evidence for topographic organization in the cerebellum of motor control versus cognitive and affective processing. Cortex, 2010. 46(7): p. 831-44.
13. Mehnert, J. and A. May, Functional and structural alterations in the migraine cerebellum. J Cereb Blood Flow Metab, 2019. 39(4): p. 730-739.
14. Chen, Z., et al., Functional connectome of human cerebellum. Neuroimage, 2022. 251: p. 119015.
15. Gellersen, H.M., et al., Cerebellar atrophy in neurodegeneration-a meta-analysis. J Neurol Neurosurg Psychiatry, 2017. 88(9): p. 780-788.
Figures