3422
Comparison of BOLD and ASL-derived Measures of Cerebrovascular Reactivity Acquired During Breath-Hold1Department of Neurosciences, Imaging and Clinical Sciences, "D'Annunzio" University of Chieti-Pescara, Chieti, Italy, 2Institute for Advanced Biomedical Technologies, "D'Annunzio" University of Chieti-Pescara, Chieti, Italy, 3Cardiff University Brain Research Imaging Centre (CUBRIC), School of Physics and Astronomy, Cardiff University, Cardiff, United Kingdom, 4Cardiff University Brain Research Imaging Centre (CUBRIC), School of Psychology, Cardiff University, Cardiff, United Kingdom
Synopsis
Keywords: Task/Intervention Based fMRI, Data Analysis, Cerebrovascular reactivity
Motivation: Breath-hold BOLD fMRI may be regarded as a proxy of deoxygenated cerebral blood volume (CBVdHb), instead of cerebrovascular reactivity (CVR) when blood flow changes are uniform in response to breath-hold.
Goal(s): We aimed to test this assumption in healthy volunteers.
Approach: We measured the spatial uniformity of CVR derived from arterial spin labelling and BOLD fMRI data acquired simultaneously during a breath-holding task.
Results: Breath-hold induced a more uniform fractional increase in CBF than in BOLD signal. Thus, the spatial variability in apparent BOLD-CVR is likely due to variation in CBVdHb with little variability arising from spatial differences in vascular reactivity.
Impact: Under isometabolic conditions in healthy volunteers, owing to the uniform change in blood flow induced by breath-hold, it is possible to infer maps of deoxygenated cerebral blood volume based on BOLD fMRI breath-hold data.
Introduction
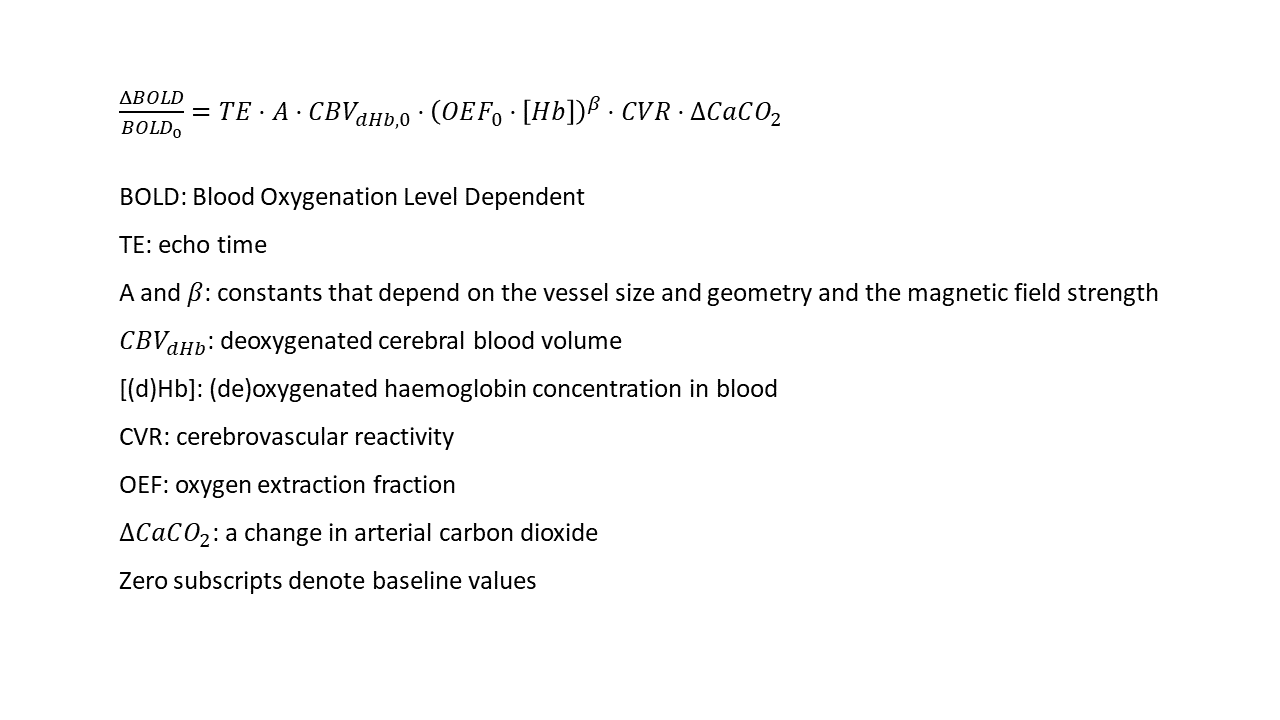
Blood oxygenation level dependent functional MRI (BOLD fMRI) acquired in conjunction with breath-holding has been regarded as a marker of cerebrovascular reactivity (CVR), that is, the ability of the brain vasculature to increase blood flow (CBF) following a vasodilatory stimulus. However, the variability in the relative BOLD signal change induced by vasodilation also strongly reflects the variability in the deoxyhaemoglobin-containing cerebral blood volume (CBVdHb) (Figure 1). Thus, we previously suggested that it may be more appropriate to regard breath-hold-induced variations in BOLD fMRI as a proxy of CBVdHb rather than CVR (i.e., derived from fractional changes in CBF)1. This approach assumes that the spatial variabilities in baseline OEF and CVR following breath-holding are marginal compared to those in CBVdHb. Here, we aim to test the assumption about CVR in healthy volunteers by exploiting arterial spin labelling (ASL) and BOLD fMRI data acquired simultaneously during a breath-holding task.Methods
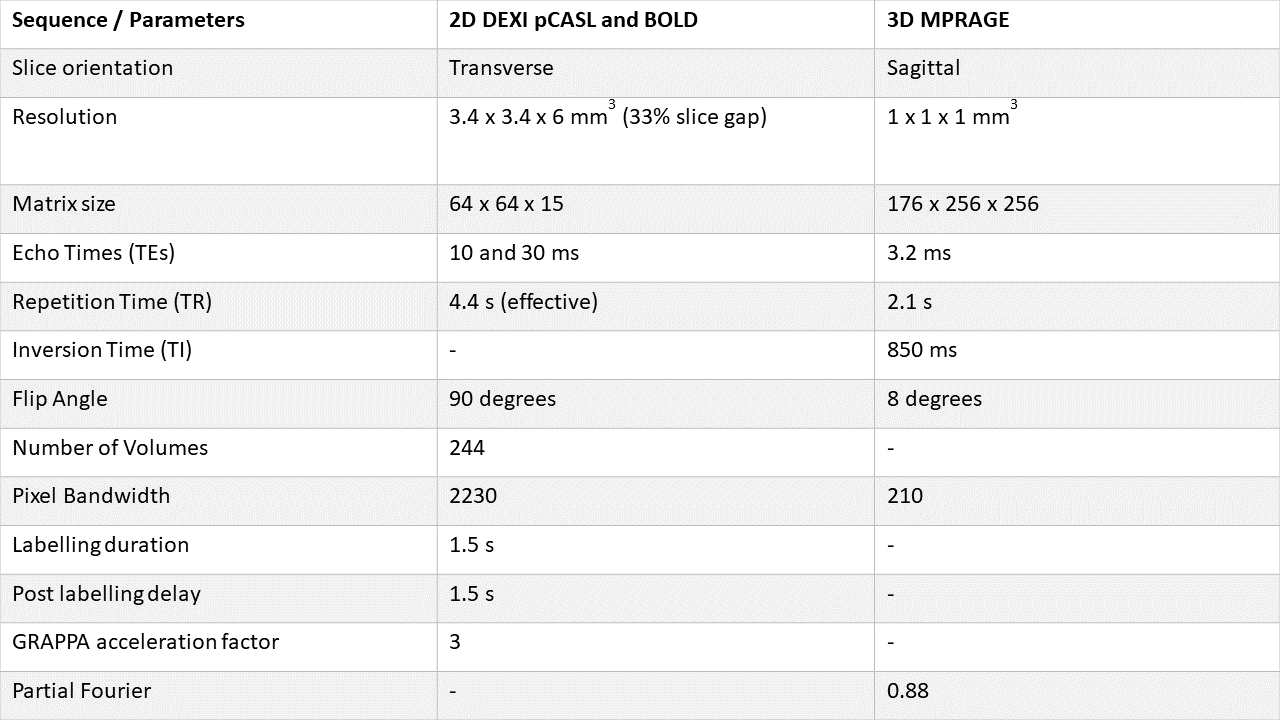
Data were acquired in 22 healthy subjects (11 females, 25.8 ± 6.2 years) at the Cardiff University Brain Research Imaging Centre (Cardiff, UK) on a 3 T Prisma MRI system with a 32-channel receive-only head coil (Siemens Healthineers, Erlangen, DE) and 1) an in-house dual excitation (DEXI) pCASL sequence with two inversion pulses for background suppression for simultaneous BOLD-ASL imaging during repeated breath-holding at rest; 2) a T1-weighted MPRAGE sequence for anatomical reference. The breath-holding protocol had ten 20-second repeats of breath-holding at end-expiration with 30 seconds recovery between each breath-hold (total time for the respiratory paradigm: 8 minutes 44 seconds). The acquisition parameters are shown in Table 1.For each subject, a trace of end-tidal carbon dioxide partial pressure (PetCO2) was calculated by linearly interpolating the peaks of the raw CO2 trace2 and considered a surrogate measure of arterial carbon dioxide (CO2) changes3,4.
Breath-hold BOLD fMRI and ASL images were motion-corrected using MCFLIRT5. BOLD fMRI data was expressed as fractional BOLD changes relative to their temporal mean, and high-pass Gaussian filtered. BOLD-CVR maps expressed as BOLD signal percent change per unit of PetCO2 were calculated using the General Linear Model framework and the PetCO2 trace as a regressor.
A mean per subject time series from ASL and BOLD voxels within a perfusion mask (thresholded between the 85th and 99th quantiles of the baseline CBF (CBF0)) was used to create a physiological regressor for calculating CBF/CBF0. Cross-correlation between the regressor and ASL data was used to estimate temporal shifts relative to the global signal, and regression against the ASL time series was used to calculate CBF/CBF0.
The BOLD fMRI images were aligned to the T1-weighted 2-mm isotropic Montreal Neurological Institute (MNI) atlas via the MPRAGE image using FLIRT and FNIRT5–8. The resulting transformation was applied to both the maps of BOLD-CVR and CBF/CBF0. In MNI space, a map of cortical grey matter (GM) was calculated based on the MNI GM tissue prior (thresholded at 0.25) by including the frontal, occipital, parietal and temporal lobes and the insula. The resulting mask was also aligned with the BOLD-CVR and CBF/CBF0 images by applying the inverse of the transformation from BOLD fMRI to MNI space.
The average spatial variability induced by breath hold of CBF relative to that of BOLD-CVR was evaluated in the cortical GM of each subject. A ratio of spatial variabilities (RSV) was calculated as the ratio between the coefficients of variation (CV=standard deviation/mean) of CBF/CBF0 and BOLD-CVR squared:
$$RSV=\frac{CV^2_{CBF/CBF0}}{CV^2_{BOLD-CVR}}$$
To obtain an estimate of RSV in the population, this analysis was also performed in MNI space. Here, to enable the calculation of RSV, the average CBF/CBF0 and BOLD-CVR maps were calculated across subjects.
Results
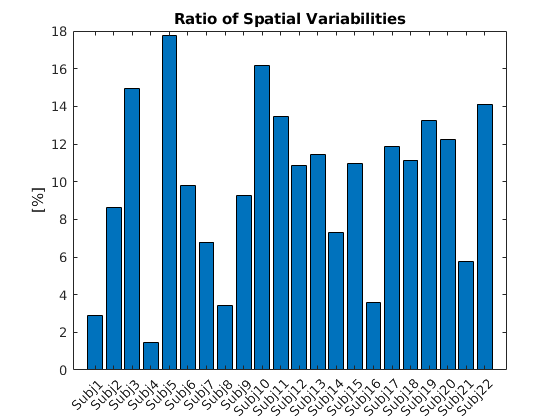
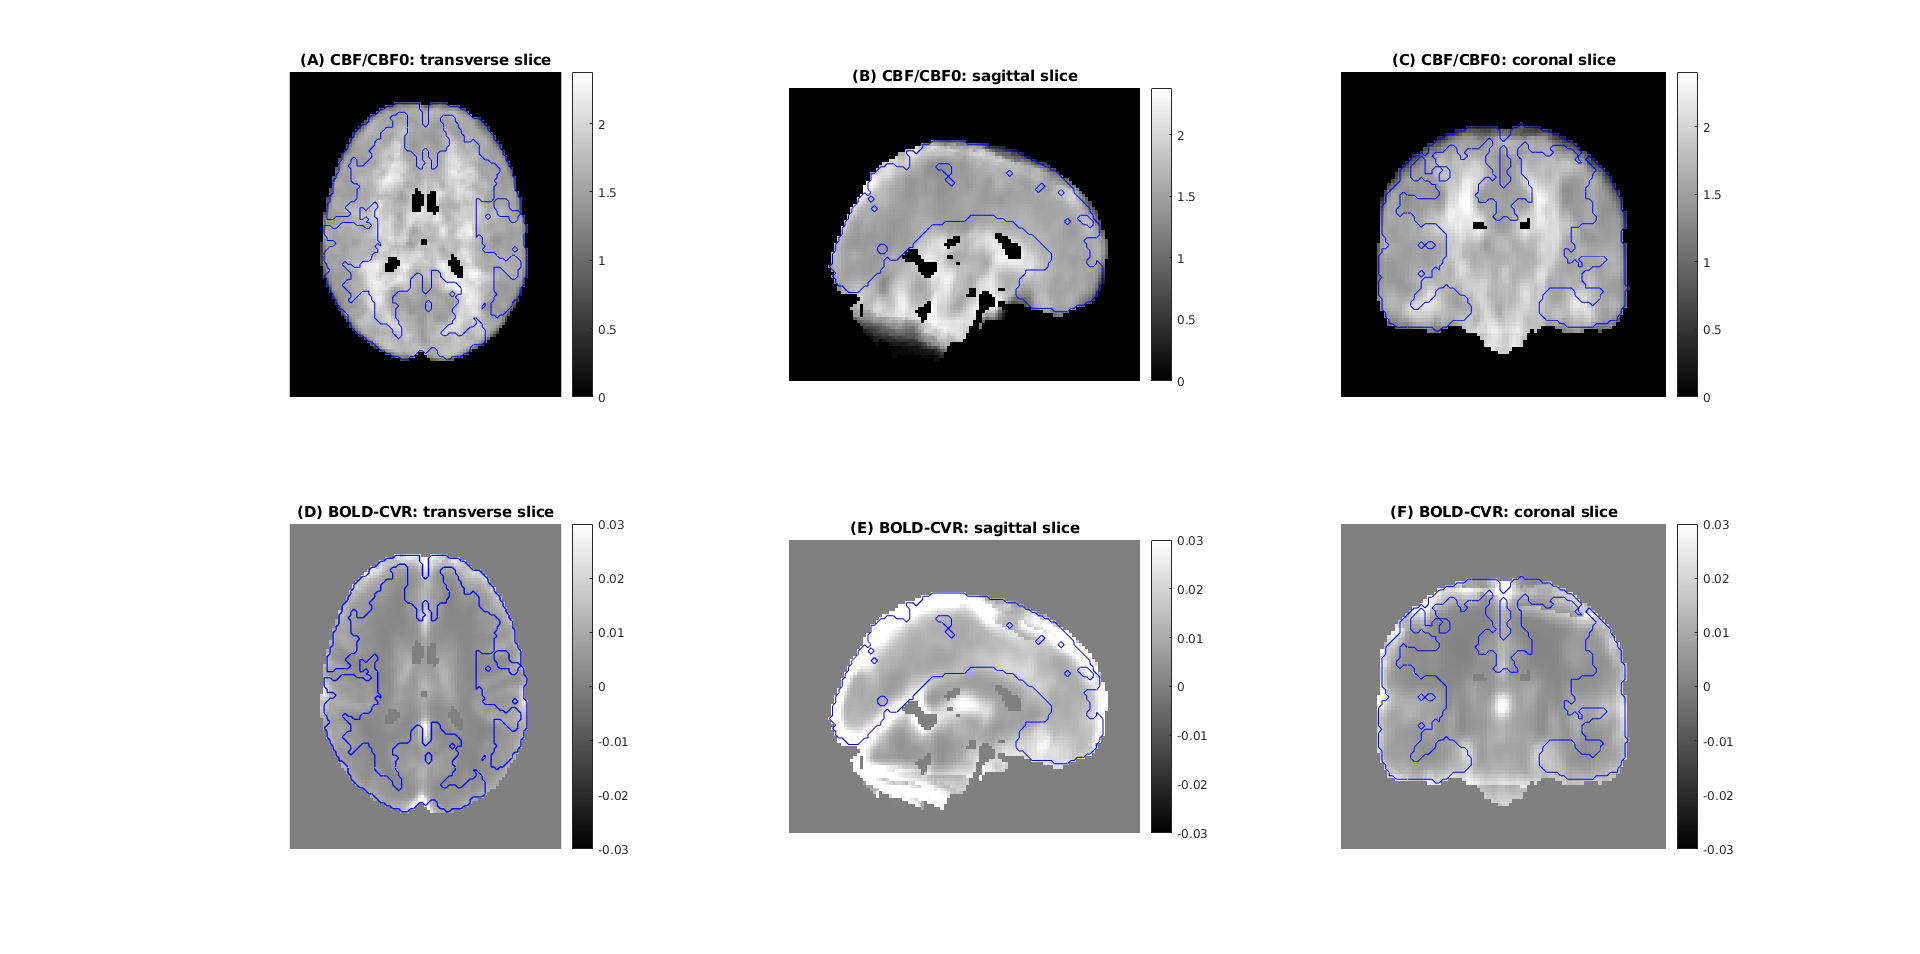
Figure 2 shows the RSV in the cortical GM of each subject. The individual values of RSV ranged between 1.5% and 17.8% with mean and standard deviation equal to 9.9 ± 4.5%.Figure 3 shows the average maps of CBF/CBF0 (A-C) and BOLD-CVR in MNI space (D-F) with overlaid the contours of the GM mask. Across subjects, in the cortical GM, the RSV was equal to 10.0%.
Discussion and Conclusions
The low RSV values supported the assumption of a relatively uniform fractional increase in CBF induced by breath hold (when compared to apparent BOLD-CVR). The spatial variability in apparent BOLD-CVR is likely due to variation in venous blood volume, especially that arising from large veins, with relatively little variability arising from spatial differences in vascular (blood flow) reactivity. Given the knowledge about a relatively uniform baseline OEF, under isometabolic conditions and in healthy volunteers, these results support the possibility to calculate maps of deoxygenated CBV based on BOLD fMRI breath-hold data.Acknowledgements
This project has received funding from the European Union’s Horizon Europe research and innovation programme under the Marie Skłodowska-Curie grant agreement No 101066055 – acronym HERMES. Views and opinions expressed are however those of the author(s) only and do not necessarily reflect those of the European Union or the European Research Executive Agency (REA). Neither the European Union nor the granting authority can be held responsible for them.
Funded in part by the European Union - NextGenerationEU under the National Recovery and Resilience Plan (NRRP), Mission 4 Component 2 - M4C2, Investment 1.5 - Call for tender No. 3277 of 30.12.2021 Italian Ministry of Universities Award Number: ECS0000004, Project Title: “Innovation, digitalisation and sustainability for the diffused economy in Central Italy,” Concession Degree No. 1057 of 23.06.2022 adopted by the Italian Ministry of Universities, CUP: D73C22000840006.
This project was partially supported by the UK Engineering and Physical Sciences Research Council (EP/S025901/1).
We acknowledge the members of the Welsh Advance Neuroimaging Database for acquiring this dataset and the support from the Wellcome Trust (WT104943/Z/14/Z and 220575/Z/20/Z), and the EPSRC (EP/S025901/1).
Italian Ministry of University and Research, Research Projects of National Relevance (PRIN), Project Code: 2022BERM2F, Project Title: “Mapping Mitochondrial Function and Oxygen Metabolism in the Human Brain with Magnetic Resonance Imaging.” Concession decree No. 1065 of 18. 07.2023 adopted by the Italian Ministry of University and Research, ERC Sector LS7 “Prevention, Diagnosis and Treatment of Human Diseases”.
References
1. Biondetti E, Chiarelli AM, Lipp I, et al. Reducing Between-Subject Variability in Stimulus-Evoked BOLD fMRI Using Breath Hold-Derived Vascular Covariates. In: Joint Annual Meeting ISMRM-ESMRMB & ISMRT 31st Annual Meeting. 2022:Abstract 2120.
2. Chiarelli AM, Villani A, Mascali D, et al. Cerebrovascular reactivity in multiple sclerosis is restored with reduced inflammation during immunomodulation. Sci Rep. 2022;12(1):15453. doi:10.1038/s41598-022-19113-8
3. McSwain SD, Hamel DS, Smith PB, et al. End-Tidal and Arterial Carbon Dioxide Measurements Correlate Across All Levels of Physiologic Dead Space. Respiratory Care. 2010;55(3):288-293.
4. Takano Y, Sakamoto O, Kiyofuji C, Ito K. A comparison of the end-tidal CO2 measured by portable capnometer and the arterial P CO2 in spontaneously breathing patients. Respiratory Medicine. 2003;97(5):476-481. doi:10.1053/rmed.2002.1468
5. Jenkinson M, Bannister P, Brady M, Smith S. Improved optimization for the robust and accurate linear registration and motion correction of brain images. Neuroimage. 2002;17(2):825-841. doi:10.1016/s1053-8119(02)91132-8
6. Jenkinson M, Smith S. A global optimisation method for robust affine registration of brain images. Med Image Anal. 2001;5(2):143-156. doi:10.1016/s1361-8415(01)00036-6
7. Jenkinson M, Beckmann CF, Behrens TEJ, Woolrich MW, Smith SM. FSL. Neuroimage. 2012;62(2):782-790. doi:10.1016/j.neuroimage.2011.09.015
8. Andersson JLR, Jenkinson M, Smith S. Non-Linear Registration Aka Spatial Normalisation. FMRIB Centre, Oxford, United Kingdom; 2007.
Figures