3415
Optimising Functional Quantitative Susceptibility Mapping (fQSM): The Effect of Multiband Acceleration and Absolute vs. Signed QSM1Medical Physics and Biomedical Engineering, University College London, London, United Kingdom
Synopsis
Keywords: Task/Intervention Based fMRI, Susceptibility, functional susceptibility mapping fQSM
Motivation: fQSM has emerged as a complementary technique to fMRI but the effect of multiband acceleration factors is unknown. Some studies have used absolute QSM input but no systematic comparison has been performed.
Goal(s): To investigate the impact of multiband factors on task-based fQSM activations and the effect of analysing absolute versus signed QSM.
Approach: We compared fQSM with a visual stimulus for multiband factors 3 and 4, and for signed and absolute QSM inputs.
Results: Increasing multiband factors reduced cluster sizes and activation t-scores in fQSM likely due to greater g-factor noise. Absolute QSM yielded fewer, larger activation clusters than signed QSM.
Impact: fQSM activations decreased with increasing multiband acceleration, highlighting a tradeoff between multiband acceleration and fQSM sensitivity. Using absolute versus signed QSM for fQSM may result in loss of information. These factors must be carefully considered for optimal future fQSM studies.
Introduction
Functional quantitative susceptibility mapping (fQSM) detects blood oxygenation changes related to neuronal activation, offering a complementary perspective to conventional fMRI [1], [2]. Some fQSM studies have used absolute QSM input, as recommended for group QSM analysis [4], but no systematic comparison has been performed for fQSM. Multiband acceleration is often essential to achieve TRs suitable for functional experiments but the effect of multiband acceleration factors on fQSM is unknown. Therefore, building on previous work highlighting ME-EPI for fQSM [5], we investigated the effect of absolute vs. signed QSM and of different multiband (MB) acceleration factors on task-based fQSM activations with a visual stimulus.Methods
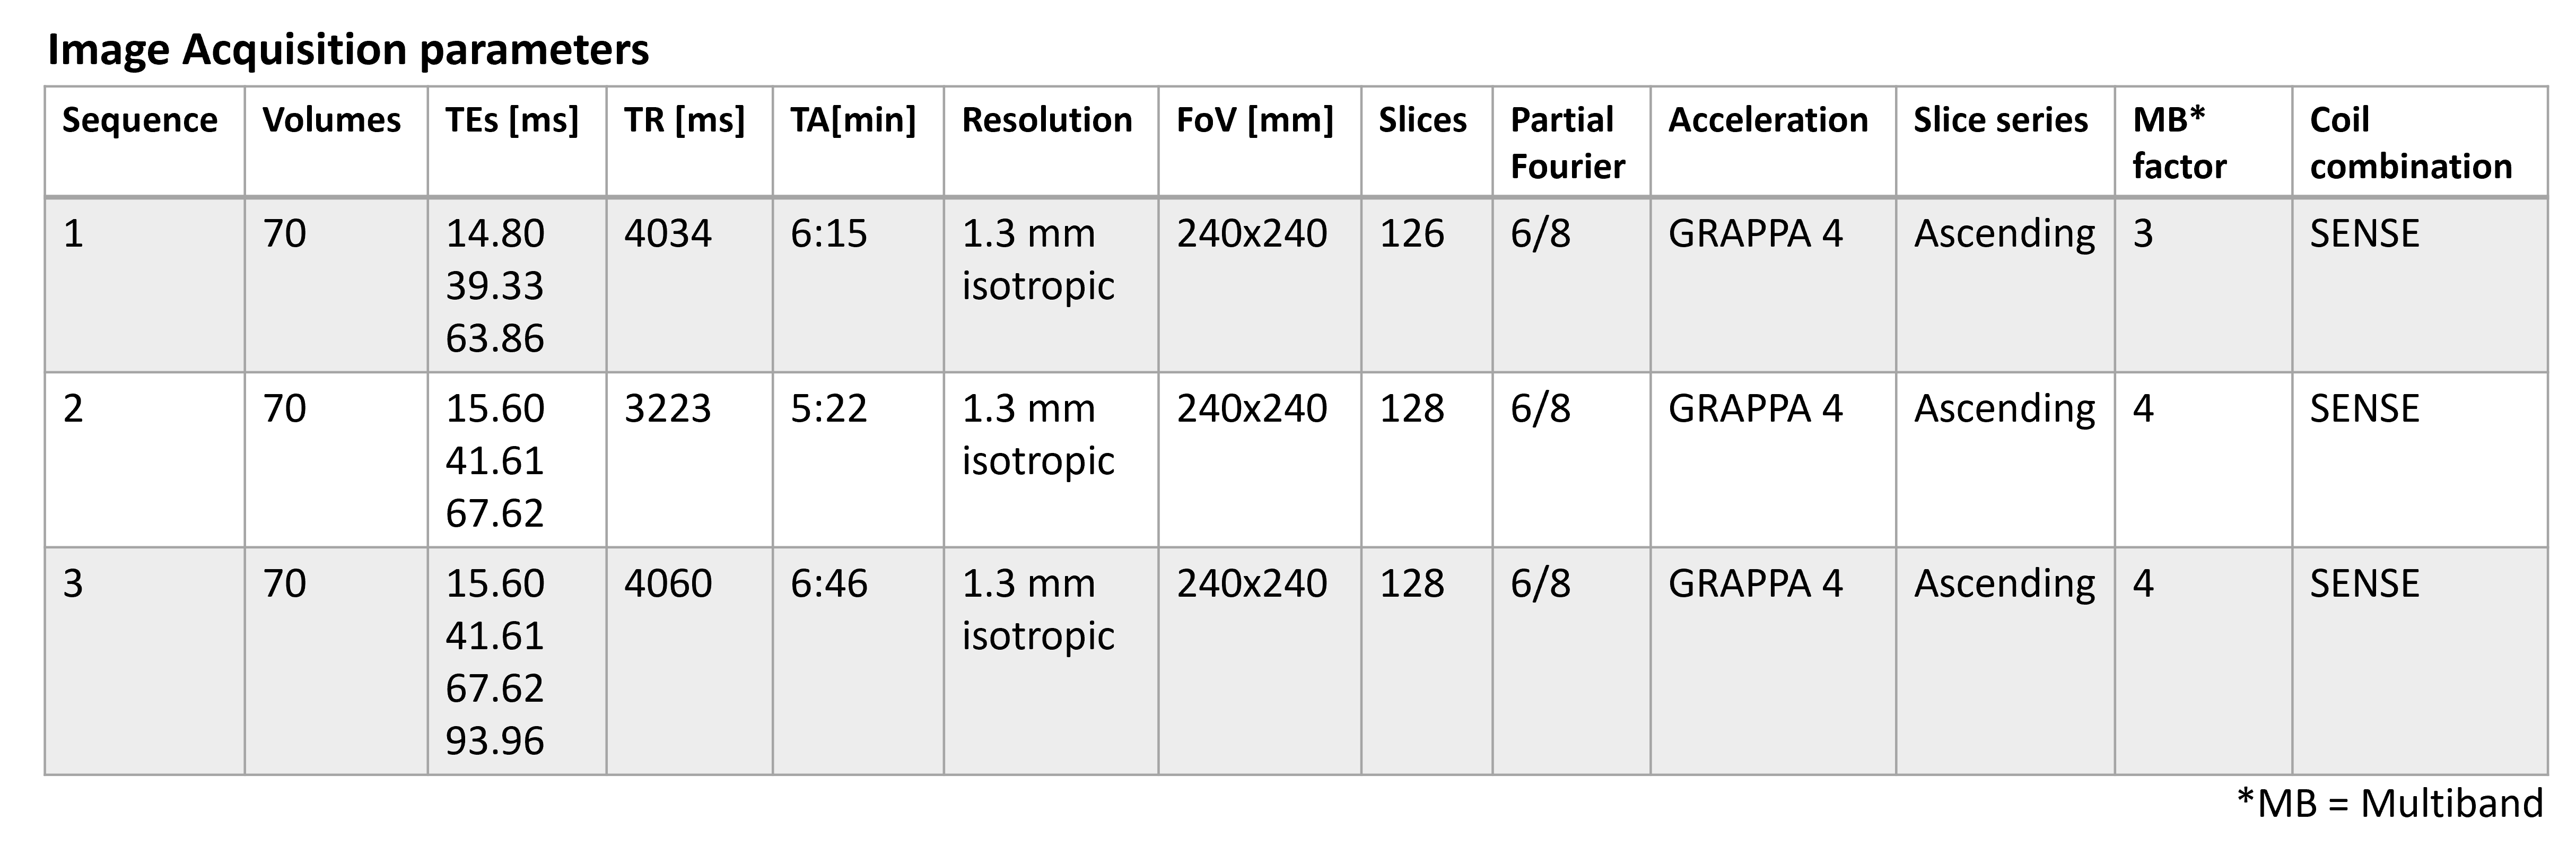
Image acquisition: We acquired 70 multi-echo 2D GRE EPI volumes in a healthy 25-year-old male volunteer using a 3T Siemens-Prisma system with a 64-channel head coil and MB 3 and 4, acquiring an additional echo to investigate whether that would reduce noise at MB4.. Acquisition parameters are shown in Table 1. To maximize the Blood Oxygenation Level Dependent (BOLD) signal, we employed a standard visual stimulation paradigm (Figure 1A).Data processing steps included the generation of brain masks using FSL BET [6] on the second echo magnitude images, followed by single-voxel erosion. For magnitude-based fMRI analysis, multi-echo magnitude images were combined using T2*-weighted echo summation [7]. Quantitative susceptibility maps (QSM) were calculated from the phase images for each volume by: non-linear fitting of the complex data [8]; Laplacian phase unwrapping [9]; intra- and inter-slice background field removal with 2D+3D V-SHARP[10] [11]; and dipole inversion using non-linear total variation regularisation (FANSI, a = 2x10⁻⁴)[12].
Functional Analysis: We used SPM12 [13], [14] for fMRI and fQSM analysis. Spatial pre-processing involved (1) rigid-body realignment of the magnitude images to the first image in the time-series to correct for motion. The resulting transformations were then applied to the corresponding susceptibility maps (and masks). (2) spatial smoothing with an 8-mm FWHM Gaussian kernel to enhance SNR and statistical power [15]. Unlike previous fQSM studies, e.g.[1], [2], no additional physiological noise correction was performed. A general-linear model (GLM) was reconstructed with a regressor for the visual stimuli. Significant activations were identified by thresholding t-score maps to create fMRI and fQSM activation maps using a threshold of p<0.05 with Family Wise Error (FWE) correction and no restriction on minimum cluster size.
Comparing Absolute v. Signed QSM: Three QSMs were input for fQSM: (1) Signed, native, QSMs in [ppm], (2) Absolute QSMs, computed by taking the absolute susceptibility values to minimize the impact of opposite sign cancellations between neighbouring voxels [3], [4] and (3) Shifted QSMs, computed by offsetting QSMs by their minimum value (-0.28 ppm) to eliminate negative values.
Results and discussion
fQSM provides similar but more localized and stronger activations than fMRI, as shown previously [5] Figure 2B.fQSM results from signed QSM and shifted QSM (red, blue, Figure 3) are very similar as expected because a shift is a linear operation. However, absolute QSMs yielded fewer clusters (green, Figure 3), which is in line with the loss of information resulting from taking absolute susceptibility values.Comparing the effect of multiband factors on fQSM activated cluster size (Figure 5) shows that, as the multiband factor increases from 3 to 4, the cluster size and activation t-scores decreases, likely due to the increase in g-factor noise at MB4 [16]. Figure 5 shows that adding another echo to the MB4 acquisition did not improve the fQSM activations, they remained less extensive than those for MB3 (Figure 4).
Conclusions
We explored the effect of using absolute compared to signed QSMs as inputs for fQSM analysis. The reduced extent of fQSM activations with absolute QSM inputs suggests a loss of information, therefore, we recommend using signed QSM in future studies. Our findings highlight the sensitivity of fQSM to multiband acceleration, with higher multiband factors leading to reduced cluster sizes and activation t-scores, likely due to increased g-factor noise. This emphasizes a tradeoff between multiband acceleration and fQSM sensitivity. fQSM remains a valuable complement to conventional fMRI, providing spatially localized activations. However, both multiband acceleration and the use of absolute QSM inputs must be carefully considered when optimizing future fQSM studies.Acknowledgements
This study was supported by the European Research Council Consolidator Grant DiSCo MRI SFN 770939References
[1] D. Z. Balla et al., “Functional quantitative susceptibility mapping (fQSM),” Neuroimage, vol. 100, pp. 112–124, Oct. 2014, doi: 10.1016/j.neuroimage.2014.06.011.
[2] P. S. Özbay et al., “Probing neuronal activation by functional quantitative susceptibility mapping under a visual paradigm: A group level comparison with BOLD fMRI and PET,” Neuroimage, vol. 137, pp. 52–60, Aug. 2016, doi: 10.1016/j.neuroimage.2016.05.013.
[3] G. E. C. Thomas, L. A. Leyland, A.-E. Schrag, A. J. Lees, J. Acosta-Cabronero, and R. S. Weil, “Brain iron deposition is linked with cognitive severity in Parkinson’s disease,” J Neurol Neurosurg Psychiatry, vol. 91, no. 4, pp. 418–425, Apr. 2020, doi: 10.1136/jnnp-2019-322042.
[4] M. J. Betts, J. Acosta-Cabronero, A. Cardenas-Blanco, P. J. Nestor, and E. Düzel, “High-resolution characterisation of the aging brain using simultaneous quantitative susceptibility mapping (QSM) and R2* measurements at 7T,” Neuroimage, vol. 138, pp. 43–63, Sep. 2016, doi: 10.1016/j.neuroimage.2016.05.024.
[5] J. Nassar, oliver Kiersnowski, P. Fuchs, and K. Shmueli, “Preliminary Functional Quantitative Susceptibility Mapping with Multi-Echo EPI,” In: In Proceedings of ISMRM & SMRT Annual Meeting, 2023.
[6] S. M. Smith, “Fast robust automated brain extraction,” Hum Brain Mapp, vol. 17, no. 3, pp. 143–155, Nov. 2002, doi: 10.1002/hbm.10062.
[7] B. A. Poser, M. J. Versluis, J. M. Hoogduin, and D. G. Norris, “BOLD contrast sensitivity enhancement and artifact reduction with multiecho EPI: Parallel-acquired inhomogeneity-desensitized fMRI,” Magnetic Resonance in Medicine, vol. 55, no. 6, pp. 1227–1235, 2006, doi: 10.1002/mrm.20900.
[8] T. Liu, C. Wisnieff, M. Lou, W. Chen, P. Spincemaille, and Y. Wang, “Nonlinear formulation of the magnetic field to source relationship for robust quantitative susceptibility mapping,” Magnetic resonance in medicine, 2013, doi: 10.1002/mrm.24272.
[9] M. A. Schofield and Y. Zhu, “Fast phase unwrapping algorithm for interferometric applications,” Opt Lett, vol. 28, no. 14, pp. 1194–1196, Jul. 2003, doi: 10.1364/ol.28.001194.
[10] W. Li, B. Wu, and C. Liu, “Quantitative susceptibility mapping of human brain reflects spatial variation in tissue composition,” NeuroImage, vol. 55, no. 4, pp. 1645–1656, Apr. 2011, doi: 10.1016/j.neuroimage.2010.11.088.
[11] H. Wei, Y. Zhang, E. Gibbs, N. K. Chen, N. Wang, and C. Liu, “Joint 2D and 3D phase processing for quantitative susceptibility mapping: application to 2D echo-planar imaging,” NMR in Biomedicine, vol. 30, no. 4, Apr. 2017, doi: 10.1002/nbm.3501.
[12] “Fast nonlinear susceptibility inversion with variational regularization - Milovic - 2018 - Magnetic Resonance in Medicine - Wiley Online Library.” Accessed: Nov. 07, 2022. [Online]. Available: https://onlinelibrary.wiley.com/doi/10.1002/mrm.27073
[13] K. J. Friston, A. P. Holmes, K. J. Worsley, J.-P. Poline, C. D. Frith, and R. S. J. Frackowiak, “Statistical parametric maps in functional imaging: A general linear approach,” Human Brain Mapping, vol. 2, no. 4, pp. 189–210, 1994, doi: 10.1002/hbm.460020402.
[14] J. Ashburner, “SPM: A history,” NeuroImage, vol. 62, no. 2, pp. 791–800, Aug. 2012, doi: 10.1016/j.neuroimage.2011.10.025.
[15] M. K. Chung, “Gaussian kernel smoothing.” arXiv, Nov. 29, 2021. doi: 10.48550/arXiv.2007.09539.
[16] N. Todd, O. Josephs, P. Zeidman, G. Flandin, S. Moeller, and N. Weiskopf, “Functional Sensitivity of 2D Simultaneous Multi-Slice Echo-Planar Imaging: Effects of Acceleration on g-factor and Physiological Noise,” Frontiers in Neuroscience, vol. 11, 2017, Accessed: Nov. 08, 2023. [Online]. Available: https://www.frontiersin.org/articles/10.3389/fnins.2017.00158
Figures
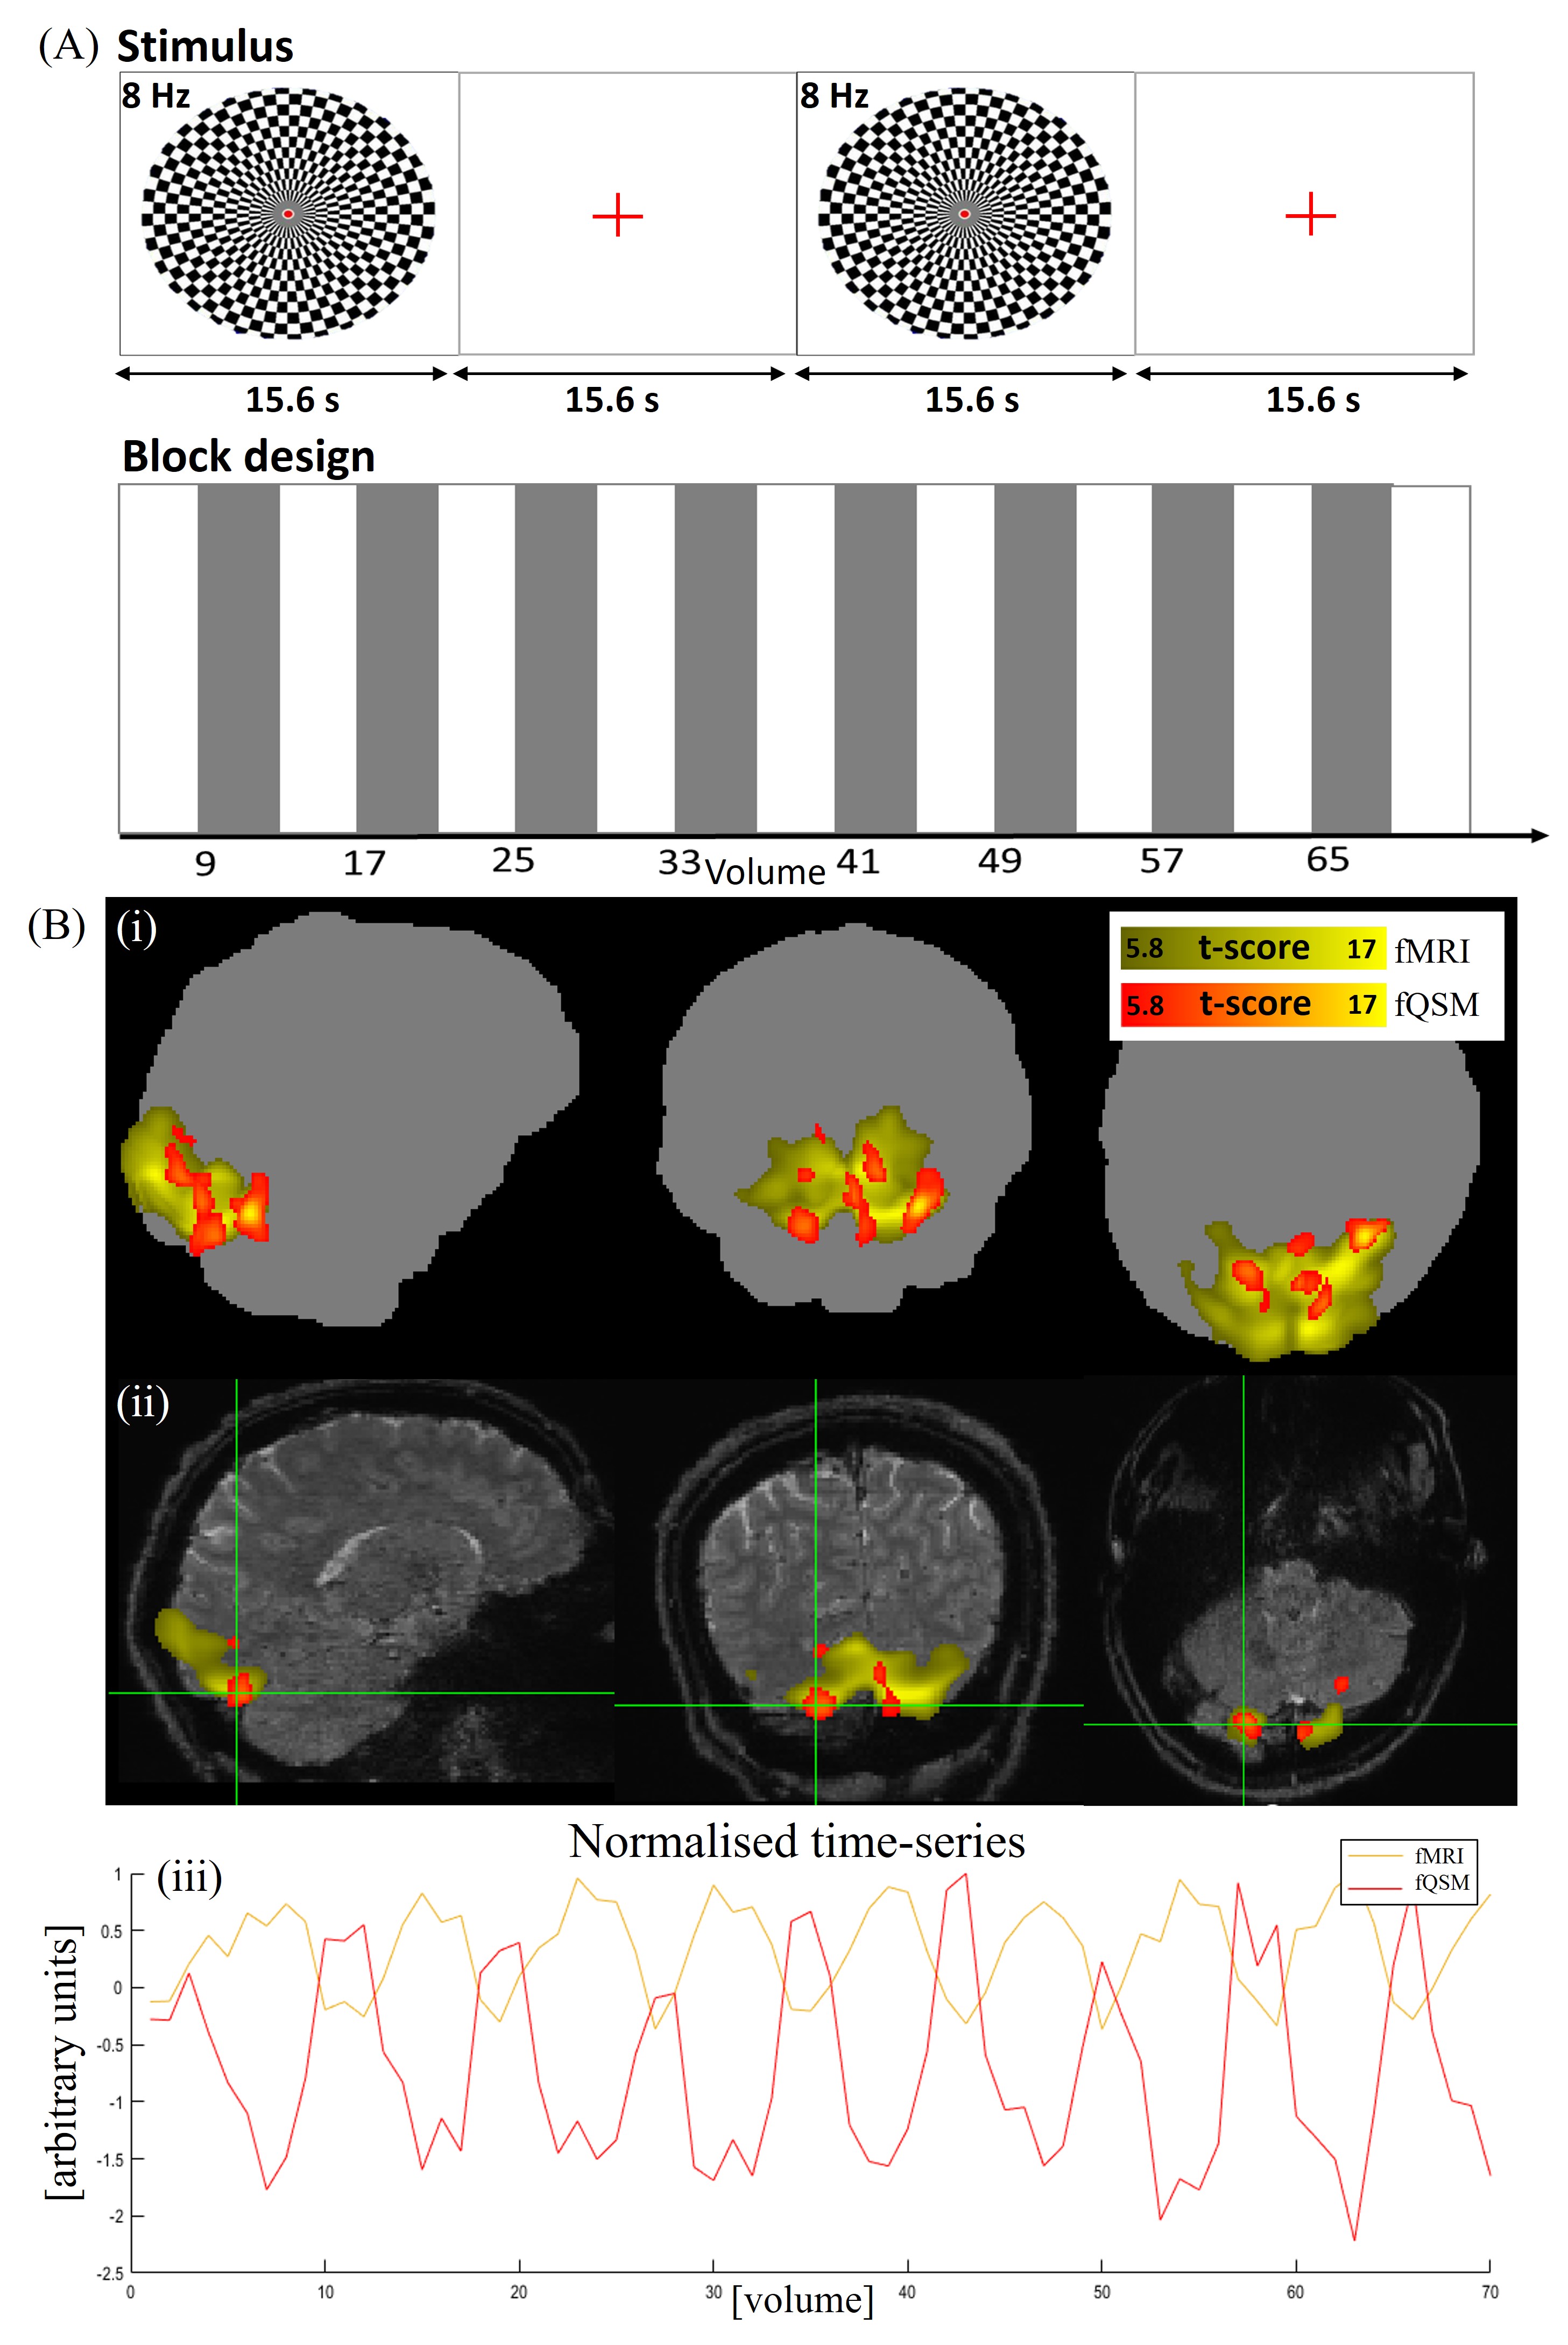
Figure 1 (A): fMRI Stimulus: A checkerboard flickering at 8 Hz was displayed for 15.6 s alternating with a 15.6 s rest block of a fixation dot. (B): Conventional fMRI and signed fQSM Results on sequence 1, MB3: (i) shows the Maximum Intensity Projection (MIP) of all activations. (ii) shows the t-Scores overlaid on slices of the echo-combined magnitude image. (iii) shows the normalised time-series in the voxel under the cross-hair in (ii).
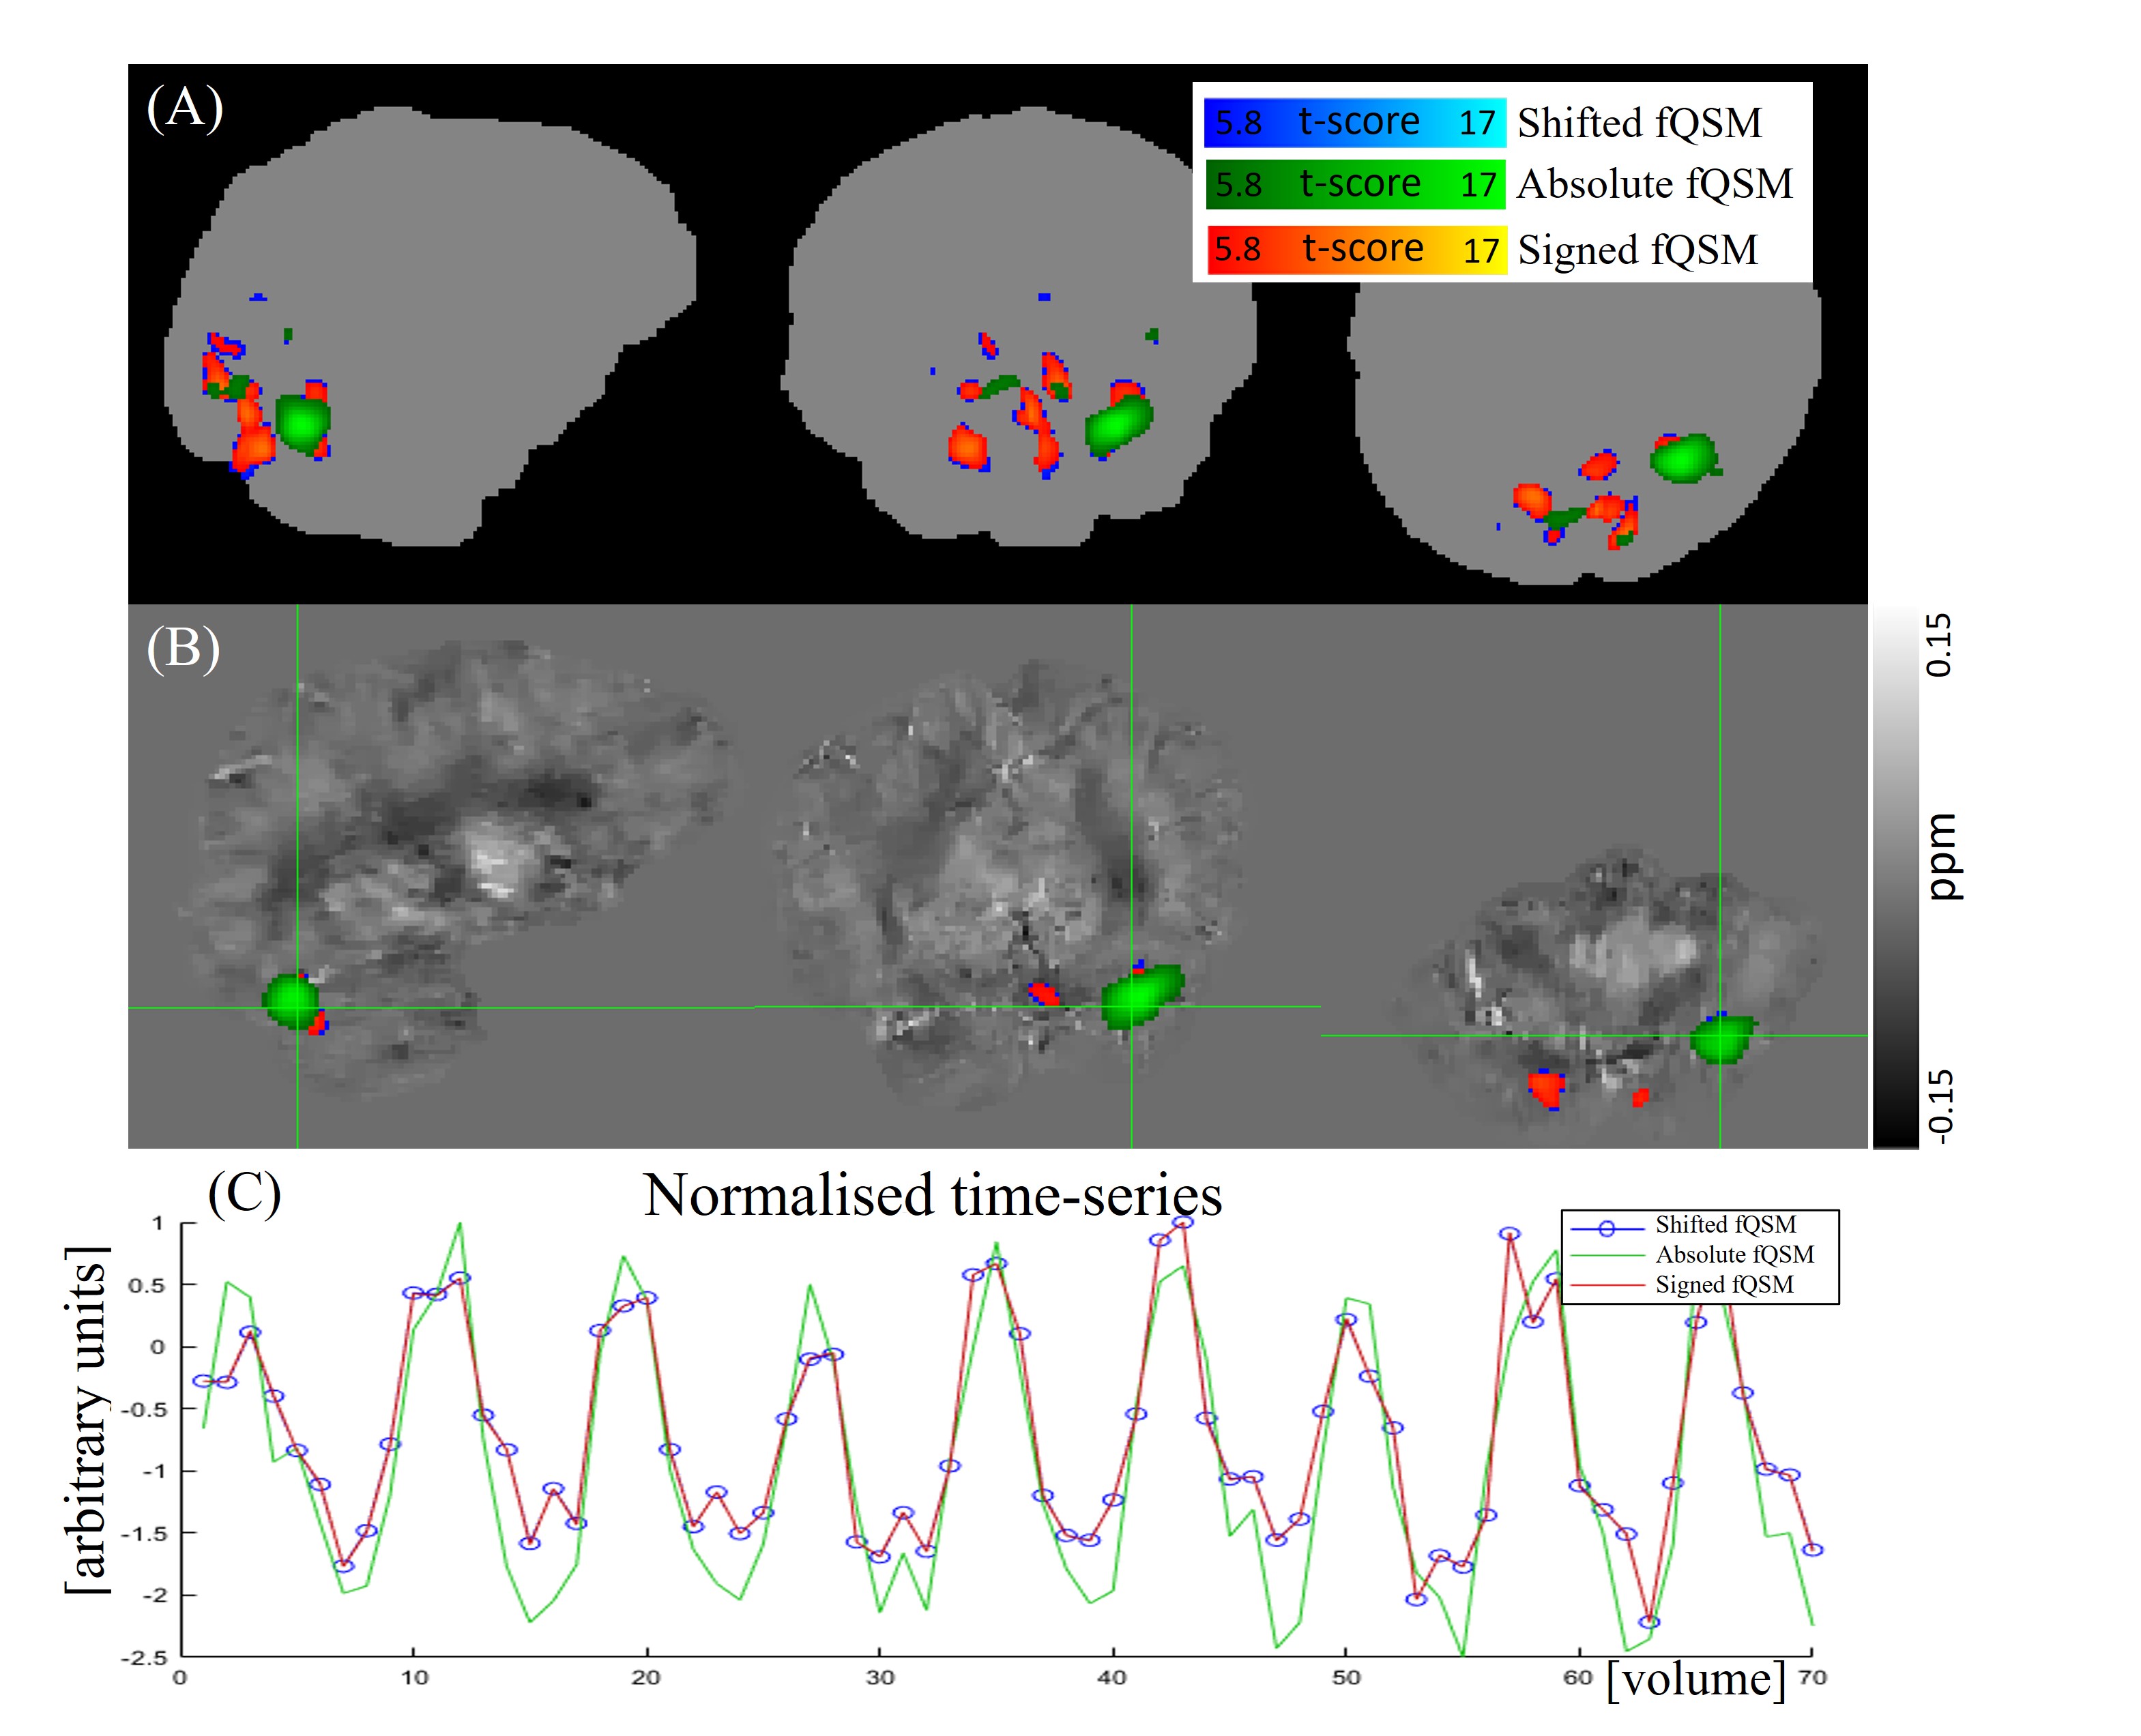
Figure 2. The effect of using signed, absolute and shifted input QSMs on fQSM from sequence 1, MB3: (A) shows the Maximum Intensity Projection (MIP) of all the activation clusters from all 3 methods. (B) shows the t-Scores overlaid on a sagittal, coronal and axial slice of the QSM map averaged over all timepoints. (C) shows the normalized time-series of the voxel under the crosshair in (B).
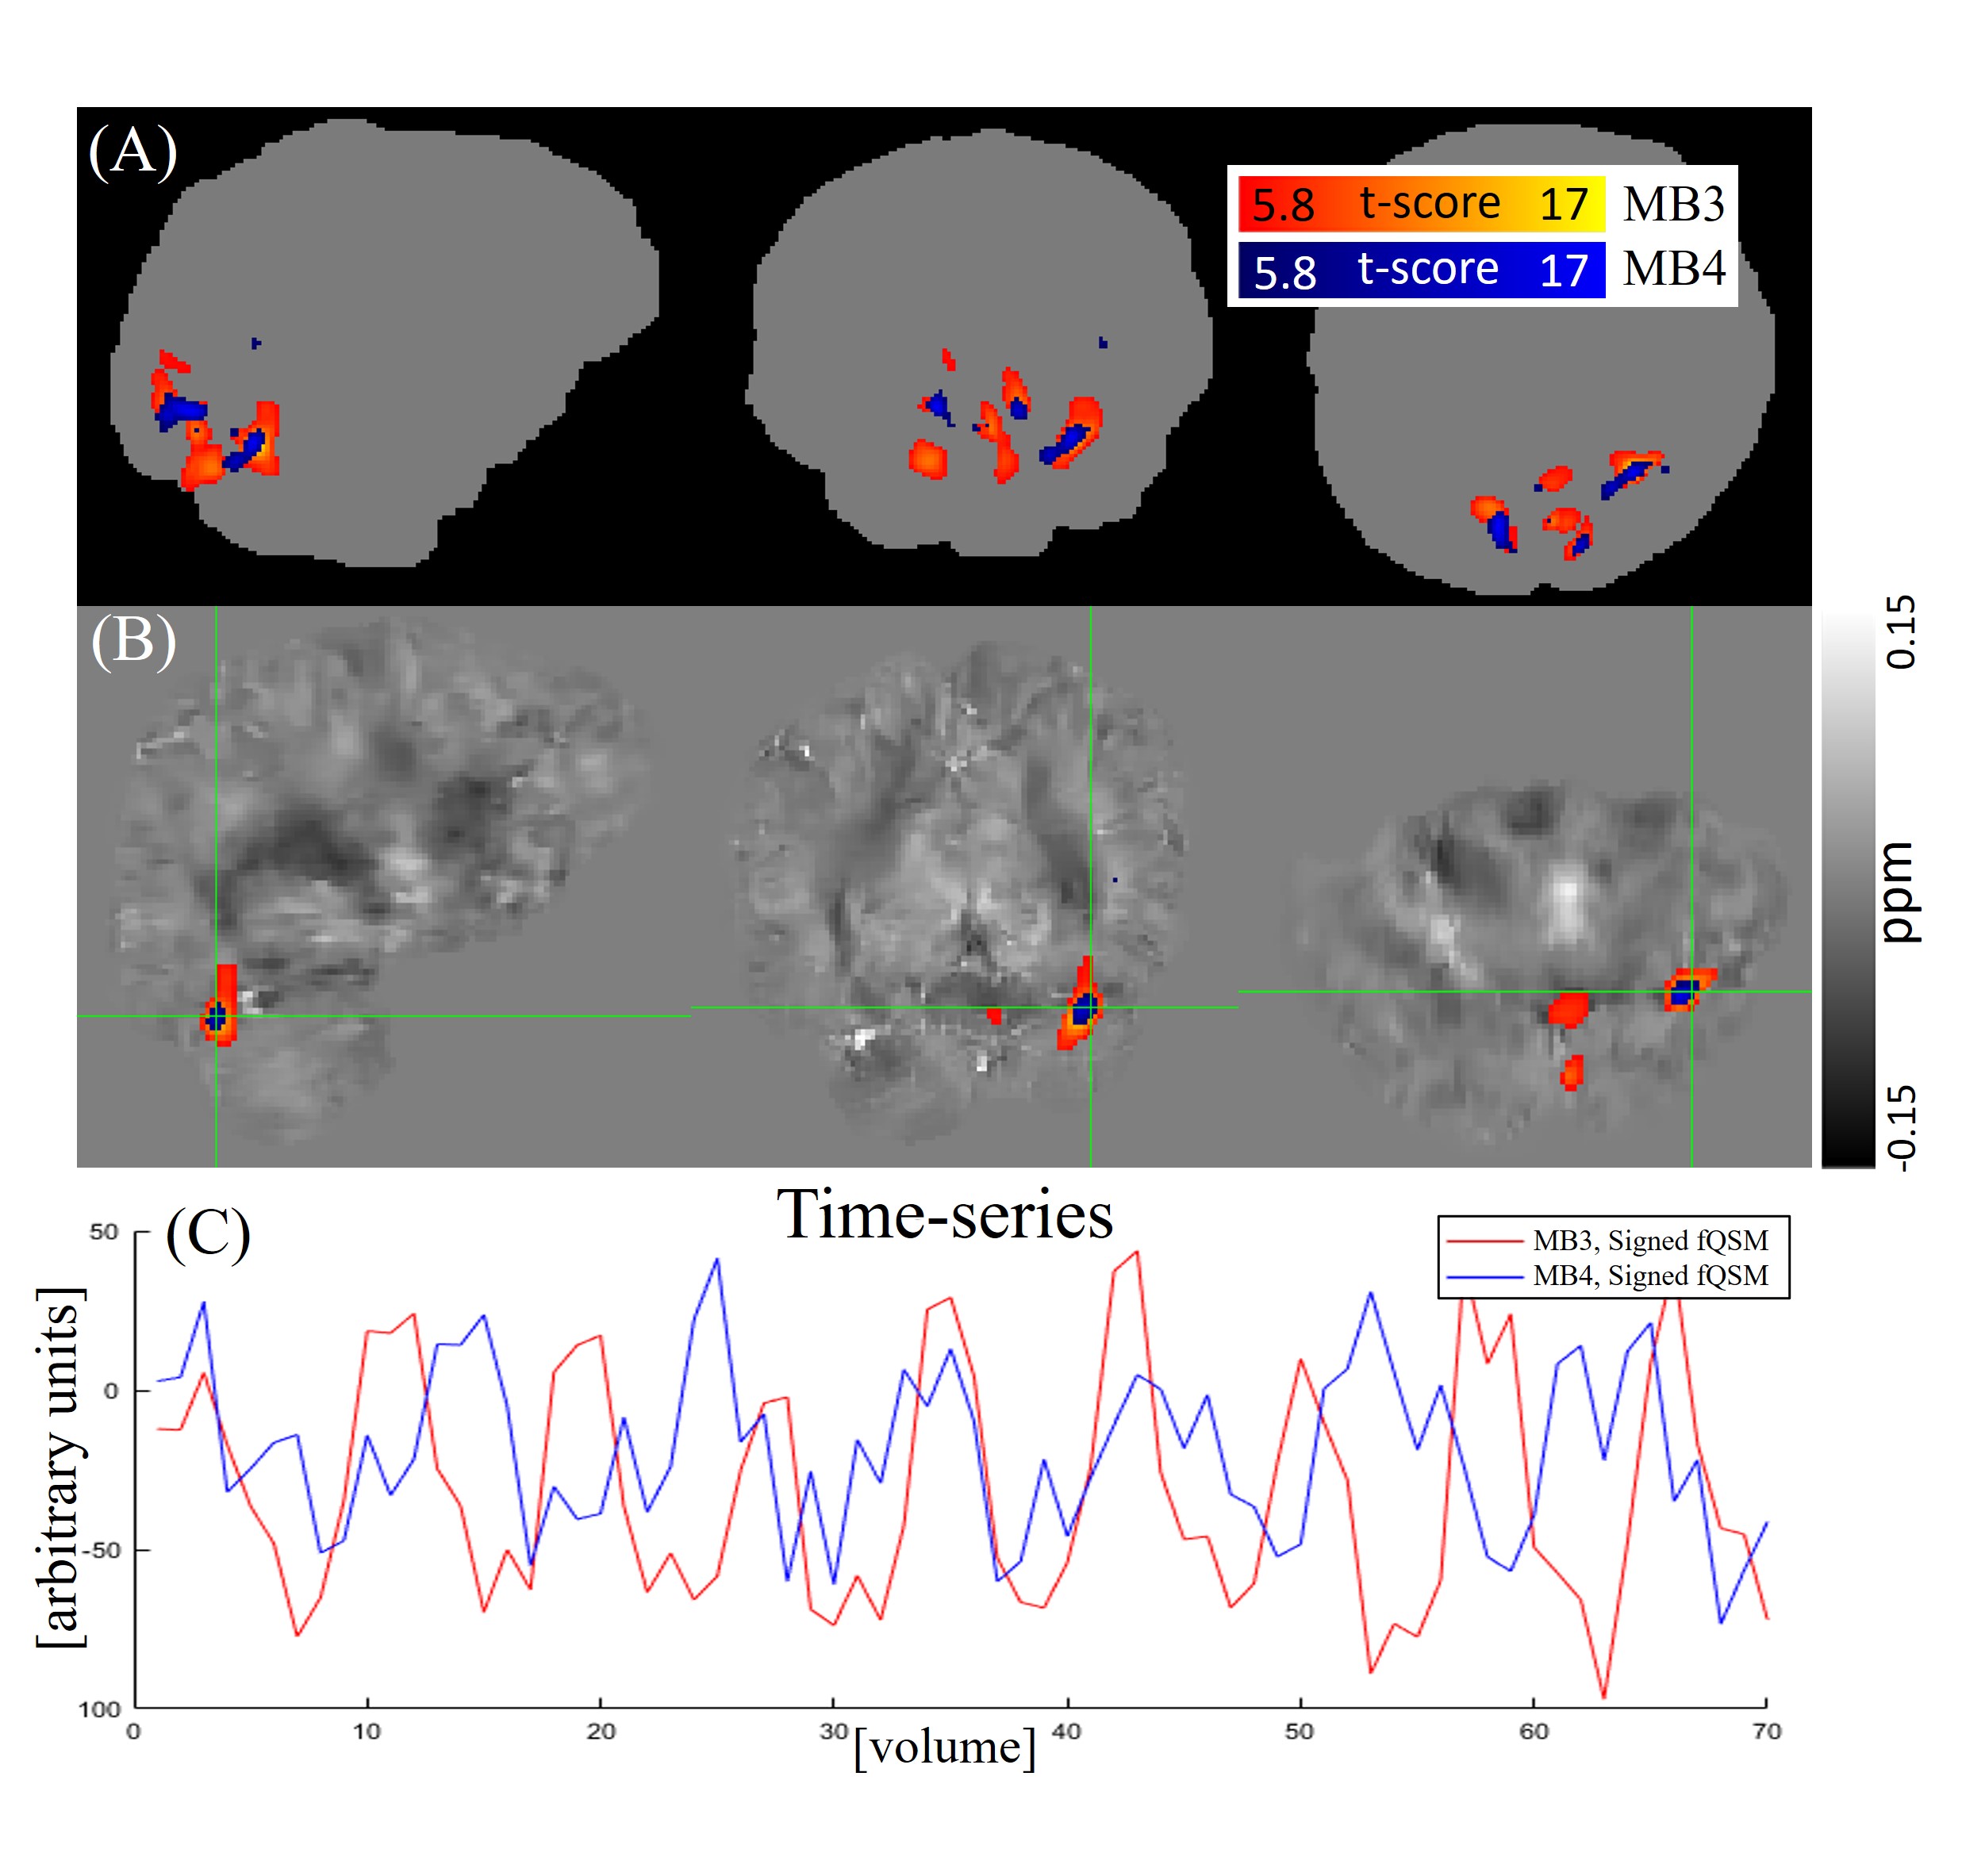
Figure 3. The effect of multiband acceleration factor on fQSM using sequence 1 (MB3, 3 TEs) and sequence 2 (MB4, 3 TEs): (A) shows the Maximum Intensity Projection (MIP) of all the activation clusters from both MB factors. (B) shows the t-Scores overlaid on a sagittal, coronal and axial slice of the QSM map averaged over all timepoints. (C) shows the timeseries of the voxel under the crosshair in (B).
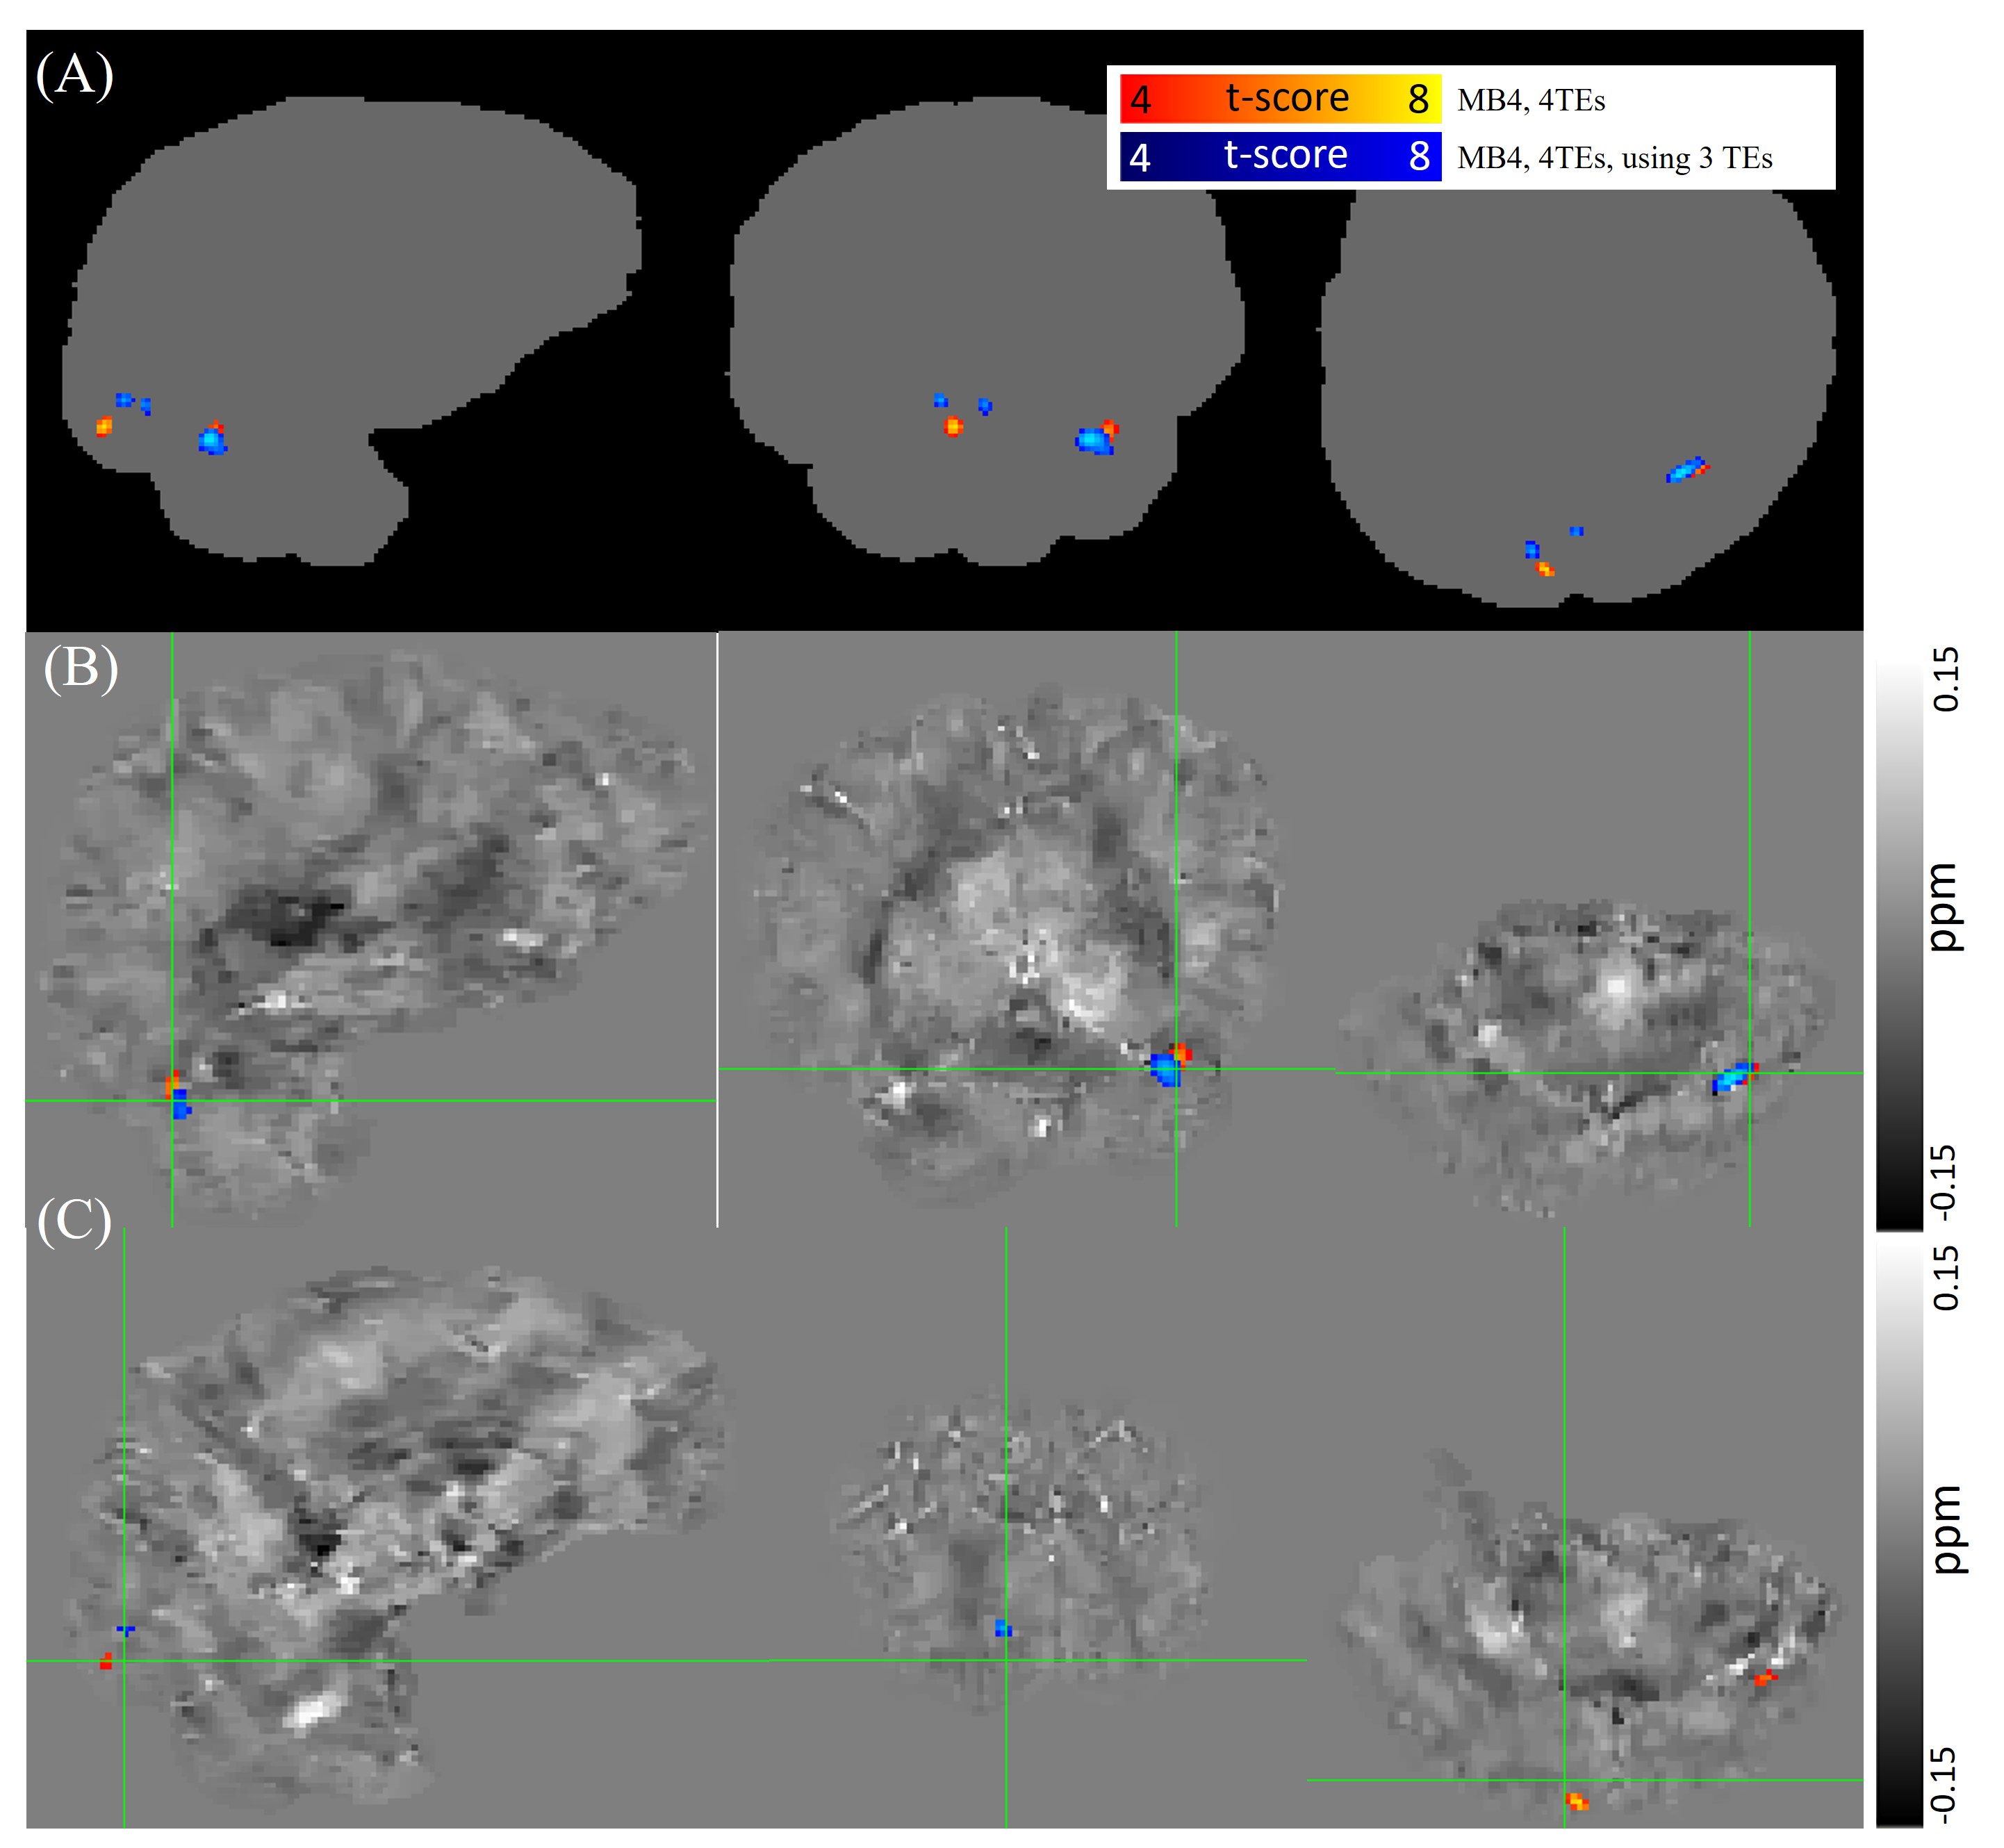
Figure 4. fQSM Results from sequence 3, with MB factor 4 with all its 4 TEs, are compared to using only the initial 3 TEs. The addition of another TE does not enhance cluster size or t-scores due to g-factor noise introduced by the MB factor, which is not reduced by the extra echo time. Panel A shows the Maximum Intensity Projection (MIP) of all the clusters. Panels B and C shows the t-Scores overlaid on two QSM slices.