3411
Time-resolved functional PET-MRI fusion: temporally coupled metabolic and BOLD dynamics across task and naturalistic arousal1Athinoula A. Martinos Center for Biomedical Imaging, Massachusetts General Hospital, Boston, MA, United States, 2College of Science, Northeastern University, Boston, MA, United States, 3Radiology, Harvard Medical School, Boston, MA, United States
Synopsis
Keywords: fMRI Analysis, Multimodal, Brain; Data Analysis; fMRI; Neuroscience; PET/MR
Motivation: Latest advances in functional PET (fPET)-FDG and PET-MRI have enabled us to map stimulus-driven metabolic and hemodynamic changes simultaneously within a single scan. However, existing PET-MRI studies have focused on the static, time-averaged (de)couplings of fPET-fMRI signals, neglecting the rich information embedded in their temporal dependence.
Goal(s): The goal of this study is to propose and validate an analytical framework linking dynamic, concurrent variations in fPET and fMRI signals.
Approach: The efficacy of the framework was tested on visual task and naturalistic arousal fPET-fMRI datasets.
Results: Our results demonstrated that metabolic changes modeled by concurrent fMRI signals could successfully predict instantaneous fPET-FDG dynamics.
Impact: The statistical framework proposed by our study will enable broad functional PET-MRI studies to elucidate the dynamic interplays amongst metabolic and hemodynamic processes that are otherwise obscured in the conventional, time-averaged analysis.
Introduction
In the realm of functional imaging, the integration of PET-MR systems and the introduction of continuous infusion FDG-PET (fPET-FDG) has recently permitted the concurrent examination of the dynamics of glucose metabolism and blood-oxygenation-level-dependent (BOLD) signals within the human brain[1-3]. Despite the most revolutionary aspect of fPET being its high temporal resolution comparative to previous PET methods[4], most fPET-fMRI studies to date have centered on static spatial correlations rather than the dynamic interplay between these signals over time[5-7]. Capitalizing on fPET-FDG’s ability to capture dynamic changes in glucose uptakes, our study introduces an analytical framework that connects the temporal evolution of fPET-FDG signals with real-time BOLD-fMRI data. This methodology was tested against two datasets—one incorporating visual stimulation and another utilizing a naturalistic arousal paradigm—to determine its effectiveness in linking fPET-FDG dynamics with concurrent BOLD-fMRI time-courses.Model construction & validation I — visual task dataset
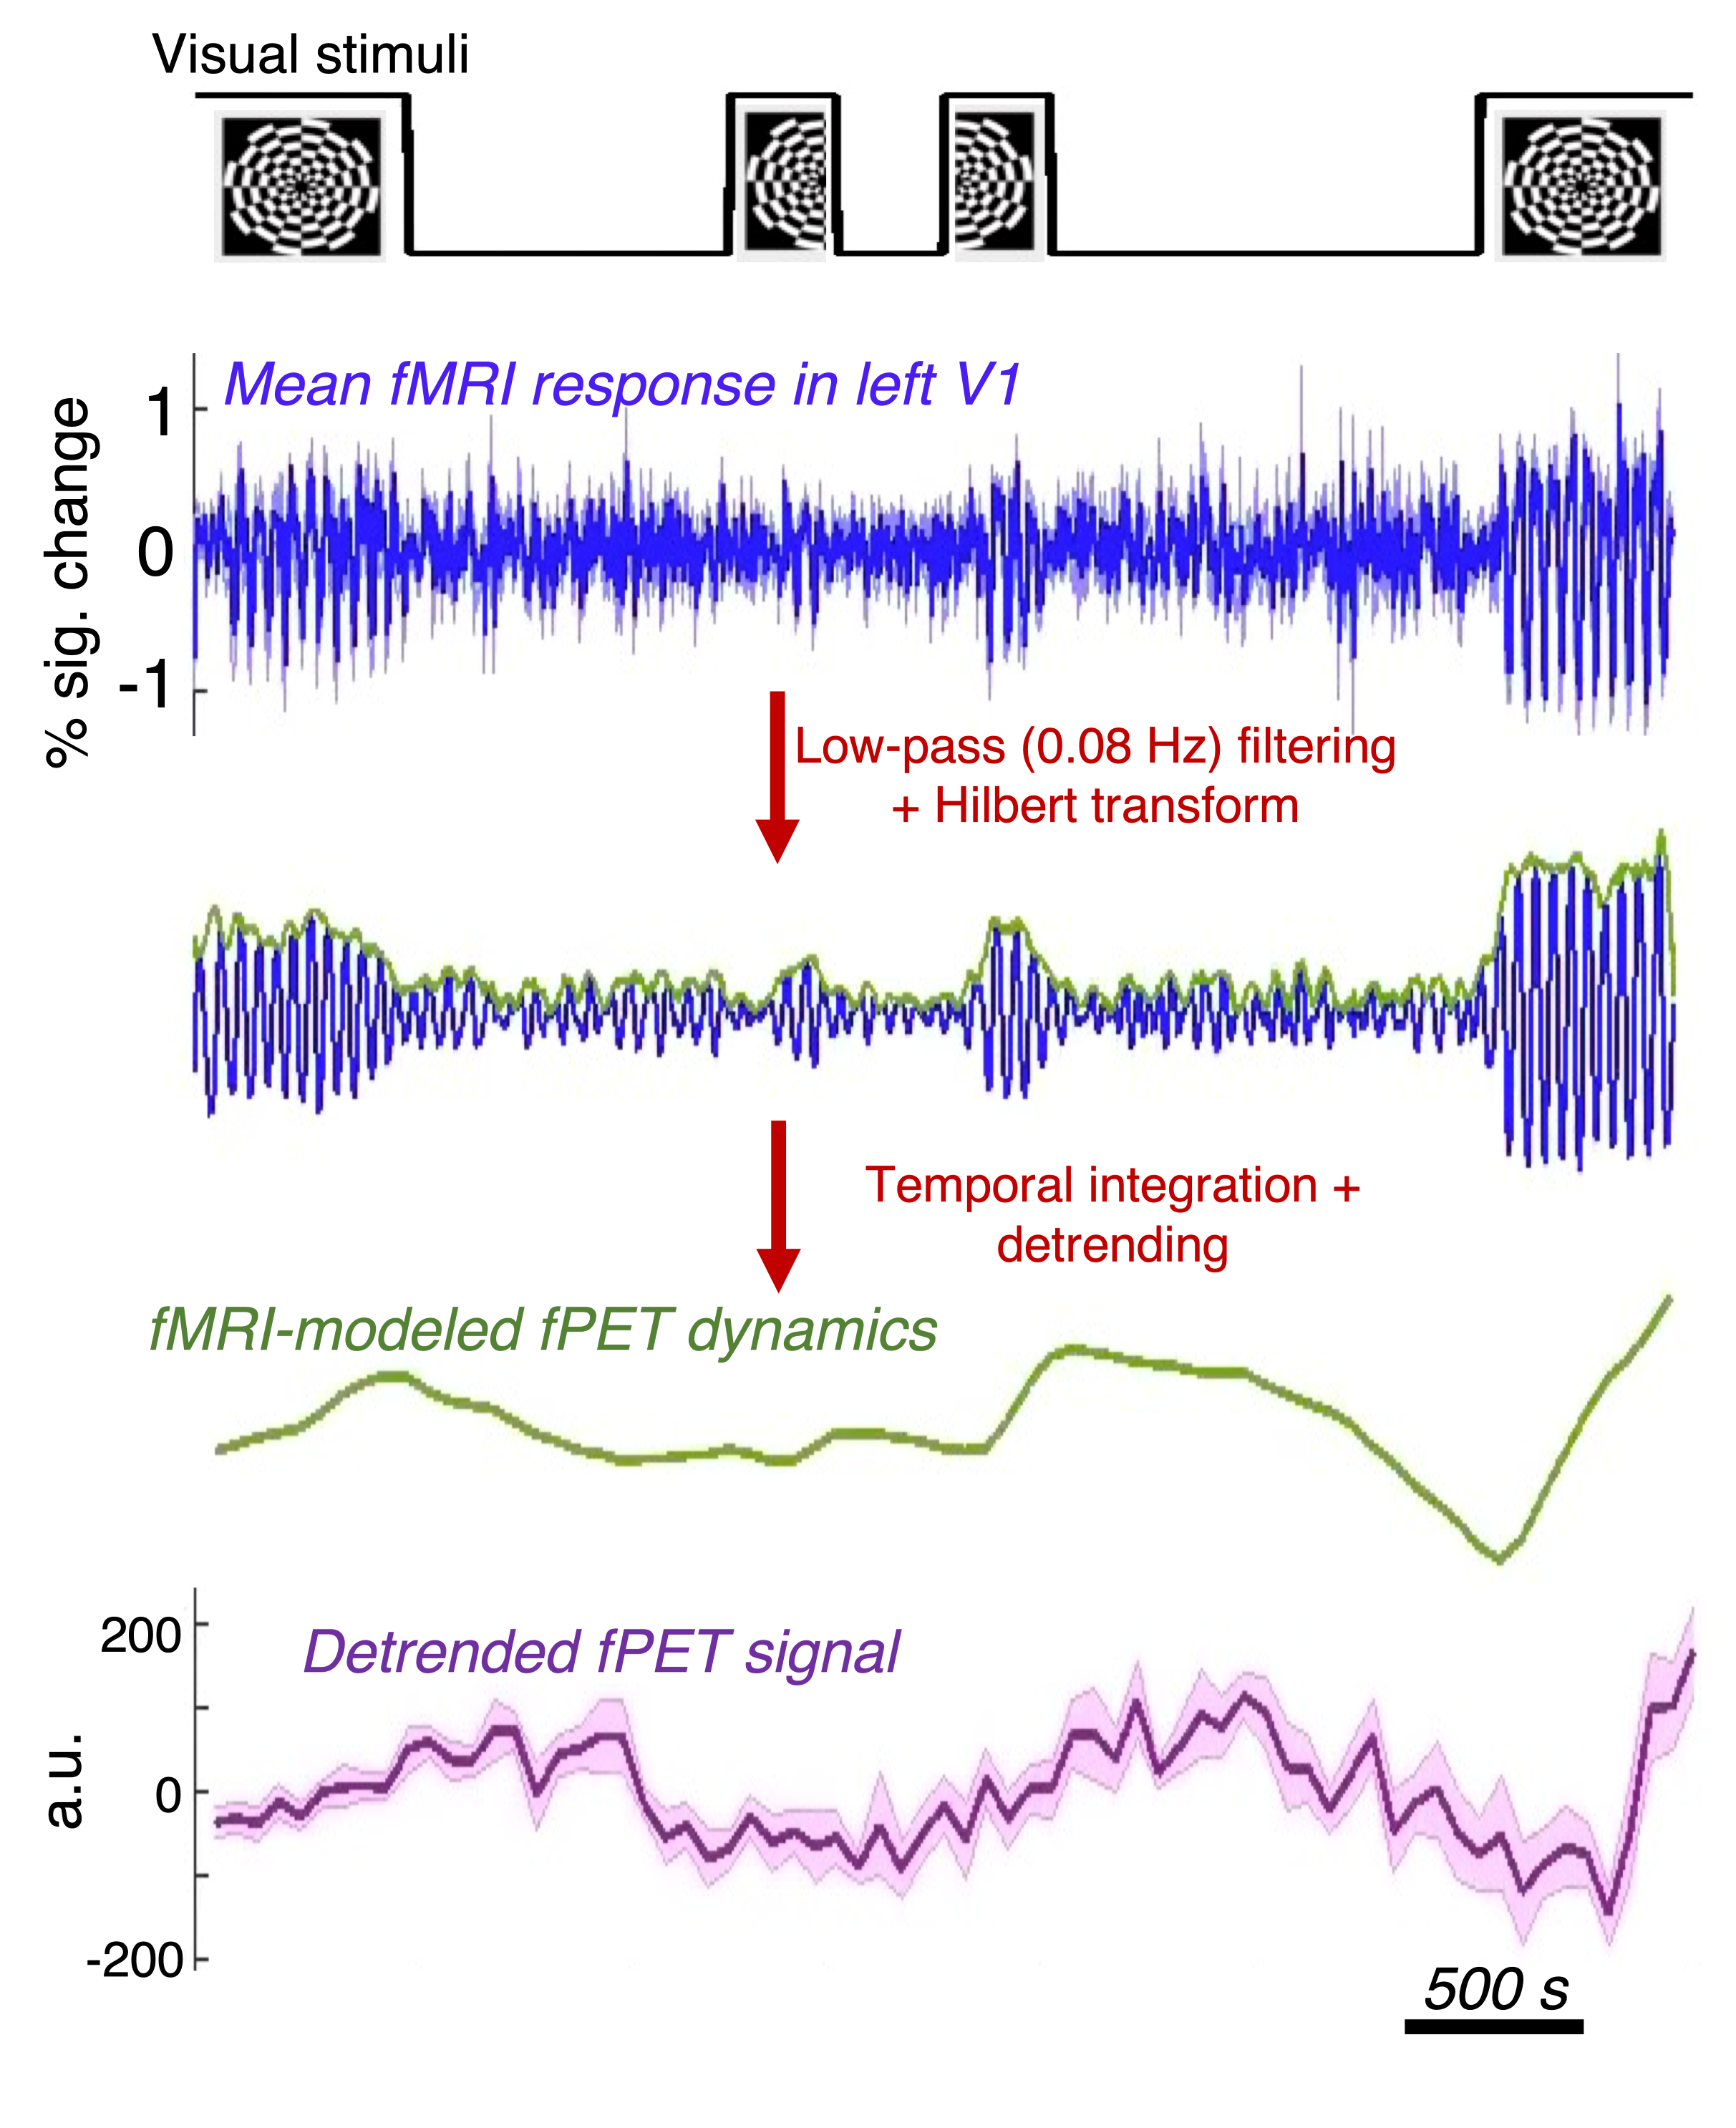
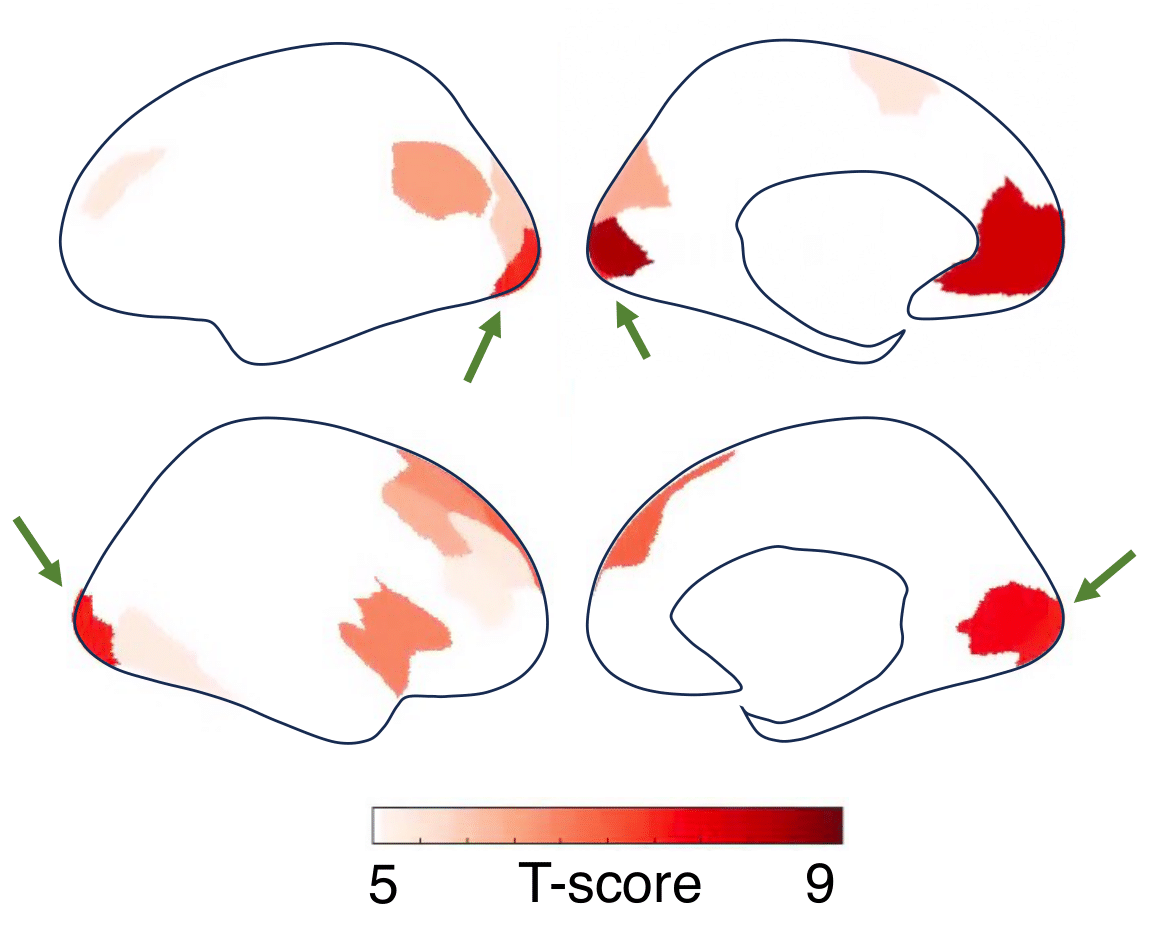
We first assessed the temporal coupling between BOLD-fMRI and FDG-PET measures in a well-controlled task paradigm, by analyzing a publicly available fPET-fMRI dataset employing visual stimulation[8]. The Monash vis-fPET-fMRI dataset comprises 70-minute simultaneous FDG-fPET and BOLD-fMRI scans of 10 healthy young adults (fMRI: voxel size = 3×3×3 mm3, TR = 2.45 s; fPET: reconstructed nominal voxel size = 1.39×1.39×2 mm3, temporal resolution = 1 min). Using an embedded block design, participants were exposed to a visual stimulus consisting of a flickering checkerboard (Fig. 1).We hypothesize that the power of the fMRI signal at the stimulus frequency is indicative of neural activity, so integrating this signal over time will correspond to the concurrent FDG accumulation due to metabolic demand. To test this, we computed the average fMRI signal from the primary visual cortex (V1) across subjects, applied a Hilbert transform to determine the BOLD signal power over time, and integrated this power to use as a predictor variable for the FDG-PET data (Fig. 1). We removed long-term trends from both the predictor (regressor) and the PET data using a third-order polynomial, focusing on the dynamic changes. Subsequent regression analysis showed that our integrated BOLD signal predictor aligns well with the FDG accumulation in the detrended V1 area (Fig. 1, fMRI-modeled fPET dynamics vs. detrended fPET signal). Moreover, the significant correlation between the BOLD signal and FDG accumulation is specifically strong in the visual cortex, as shown in the spatial distribution of the test statistics (Fig. 2, highlighted by green arrows). We also noticed metabolic activations in the frontal cortex, possibly owing to task-locked attention changes.
Model construction & validation II — naturalistic arousal dataset
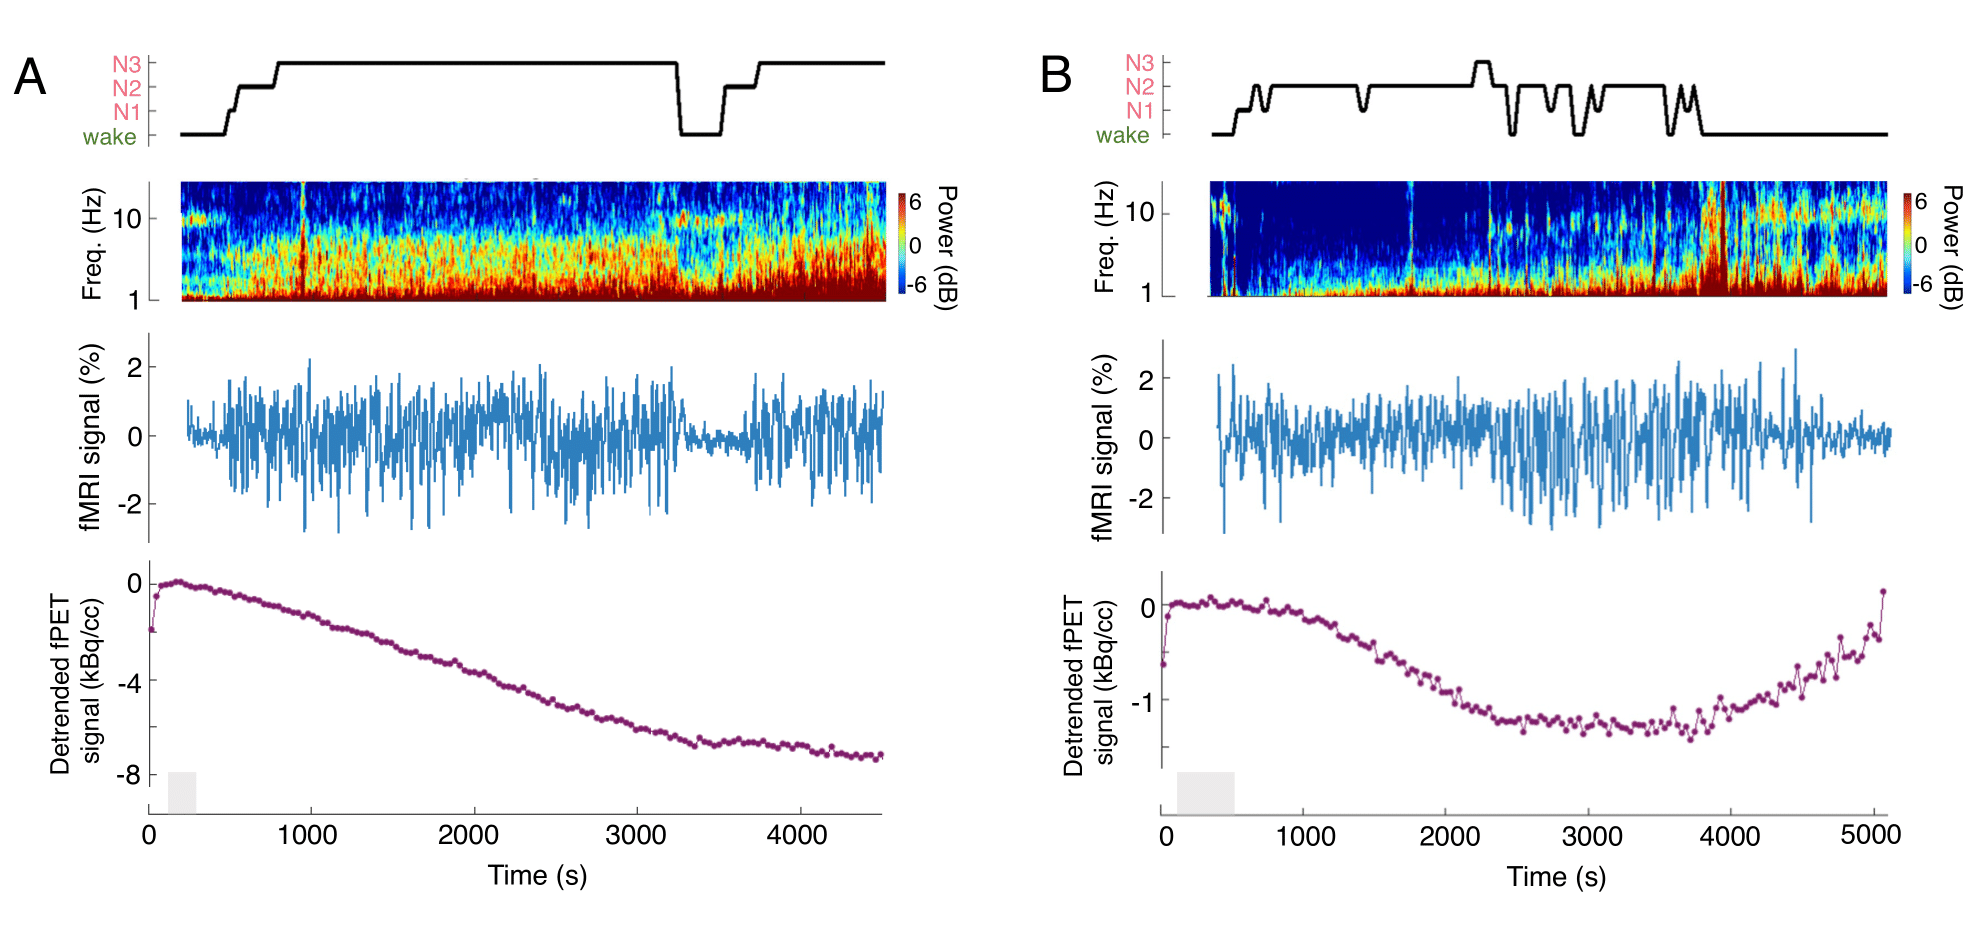
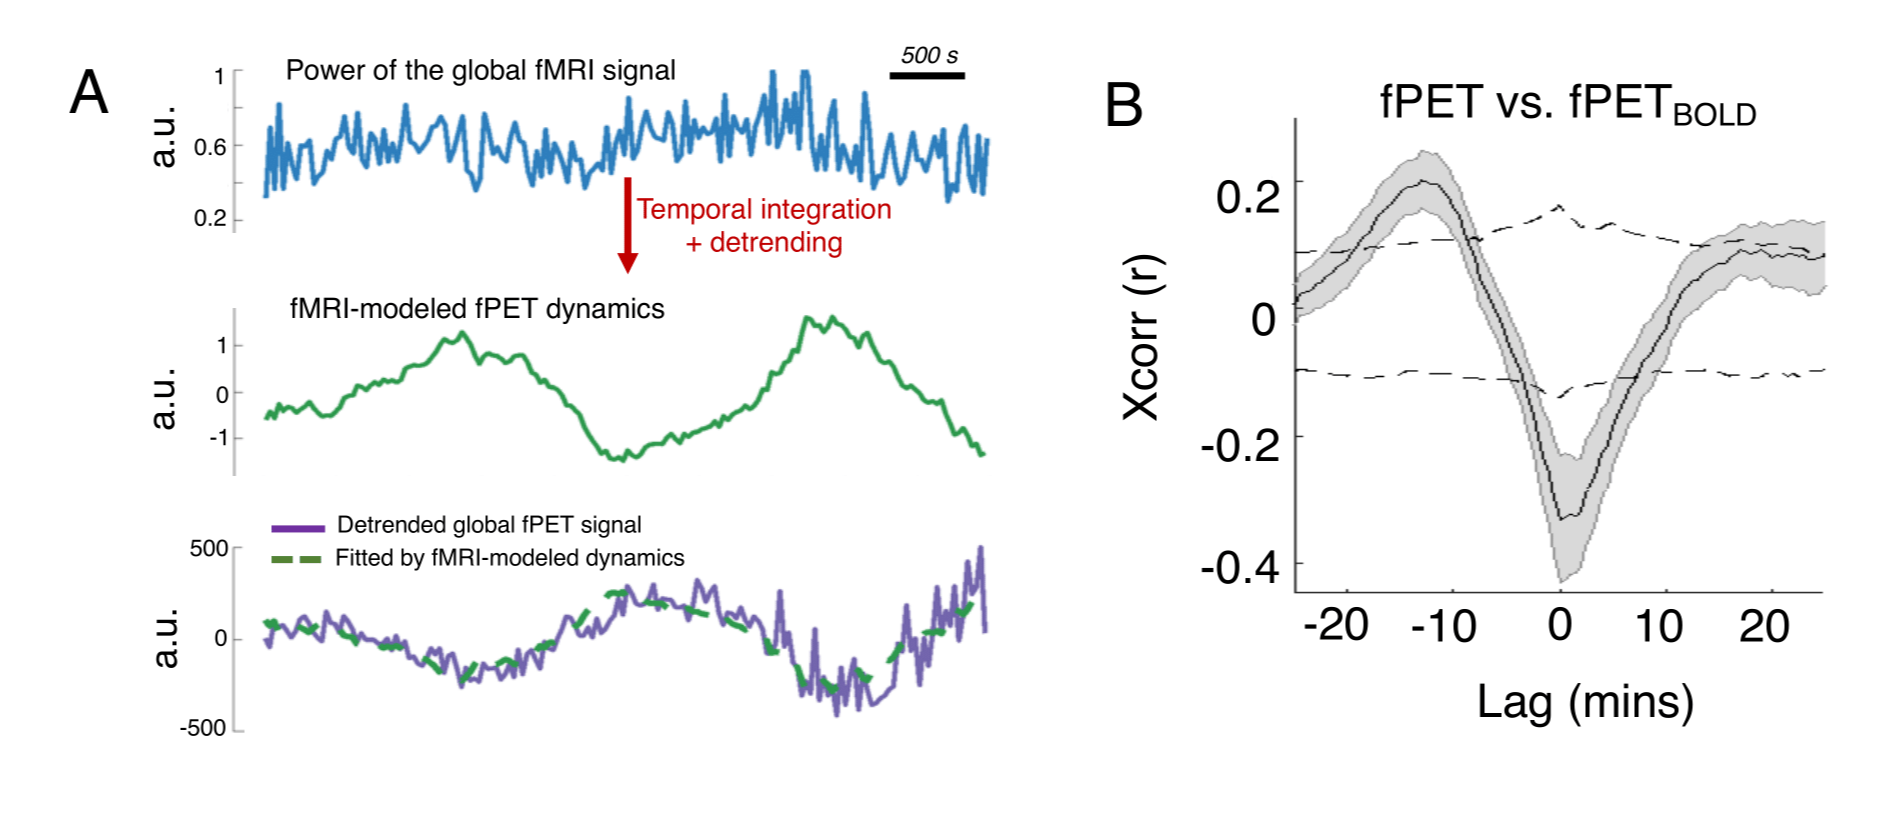
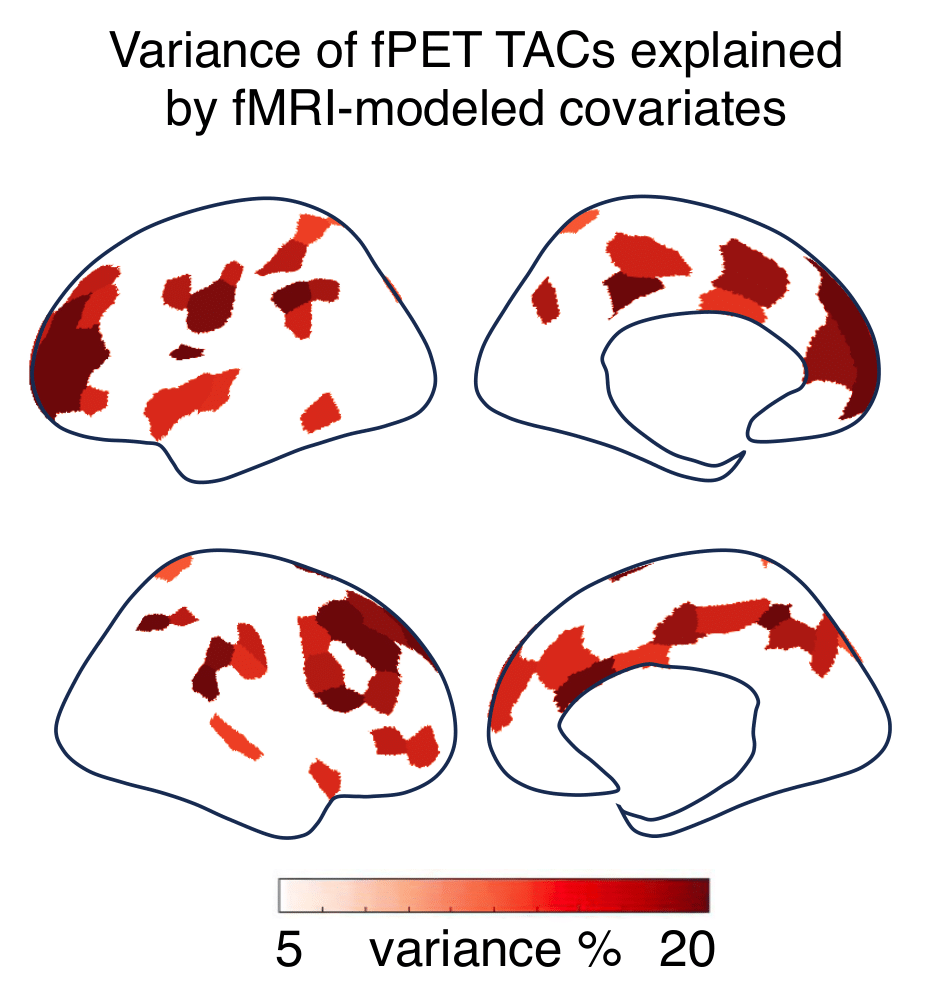
To further evaluate our model of BOLD-FDG temporal coupling for a naturalistic paradigm, we next acquired and analyzed fPET-fMRI data from 23 healthy adults who were instructed to close their eyes and relax throughout a 75-120 min scan. The subject’s arousal states were inferred from simultaneous EEG recordings (18 subjects) or behavioral measures (5 subjects). All scans were performed on a 3T Siemens MR scanner with a BrainPET insert (fMRI: voxel size = 3×3×3 mm3, TR = 2/2.4 s; fPET: reconstructed nominal voxel size = 2.5×2.5×2.5 mm3, temporal resolution = 30 s). FDG was administered with a bolus plus continuous infusion paradigm, with the bolus comprising 20% of the total continuously infused dose.As shown in Fig. 3, our tri-modal framework could successfully track sleep-wake dynamics in both glucose uptakes and hemodynamic changes. Following a similar framework as the visual dataset, we identified a strong coupling between the global BOLD-fMRI and FDG time-course (Fig. 4). The metabolic regressor modeled by the global fMRI signal explained considerable variance of fPET time-activity curves in extensive cortical regions (Fig. 5). These observations supported the applicability of the PET-MRI integration framework in naturalistic paradigms.
Conclusion
In this study, we proposed and validated a framework that links concurrent dynamics of metabolic and hemodynamic signals. Using this framework, concurrent fMRI signals could successfully predict fPET-FDG dynamics driven by both explicit visual stimuli and naturalistic arousal. Our results substantiate the dynamic coupling of metabolic and hemodynamic changes in the human brain, emphasizing the value of fPET-FDG in conjunction with BOLD-fMRI for characterizing time-resolved interdependence of neurovascular and neurometabolic activity. Consequently, our research advances the exploration of temporal couplings between hemodynamics and neural metabolism, addressing a theme of fundamental interest to neuroimaging and the wider field of neuroscience.Acknowledgements
We would like to thank Kyle Droppa, Shirley Hsu, Grae Arabasz, Oliver Ramsey, and Amy Kendall for their help with PET-MRI scanning support. This work was supported in part by the NIH grants (R00-NS118120, R01-MH111438), by the Harvard Mind Brain Behavior Faculty Research Award, by the Brain & Behavior Research Foundation Young Investigator Grant, by the BrightFocus Foundation research grant, and by the MGH/HST Athinoula A. Martinos Center for Biomedical Imaging. Computational resources were generously provided by the Massachusetts Life Sciences Center (https://www.masslifesciences.com/).References
[1] Villien, M., Wey, H.Y., Mandeville, J.B., Catana, C., Polimeni, J.R., Sander, C.Y., Zürcher, N.R., Chonde, D.B., Fowler, J.S., Rosen, B.R. and Hooker, J.M., 2014. Dynamic functional imaging of brain glucose utilization using fPET-FDG. Neuroimage, 100, pp.192-199.
[2] Hahn, A., Gryglewski, G., Nics, L., Hienert, M., Rischka, L., Vraka, C., Sigurdardottir, H., Vanicek, T., James, G.M., Seiger, R. and Kautzky, A., 2016. Quantification of task-specific glucose metabolism with constant infusion of 18F-FDG. Journal of Nuclear Medicine, 57(12), pp.1933-1940.
[3] Jamadar, S.D., Ward, P.G., Li, S., Sforazzini, F., Baran, J., Chen, Z. and Egan, G.F., 2019. Simultaneous task-based BOLD-fMRI and [18-F] FDG functional PET for measurement of neuronal metabolism in the human visual cortex. Neuroimage, 189, pp.258-266.
[4] Rischka, L., Gryglewski, G., Pfaff, S., Vanicek, T., Hienert, M., Klöbl, M., Hartenbach, M., Haug, A., Wadsak, W., Mitterhauser, M. and Hacker, M., 2018. Reduced task durations in functional PET imaging with [18F] FDG approaching that of functional MRI. Neuroimage, 181, pp.323-330.
[5] Stiernman, L.J., Grill, F., Hahn, A., Rischka, L., Lanzenberger, R., Panes Lundmark, V., Riklund, K., Axelsson, J. and Rieckmann, A., 2021. Dissociations between glucose metabolism and blood oxygenation in the human default mode network revealed by simultaneous PET-fMRI. Proceedings of the National Academy of Sciences, 118(27), p.e2021913118.
[6] Hahn, A., Breakspear, M., Rischka, L., Wadsak, W., Godbersen, G.M., Pichler, V., Michenthaler, P., Vanicek, T., Hacker, M., Kasper, S. and Lanzenberger, R., 2020. Reconfiguration of functional brain networks and metabolic cost converge during task performance. elife, 9, p.e52443.
[7] Jamadar, S.D., Ward, P.G., Liang, E.X., Orchard, E.R., Chen, Z. and Egan, G.F., 2021. Metabolic and hemodynamic resting-state connectivity of the human brain: a high-temporal resolution simultaneous BOLD-fMRI and FDG-fPET multimodality study. Cerebral Cortex, 31(6), pp.2855-2867.
[8] Jamadar, S.D., Zhong, S., Carey, A., McIntyre, R., Ward, P.G., Fornito, A., Premaratne, M., Jon Shah, N., O’Brien, K., Stäb, D. and Chen, Z., 2021. Task-evoked simultaneous FDG-PET and fMRI data for measurement of neural metabolism in the human visual cortex. Scientific Data, 8(1), p.267.
Figures