3410
T1-weighted fMRI in mouse visual cortex at 0.1 mm resolution using a UTE sequence after iron-oxide contrast injection1School of Electrical Engineering and Computer Science, The University of Queensland, St. Lucia, Australia, 2Centre for Advanced Imaging, The University of Queensland, St. Lucia, Australia, 3Queensland Brain Institute, The University of Queensland, St. Lucia, Australia, 4Athinoula A. Martinos Centre for Biomedical Imaging, Massachusetts General Hospital, Charlestown, MA, United States, 5Department of Radiology, Harvard Medical School, Boston, MA, United States, 6Division of Health Sciences and Technology, Massachusetts Institute of Technology, Cambridge, MA, United States, 7ARC Centre for Innovation in Biomedical Imaging and Technology, The University of Queensland, St. Lucia, Australia
Synopsis
Keywords: Task/Intervention Based fMRI, Contrast Agent, CBV, Data Acquisition, Data Analysis
Motivation: Conventional use of typical T2* weighted sequences such as FLASH post iron-oxide contrast injection exhibits an enhanced microvascular weighting but neglects changes in pial vessels due to strong dephasing defects.
Goal(s): Our goal is to study changes in the pial vessels which will hopefully aid in the interpretation of non-BOLD fMRI signals and help us understand the CBV fMRI signal at a deeper level.
Approach: We utilised a radial UTE sequence post-contrast injection with short TE and short readout duration
Results: We found consistent positive signal changes in the visual cortex and pial surface.
Impact: We found positive signal changes at the pial surface and in the visual cortex upon stimulation. This might indicate the involvement of both micro- and macrovasculature and provide further insights into cerebral-blood-volume changes across vascular compartments.
Introduction
It has been shown in animal fMRI studies that measuring CBV shows higher specificity to the microvasculature1 and simplifies interpretation2. Typical CBV measurement methods in animal imaging use an iron oxide-based (SPIO) contrast agent injected into the bloodstream3–6 and image acquisition with T2*-weighted sequences with high contrast-to-noise ratio7 and high specificity to the microvasculature1. In this study, we utilise the T1 shortening effect of SPIO that allows bright blood contrast as shown when ultra-short TE readouts are used8–10. We investigate fMRI signal changes post SPIO injection using UTE readout in different brain ROIs (cortical tissue; pial surface) and compare them to a conventional, longer TE acquisition.Materials and Methods
Experimental Setup and Animal Preparation:Imaging of eight C57/BL/6J mice was performed on a 9.4T preclinical scanner (Bruker Biospec, Ettlingen, Germany) using an 86-mm volume coil for single transmission and custom-made ellipsoid surface coil for signal reception. Before starting experiments, 29.2 mg Fe/Kg (Molday ION, BioPAL Inc) was administered intravenously as a bolus. Mice were sedated using 0.2-0.5% isoflurane with a medetomidine bolus of 0.05 mg/Kg and constant infusion maintained at 0.1 mg/Kg/h.
Functional Imaging:
Data from eight subjects was acquired (five at 0.2x0.2x0.5 mm3 and three at 0.1x0.1x0.5 mm3) with volume TR of 3s and 150 repetitions at shortest possible TE of 0.164 ms using a Half-Gauss pulse with FA=20°. We used 2 slices for low resolution and 1 slice for high resolution to maintain volume TR. For the lower 0.2mm in-plane resolution we also acquired runs with FLASH at TEs of 0.5ms, 1ms, 5ms, and 10 ms. A blue flashing light with a frequency of 5 Hz was used as the visual stimulus with 30s initial resting period followed by 30s ON and 30s OFF continued for 7 blocks.
Data Analysis Pipeline:
Regions of Interest (ROIs) corresponding to the pial surface, and the primary visual cortex were marked on the mean functional run acquired using the FLASH sequence as the reference point in low-resolution fMRI data. Time series data were subsequently computed using these ROIs, and the results were averaged across all five subjects in the study. For high-resolution fMRI data, all functional runs from the same session were combined to create a mean image. ROIs were then defined on this mean image. Subsequently, average activation maps and time series data were calculated from these ROIs.
Results
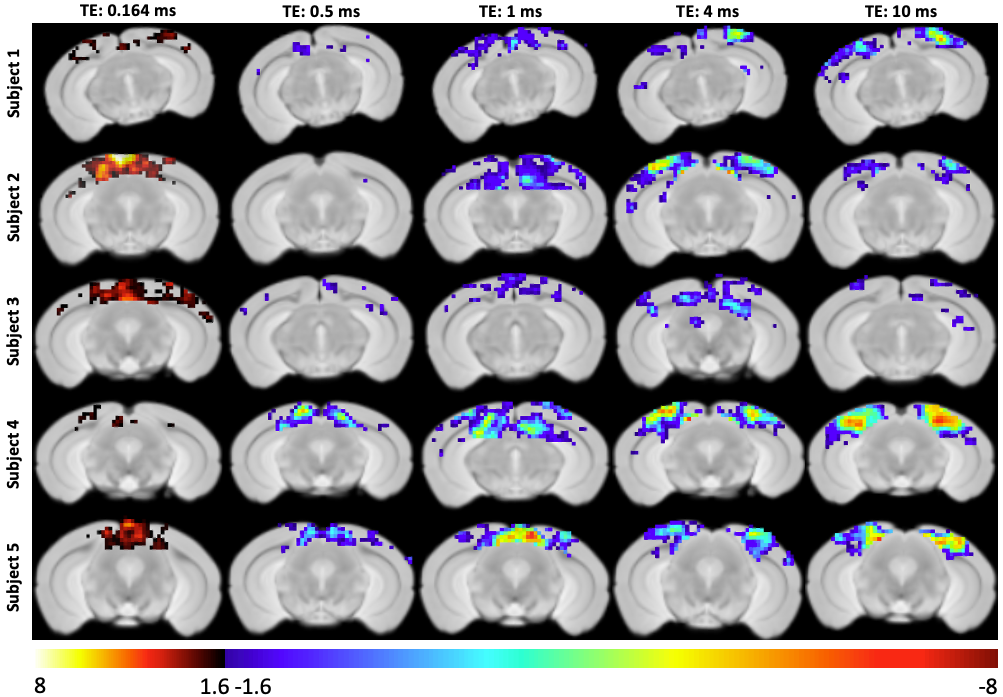
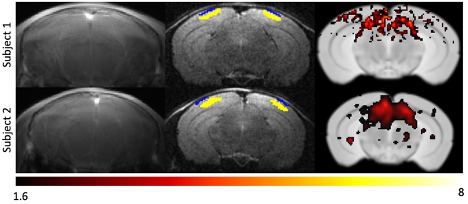
Overall, activation was found in all ROIs using UTE sequence pot contrast agent injection. We measured positive signal changes at the shortest possible TE, turning into negative signal changes with increasing TE (Figure 1). Inconsistent activation was found at TE=0.5 ms using UTE. FLASH at TE=10 ms showed a strong negative signal limited to the visual cortex thereby showing an enhanced microvascular weighting.Figure 2 shows the mean functional image across all the runs in the same session as for each subject individually at high resolution (0.1x0.1x0.5 mm3). With reference to the Paxinos and Franklin Mouse Brain ATLAS, we marked ROIs at the pial surface and visual cortex for two subjects as shown in Figure 2: Middle Column with structural image as the underlay. Column 3 shows the activation maps (p < 0.05) at TE = 0.164 ms. Positive changes can be seen in the visual cortex at high resolution as well.
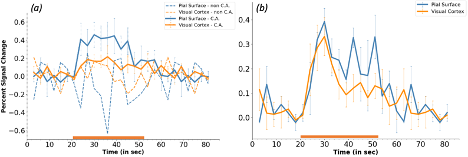
Figure 3a shows the time course in the pial surface and visual cortex with and without contrast injection at 0.2x0.2x0.5 mm3. Positive signal changes can be seen upon stimulation in all ROIs after contrast injection. No consistent signal change can be seen in either ROI at the shortest TE without contrast injection. Figure 3b shows the positive signal change in all ROIs in 100 mm resolution.
Discussion and Conclusion
The role of different vascular compartments upon stimulation has been an extensive debate in the field of medical imaging. Conventional use of T2* weighted sequences has shown enhanced microvascular weighting. Our method demonstrates acquiring bright blood contrast at short TE and short readout durations that can help us see positive signal changes in all vascular compartments. This will allow us to see a fuller picture of vascular responses to the neuronal activity that aid in the interpretation of the non-BOLD fMRI signals and help us understand CBV signal at a deeper level.Acknowledgements
The authors acknowledge funding from the NHMRC-NIH BRAIN Initiative Collaborative Research Grant APP1117020, and the NIH NIMH BRAIN Initiative grant R01-MH111419. I would also like to recognize the veterinary support provided by Dr Heidi-Niland Rowe, Veterinary Officer, University of Queensland and animal technical support provided by Ms Barb Arnts, Animal Technician, University of Queensland. Also, I would like to thank Dr Nyoman Kurniawan, who helped modify the UTE sequence to make it compatible with the visual stimulation.References
1. Mandeville, J. B. & Marota, J. J. A. Vascular Filters of Functional MRI: Spatial Localization Using BOLD and CBV Contrast. Magn Reson Med vol. 42 (1999).
2. Kim, S. G. et al. Cerebral blood volume MRI with intravascular superparamagnetic iron oxide nanoparticles. NMR Biomed 26, 949–962 (2013).
3. Berry, I. et al. Contribution of Sinerem@ Used as Blood-Pool Contrast Agent: Detection of Cerebral Blood Volume Changes during Apnea in the Rabbit. (1996).
4. Hamberg, L. M. et al. Continuous Assessment of Relative Cerebral Blood Volume in Transient Ischemia Using Steady State Susceptibility-Contrast MRI. (1996).
5. Kennan, R. P., Scanley, B. E., Innis, R. B. & Gore, J. C. Physiological Basis for BOLD MR Signal Changes Due to Neuronal Stimulation: Separation of Blood Volume and Magnetic Susceptibility Effects. (1998).
6. Mandeville, J. B. et al. Dynamic Functional Imaging of Relative Cerebral Blood Volume During Rat Forepaw Stimulation. (1998).
7. Mandeville, J. B. IRON fMRI measurements of CBV and implications for BOLD signal. NeuroImage vol. 62 1000–1008 Preprint at https://doi.org/10.1016/j.neuroimage.2012.01.070 (2012).
8. Gharagouzloo, C. A., McMahon, P. N. & Sridhar, S. Quantitative contrast-enhanced MRI with superparamagnetic nanoparticles using ultrashort time-to-echo pulse sequences. Magn Reson Med 74, 431–441 (2015).
9. Gharagouzloo, C. A. et al. Quantitative vascular neuroimaging of the rat brain using superparamagnetic nanoparticles: New insights on vascular organization and brain function. Neuroimage 163, 24–33 (2017).
10. Jain, N., Bollmann, S., Polimeni, J., Chuang, K.-H. & Barth, M. Evaluating ultra-short echo time (UTE) cerebral blood volume (CBV)-based fMRI using an iron-oxide contrast agent in mouse visual cortex at 9.4T. in doi:10.58530/2022/2336.
Figures