3405
Novel Doppler US-gated 3D fetal whole-heart MRI with motion correction: initial validation using paired phase-contrast flow data1Biomedical Engineering Department, School of Biomedical Engineering and Imaging Sciences, King's College London, London, United Kingdom, 2Department of Congenital Heart Disease, Evelina Children's Hospital, London, United Kingdom, 3Centre for the Developing Brain, School of Biomedical Engineering and Imaging Sciences, King's College London, London, United Kingdom, 4Guys and St Thomas' NHS Foundation Trust, London, United Kingdom, 5School of Biomedical Sciences, King's College London, London, United Kingdom
Synopsis
Keywords: Prenatal, Fetus
Motivation: A novel pipeline for the creation of 3D fetal whole-heart datasets has been devised by combining Doppler US-gating and slice-to-volume registration.
Goal(s): Our goal was to perform initial validation of the resultant 3D+t datasets.
Approach: We assessed for internal consistency by deriving fetal stroke volume data from two methods in six subjects. Stroke volume data were obtained through volumetric analysis of the 3D+t volume alongside assessment of paired 2D+t phase-contrast flow data.
Results: There was correlation between volumetrically derived stroke-volume data with that derived from 2D+t phase contrast flow, however the volumetric method was biased toward lower readings.
Impact: Initial validation of a novel pipeline for the creation 3D fetal whole-heart datasets shows correlation between stroke volumes derived from volumetry and phase contrast flow data. Future work will explore the bias toward lower stroke volumes obtained by volumetry.
Introduction
Static 2D-3D motion-corrected slice-volume registration (3DSVR) is a highly reliable tool in visualising the fetal vasculature [1], however dynamic 3D imaging of the fetal heart has been traditionally limited by the lack of an external gating signal. Retrospective image-based gating methods have been described in combination with 3DSVR, however these are sensitive to image quality and may not fully capture normal fetal heart rate variation during acquisition [2, 3]). Doppler-ultrasound (DUS) gating has been used to acquire time-resolved 3D sequences; however, these are invariably time consuming with high susceptibility to fetal motion. In this study we demonstrate a novel approach, combining DUS gating and motion-corrected 3DSVR. We have performed initial validation work to assess for internal consistency by comparing the results of volumetric analysis with paired phase contrast flow data.Methods
Six subjects of gestational age 31+4 – 34+2 weeks were scanned at 1.5T (MAGNETOM Sola, Siemens Healthcare, Erlangen, Germany). The subjects carried fetuses with congenital heart disease, outlined in table 1. All fetuses had intact ventricular septae and no significant atrioventricular valve regurgitation as assessed by fetal echocardiography.Volumetric data:
Five overlapping multiplanar bSSFP cine stacks were acquired (FOV 400x320mm, TE/TR/TRseg = 1.93/4.33/56.3ms, 1x1mm in-plane/6mm slice resolution, flip angle 60°, acceleration factor 3, 20 frames in around 3 seconds/slice), gated using a DUS gating device [4]. These cine stacks were reconstructed into a 3D+t whole-heart volume (isotropic resolution of 1.0mm, 20 frames), using a SVR technique outlined in [2] according to the cardiac phase of each cine frame extracted from the gated dataset. This volume was inspected visually, and volumetric analysis was performed by manual segmentation of each ventricle at end-systole and end-diastole (e.g. figure 2). Mean fetal heart rate data were extracted from the DUS gating signal, and fetal weight was estimated by segmentation of the fetal volume from a bSSFP stack covering the maternal uterus.
Flow data:
Paired DUS-gated 2D+t phase contrast flow data were acquired (FOV 240x240mm, TE/TR/TRseg = 4.00/6.42/51.4ms, 1.25x1.25mm in-plane/5mm slice thickness, flip angle 20°, 20 frames, 150cm/s Venc) for the ascending aorta (AAo) and main pulmonary artery (MPA) in each fetus. The left and right ventricular stroke volumes were derived from these respectively.
Results
Subjective inspection:The 3D+t volume was inspected visually with multiplanar reformat by an expert observer (e.g. figure 1). The ventricular chambers were clearly visualised, with an expected pattern of myocardial deformation through the cardiac cycle.
Volumetry and flow data:
The measured ventricular volumes and derived volumetric data are shown in table 1 alongside paired 2D+t phase contrast flow data. Ejection fraction ((EDV-ESV)/EDV) ranged from 46.7 – 73.1% for the left ventricle (LV) and 46.0 – 65.6% for the right ventricle (RV).
Analysis:
There was strong correlation between the stroke volume data derived from each method (figure 3), which reached statistical significance (Pearson correlation coefficient 0.754, p-value 0.005). A paired t-test showed a mean bias in stroke volume of-0.983mL for volumetry-derived measures (p = 0.007), however. This effect was more marked for RV measurements when compared to LV (figures 3 and 4) and was associated with lower calculated ejection fraction (table 1).
Discussion and Conclusion:
This is a proof-of-concept study using a novel pipeline for combining 2D DUS-gated cine sequences with 3DSVR to generate a motion-robust, high spatiotemporal resolution volume of the fetal heart. We aimed to validate the resultant volume by deriving stroke volume measurements from two techniques, volumetry and 2D+t phase contrast flow. This work is limited by a small sample size, however in this initial exploration of patients with congenital heart disease, we noted a significant bias toward lower stroke volumes as measured by volumetric analysis when compared to phase contrast flow assessment.Work is ongoing to explain why stroke volume data are lower than expected when measured by volumetry in some cases. One possibility is that not all 3D+t datasets were able represent the full extent of the cardiac cycle, leading to underestimation of the stroke volume. This would also explain the trend to lower EF in these cases. The fact that this bias was more pronounced for the right ventricle may be related to the fact that this is more challenging to segment than the left ventricle, given its more complex geometry. Future work will assess the reliability and accuracy of these new methods across a range of fetuses with and without congenital heart disease. This will focus on the reliability of these methods across different gestations and pathologies, interobserver variability, and comparison between DUS and image-based gating approaches.
Acknowledgements
The authors would like to thank all participants, midwives, and radiographers who contributed to this study. Dr David Lloyd acknowledges funding from the British Heart Foundation via an Intermediate Clinical Research Fellowship (FS/ICRF/22/26028). This work was supported by core funding from the Wellcome/EPSRC Centre for Medical Engineering [WT203148/Z/16/Z] and by the National Institute for Health Research (NIHR) Clinical Research Facility based at Guy’s and St Thomas’ NHS Foundation Trust and King’s College London. The views expressed are those of the author(s) and not necessarily those of the NHS, the NIHR or the Department of Health and Social Care.
The Smart-sync Doppler device was acquired via funding from MEERKAT/UKRI Future Leaders Fellowship [MR/T018119/1
References
- Lloyd, David F. A., Kuberan Pushparajah, John M. Simpson, Joshua F. P. van Amerom, Milou P. M. van Poppel, Alexander Schulz, Bernard Kainz, et al. ‘Three-Dimensional Visualisation of the Fetal Heart Using Prenatal MRI with Motion-Corrected Slice-Volume Registration: A Prospective, Single-Centre Cohort Study’. The Lancet 393, no. 10181 (20 April 2019): 1619–27. https://doi.org/10.1016/S0140-6736(18)32490-5.
- Amerom, Joshua F.P. van, David F.A. Lloyd, Maria Deprez, Anthony N. Price, Shaihan J. Malik, Kuberan Pushparajah, Milou P.M. van Poppel, Mary A. Rutherford, Reza Razavi, and Joseph V Hajnal. ‘Fetal Whole-Heart 4D Imaging Using Motion-Corrected Multi-Planar Real-Time MRI’. Magnetic Resonance in Medicine 82, no. 3 (2019): 1055–72. https://doi.org/10.1002/mrm.27798.
- Roberts, Thomas A., Joshua F. P. van Amerom, Alena Uus, David F. A. Lloyd, Milou P. M. van Poppel, Anthony N. Price, Jacques-Donald Tournier, et al. ‘Fetal Whole Heart Blood Flow Imaging Using 4D Cine MRI’. Nature Communications 11 (5 October 2020): 4992. https://doi.org/10.1038/s41467-020-18790-1.
- Kording, Fabian, Bjoern P. Schoennagel, Manuela Tavares de Sousa, Kai Fehrs, Gerhard Adam, Jin Yamamura, and Christian Ruprecht. ‘Evaluation of a Portable Doppler Ultrasound Gating Device for Fetal Cardiac MR Imaging: Initial Results at 1.5T and 3T’. Magnetic Resonance in Medical Sciences 17, no. 4 (21 February 2018): 308–17. https://doi.org/10.2463/mrms.mp.2017-0100.
- Prsa, Milan, Liqun Sun, Joshua van Amerom, Shi-Joon Yoo, Lars Grosse-Wortmann, Edgar Jaeggi, Christopher Macgowan, and Mike Seed. ‘Reference Ranges of Blood Flow in the Major Vessels of the Normal Human Fetal Circulation at Term by Phase-Contrast Magnetic Resonance Imaging’. Circulation: Cardiovascular Imaging 7, no. 4 (July 2014): 663–70. https://doi.org/10.1161/CIRCIMAGING.113.001859.
Figures
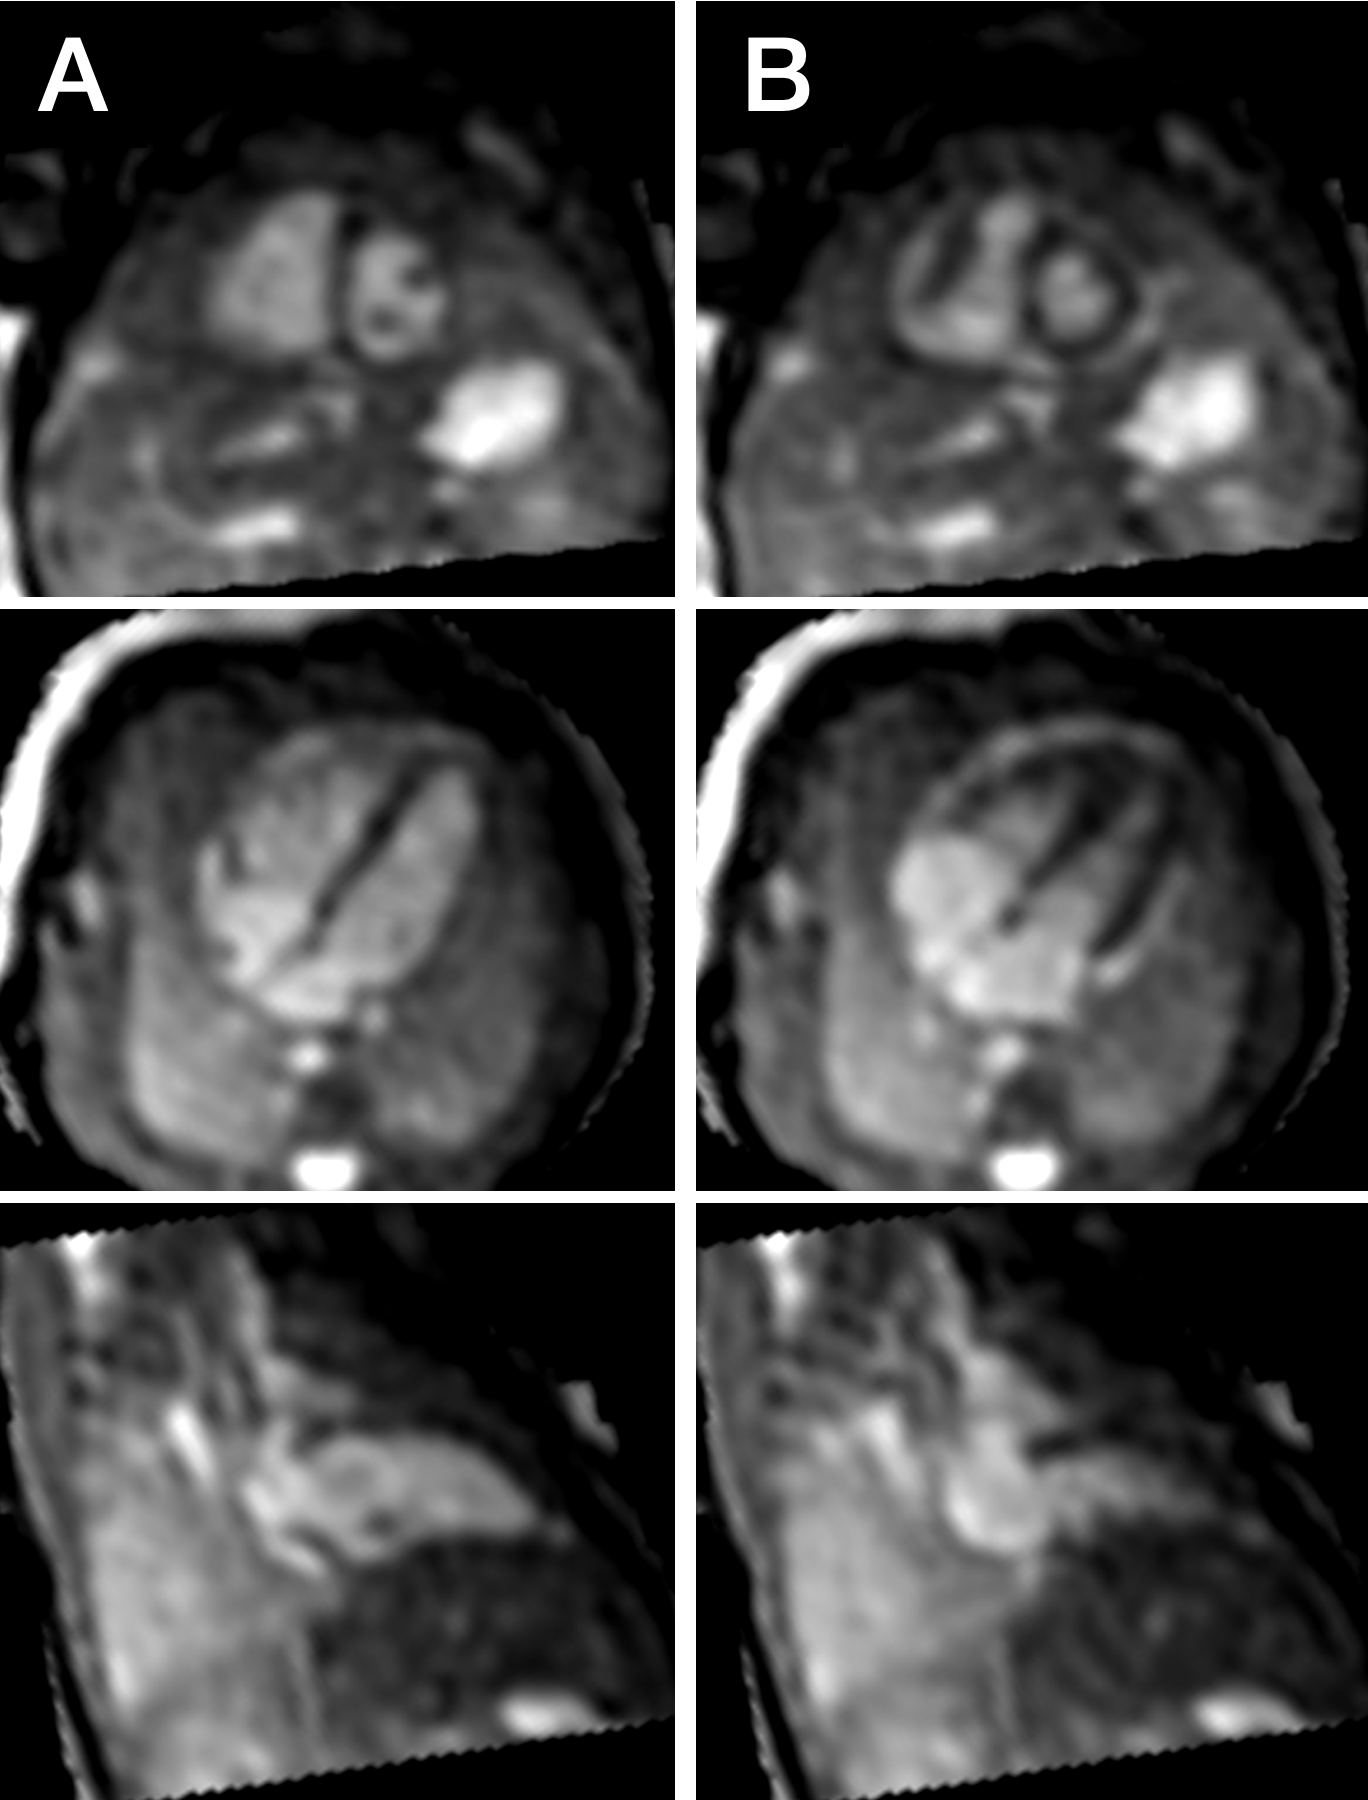
Figure 1:
Multiplanar reformat of time-resolved 3D volume showing ventricular short-axis, 4-chamber, and LV 2-chamber views at end-diastole (A) and end-systole (B).
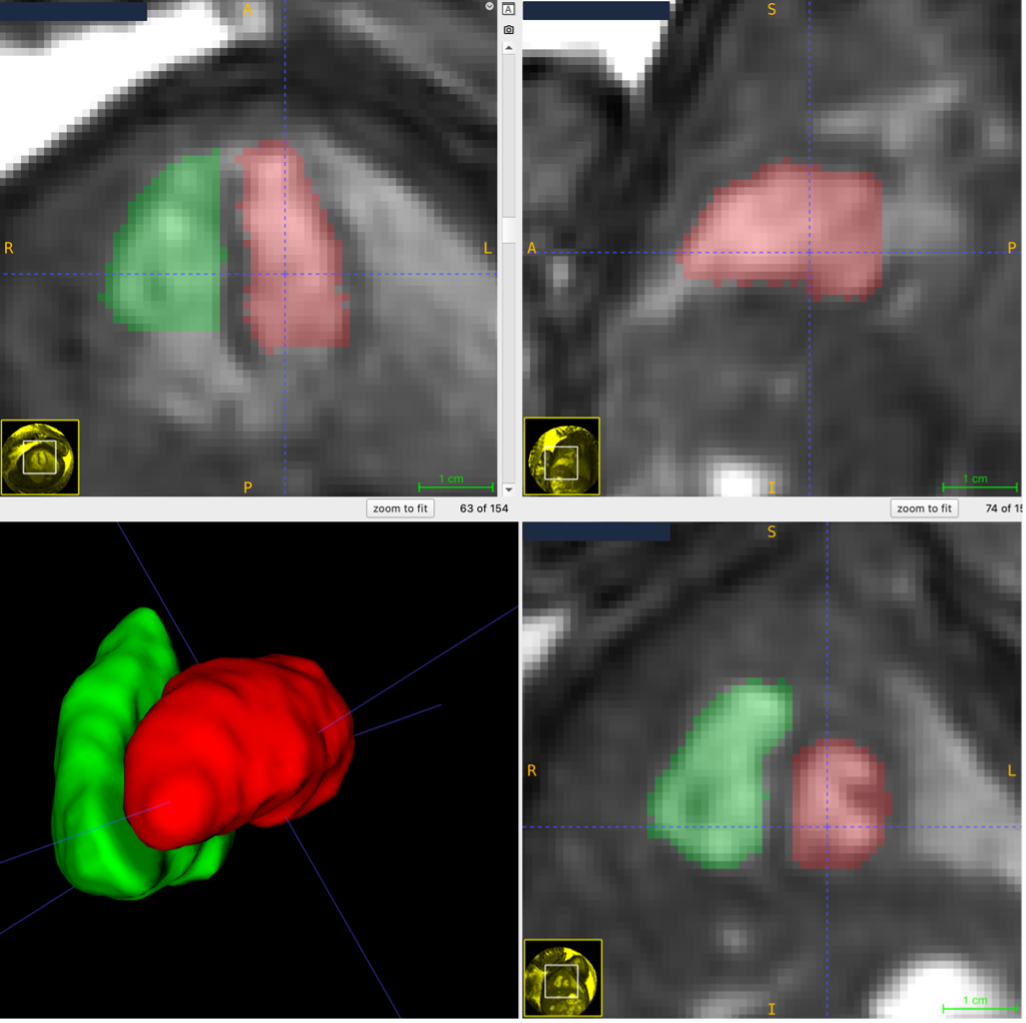
Segmentation of the ventricular volumes at end-diastole (left ventricle in red, right ventricle in green)
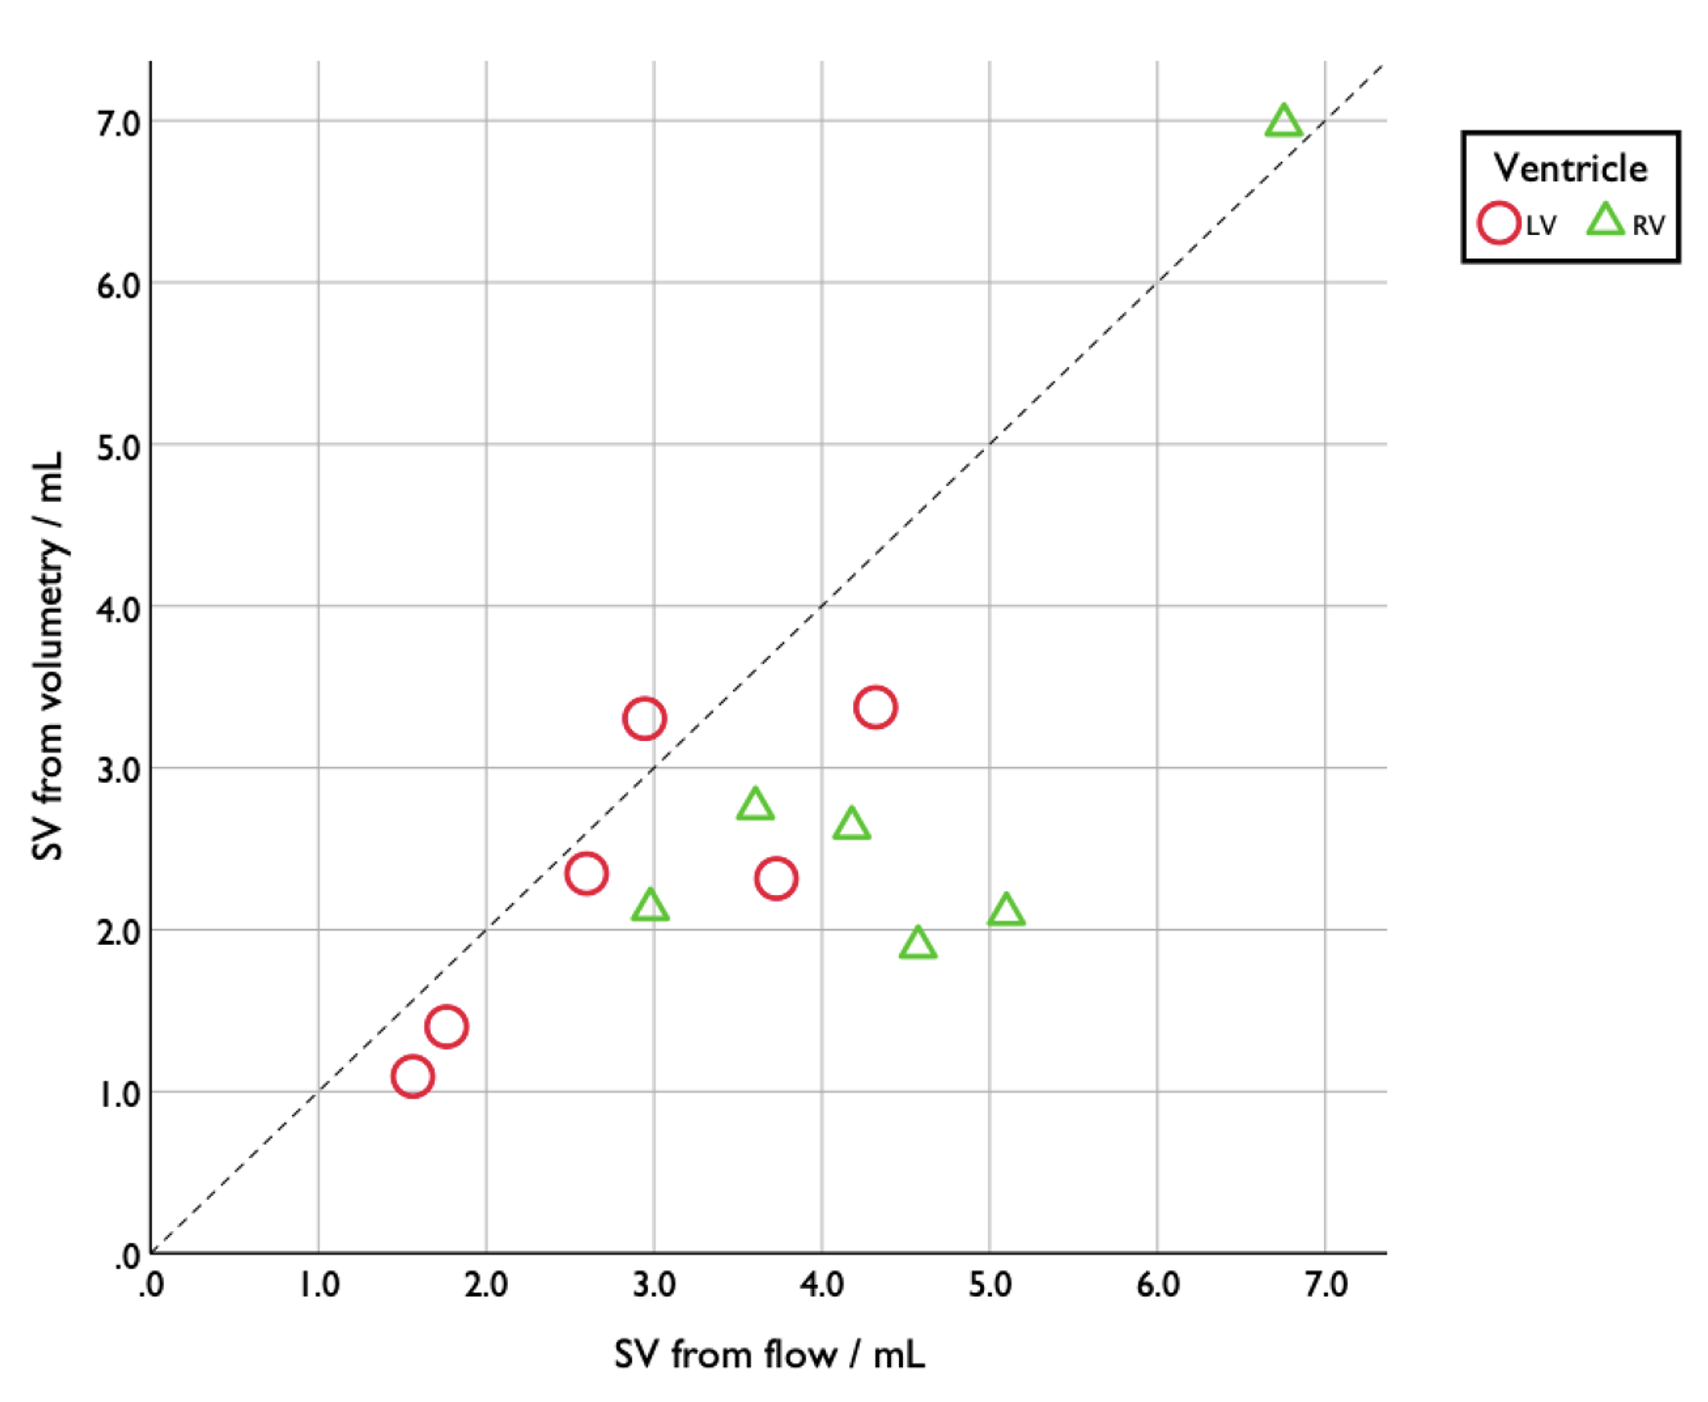
Scatter graph showing stroke volume data as obtained by volumetry against that acquired by phase contrast flow. Dashed line represents line of no-difference between methodology.
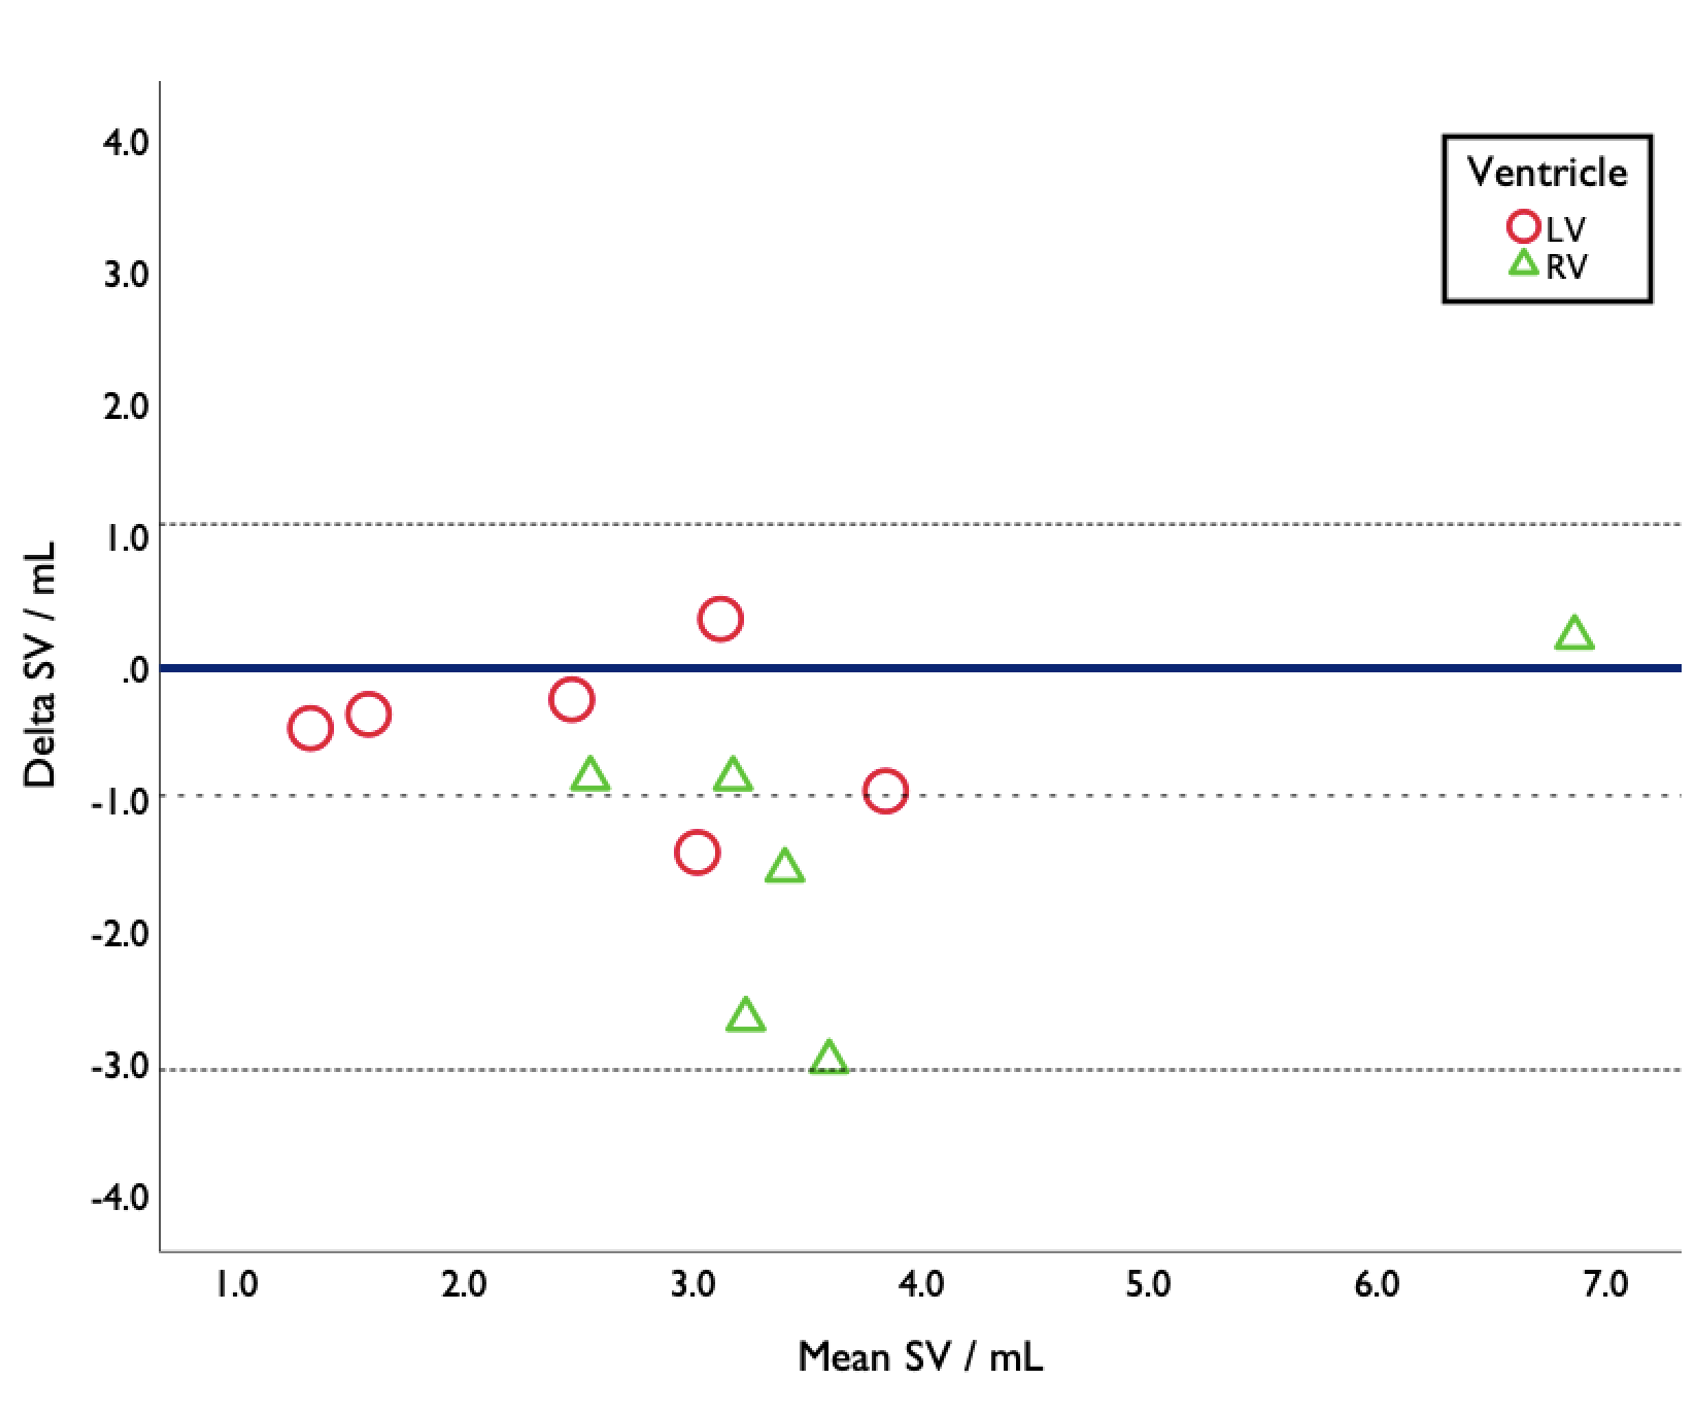
Bland-Altman plot showing difference in stroke volume measurements as obtained by volumetry and phase contrast flow data. Negative values represent lower stroke volume readings by volumetry. Dashed line = mean difference. Dotted line = +/- 2SD.
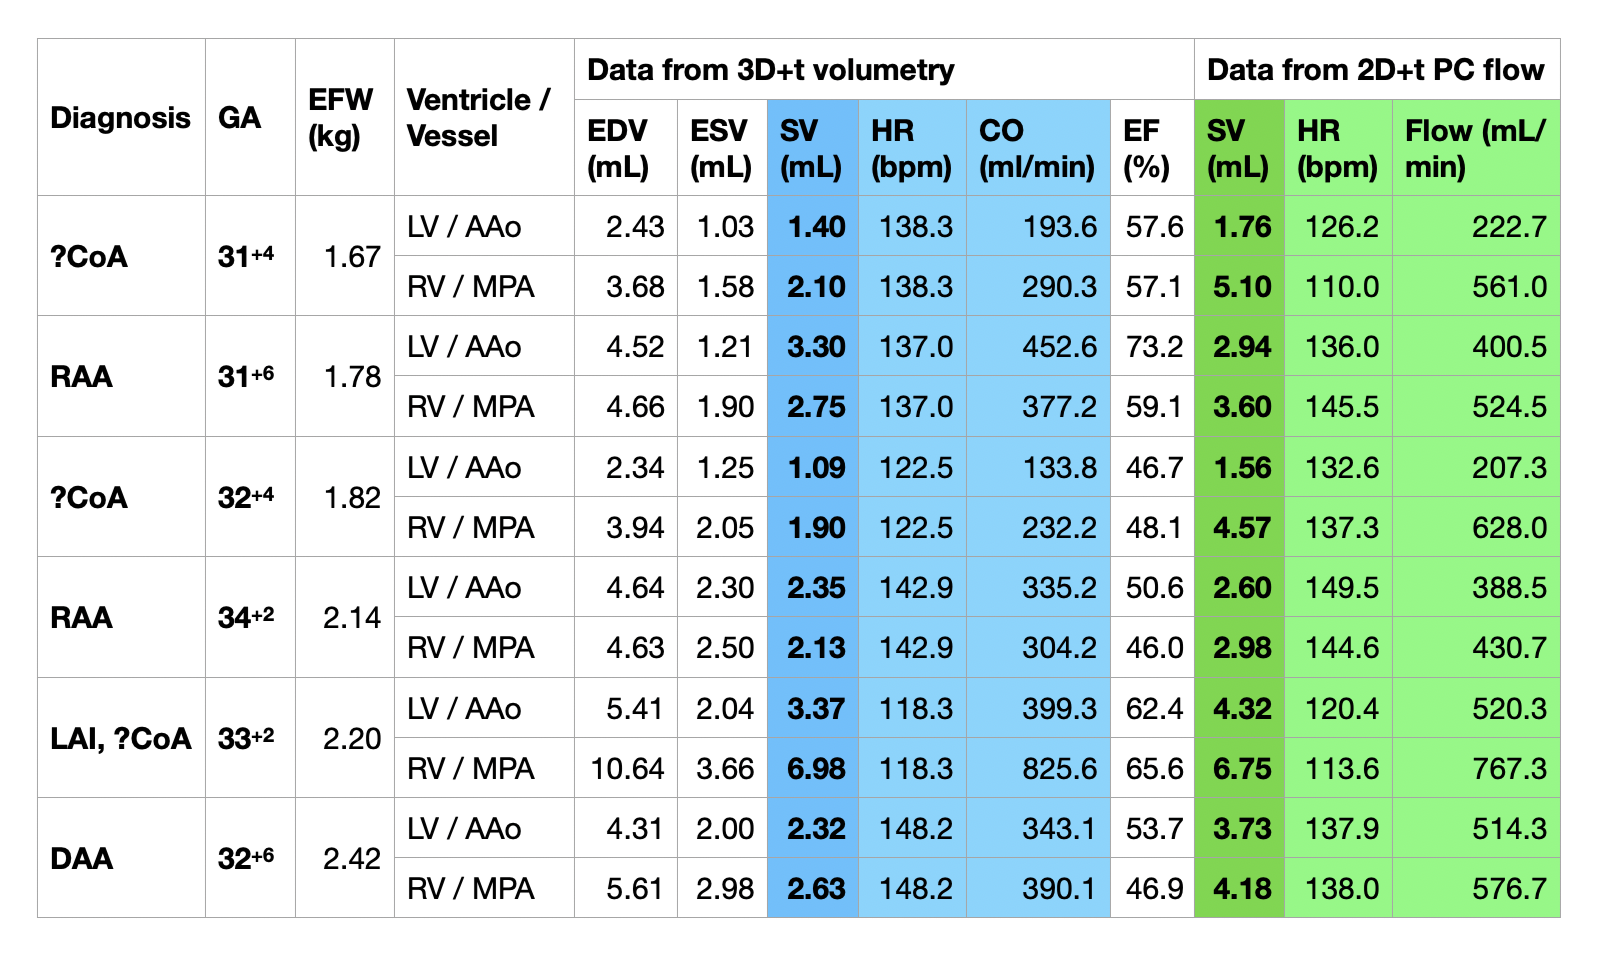
Table 1:
Summary of paired data from 3D+t volumetry and 2D+t phase contrast flow analysis.
GA = gestational age. EFW = estimated fetal weight. PC = phase contrast. EDV = end diastolic volume. ESV = end systolic volume. SV = stroke volume. HR = heart rate. CO = cardiac output. EF = ejection fraction. ?CoA = suspected coarctation of the aorta. RAA = right aortic arch. LAI = left atrial isomerism. DAA = double aortic arch.