3400
Noninvasive Assessment of Aortic Biomechanics using 4D Flow MRI in a Porcine Model of Aortic Coarctation1Surgery, University of Wisconsin-Madison, Madison, WI, United States, 2Pediatrics, University of Wisconsin-Madison, Madison, WI, United States, 3Radiology, University of Wisconsin-Madison, Madison, WI, United States, 4Mechanical Engineering, University of Wisconsin-Madison, Madison, WI, United States
Synopsis
Keywords: Flow, Vessels
Motivation: Aortic coarctation (COA) is a congenital heart disease that induces harmful structural cardiovascular changes. Operations to address COA have varying outcomes, leaving uncertainty as to whether maladaptive processes can be altered. Despite repair, patients have an increased risk of early cardiovascular morbidity and mortality.
Goal(s): To utilize 4D Flow MRI to monitor and study the vascular biomechanics of aortic coarctation in a porcine model
Approach: In this pilot study, a porcine model of aortic coarctation was developed and underwent serial 4D flow MRI scans.
Results: Treatment did not significantly alter quantitative metrics of aortic flow, velocity or collateralization
Impact: 4D Flow MRI provides a non-invasive method to evaluate a novel porcine model of aortic coarctation with resultant functional metrics that provide insight into the significant early remodeling and lack of early treatment efficacy in this patient population.
Introduction
Coarctation of the aorta (COA) is a common congenital heart disease that results in aortic narrowing and potential obstruction.1 High grade stenosis requires urgent intervention, however low to moderate grade coarctation may be treated with medical management.6 Unfortunately, despite intervention at symptom onset or pressure gradient >20mmHg, treatment does not ensure long-term cardiovascular health and can lead to systemic hypertension, cardiac hypertrophy, myocardial infarction and stroke.2,7-9 Early aortic coarctation intervention may normalize blood flow, disrupting aortic remodeling and reducing downstream effects.9 Elucidating the biomechanical responses to both coarctation and intervention can alter time-to and efficacy of intervention. In this study we aim to use 4D Flow MRI, a promising noninvasive imaging tool that delivers both anatomical and functional parameters, to monitor and study the vascular biomechanics response to disease presence and intervention in an animal model of aortic coarctation.Methods
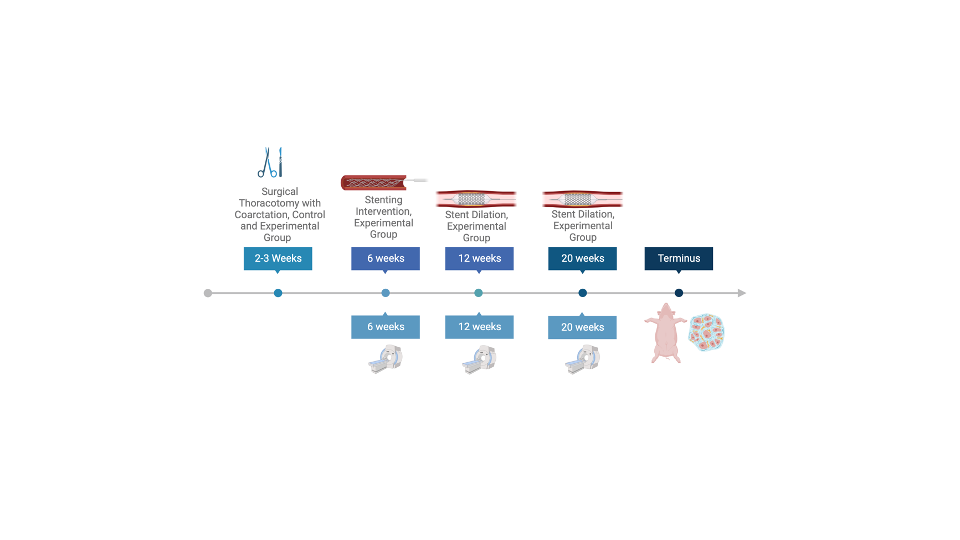
Porcine model of COA: A total of 14 animals were comprised of 4 sham, 4 coarctation controls (CC) and 6 stented coarctation (CS) models. Piglets, age 2-3 weeks, were anesthetized, ventilated and a discrete COA was created. Analgesia was provided at case conclusion and for 48 hours post-op with monitoring by veterinary staff. Major timepoints included COA stenting (6 weeks), stent dilation (12 and 20 weeks) and MRI (6, 12 and 20 weeks) as illustrated in Figure 1.4D Flow MRI Imaging and Analysis: Serial 4D Flow MRI imaging was obtained on a 3.0T imaging using radial acquisition (isotropic-voxel radial projection imaging [PCVIPR]).10 Aortic segmentation was performed with Mimics (Materialise, Leuven, Belgium) prior to comprehensive fluid dynamics analysis with Ensight (CEI, Apex, NC). Blood flow quantification was performed in predefined vascular planes (ascending aorta, pre-coarctation, post-coarctation, diaphragmatic aorta) to assess net flow, velocities and helical or vortical flow. The internal mammary arteries (IMA) were independently segmented to quantify collateralization. Local aortic stiffness was assessed by pulse wave velocity (PWV), calculated from consecutive orthogonal planes in the descending aorta from the pre-coarcted aorta to the diaphragm.11,12Results
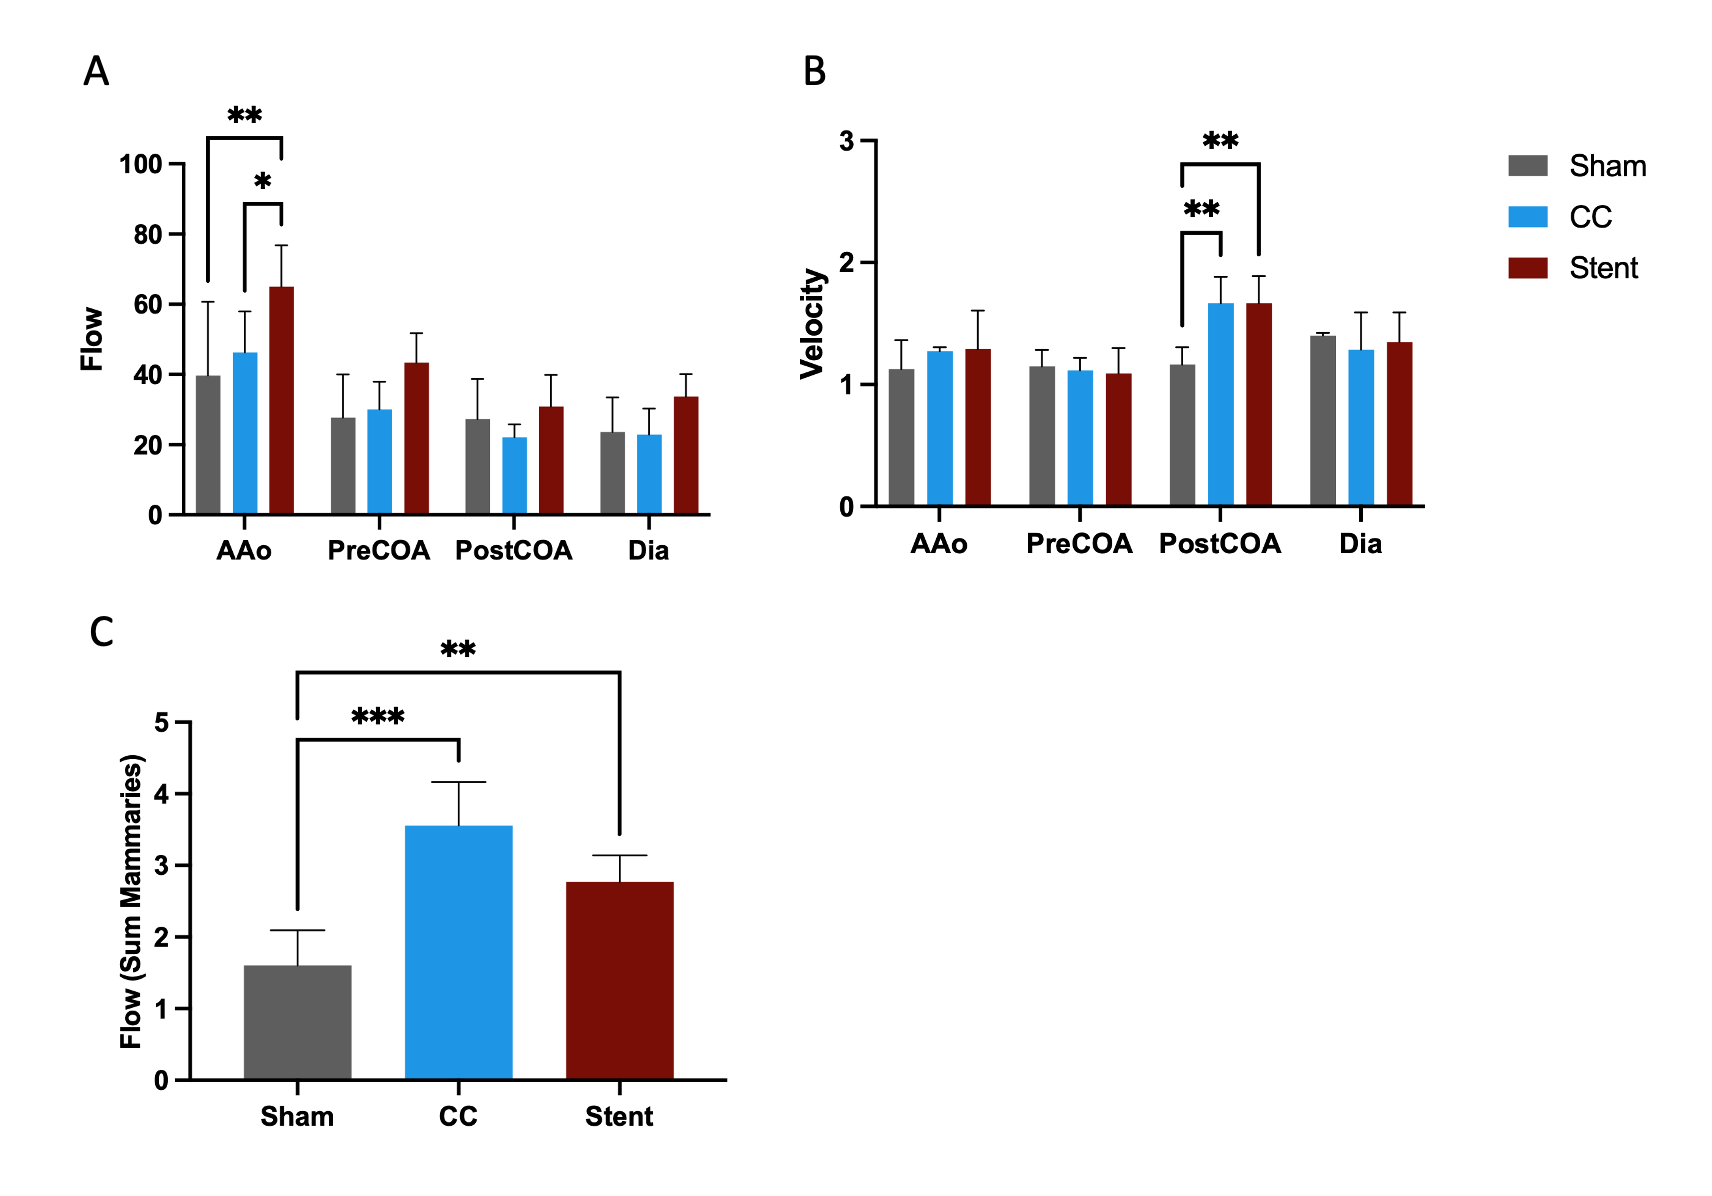
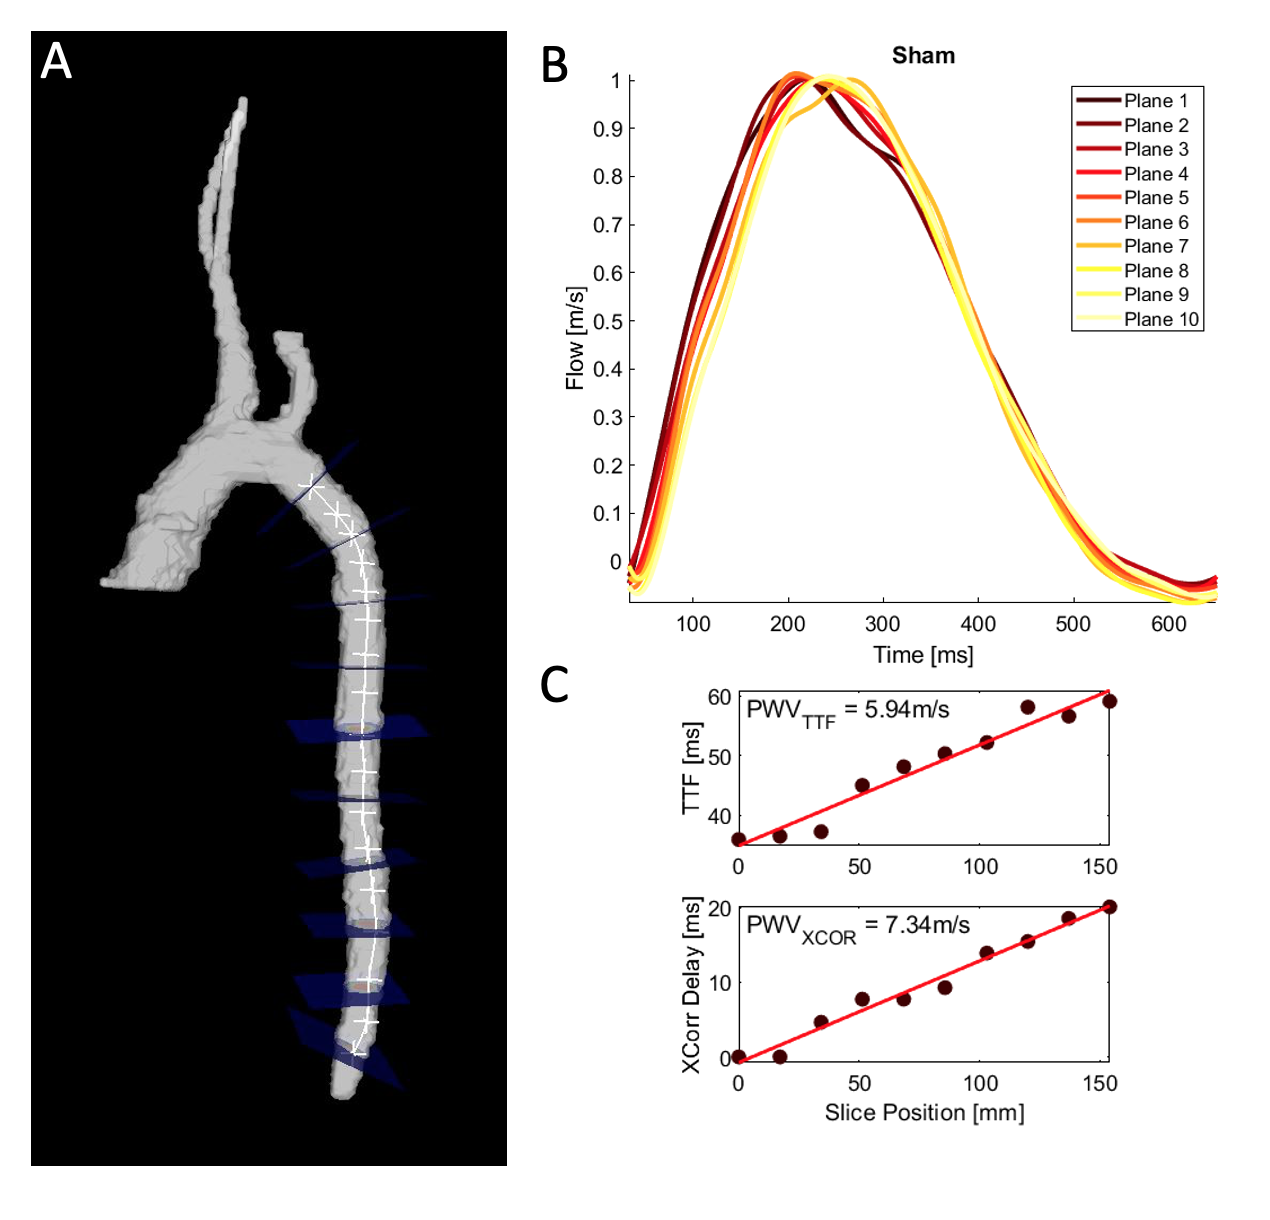
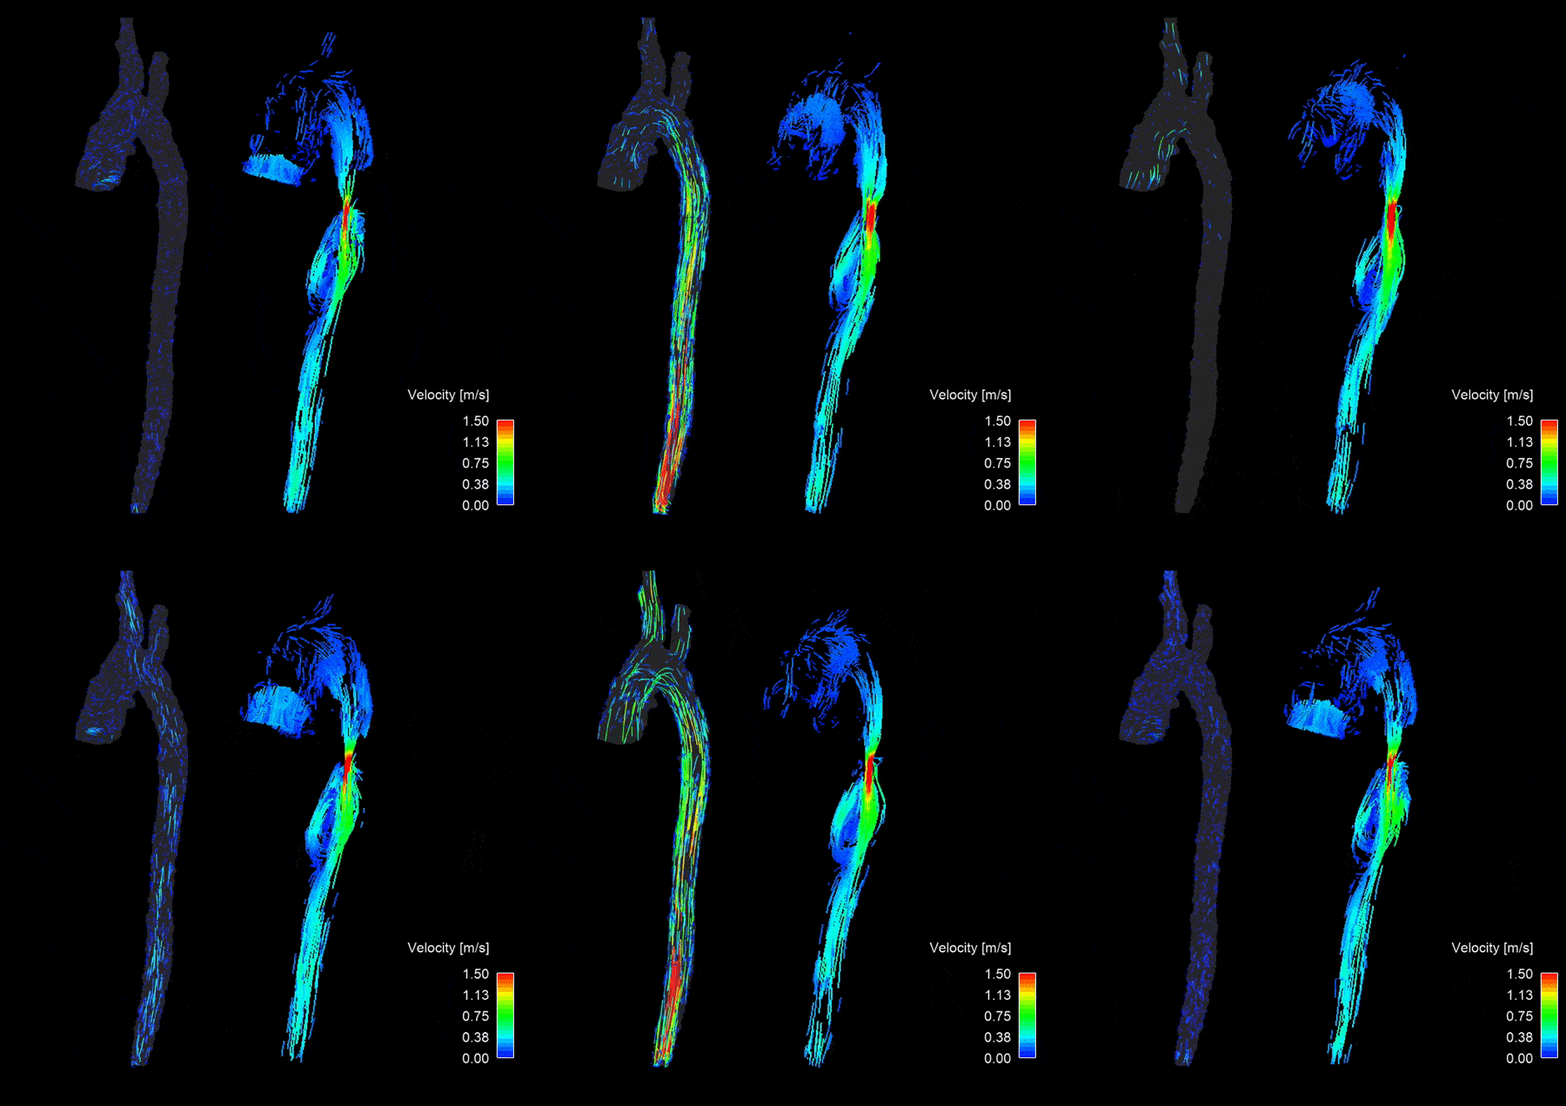
At the 6-week timepoint, no difference was observed between any groups in flow or velocity at the ascending aorta, pre-coarcted aorta, post-coarcted aorta or diaphragm. At 12 weeks, this persists, however at 20 weeks ascending aortic flow is higher in the CS group (CS v. Sham p = 0.002, CS v. CC p = 0.02). Also at 20 weeks, flow is higher in the IMAs in both the CC and CS animals (p = 0.0002, p = 0.006), indicating collateralization (Figure 2). At the 12-week timepoint, an increase in velocity in the post-coarcted aorta of the CS group (CS v. Sham p = 0.04) was observed, that persists at the 20-week timepoint to include the CC group (CS v. Sham p = 0.005, CS v. CC p = 0.002). Pulse wave velocity (PWV) was calculated from 4D Flow MRI data using previously developed algorithms and Figure 3 shows findings from a representative healthy sham.13 All coarcted animals, including CS and CC, exhibited helical flow and a post-stenotic dilatation distal to the area of coarctation as shown by pathlines (Figure 4).Discussion
Using 4D flow MRI in an animal model, we are able to both visualize and quantify the changes induced by the pathology. There were no major differences in flow that can be attributed to this pathology alone. The velocity changes may contain artifact from the stent, however, it may also demonstrate that early intervention does not change the post-coarctation dilatation and velocity changes we observe in control animals. The large volumetric coverage of radial 4D Flow MRI allowed the visualization and quantification of significant collateral flow via the IMAs developed by the coarcted animals, which was not reversed by stenting. Either this collateralization process has already begun prior to the 6-week stenting timepoint or the intervention is not powerful enough to prevent this remodeling. This study uses an animal model of COA, therefore is limited by any variability in that model. The COA models have varying degrees and locations of coarctations in the thoracic aorta and were performed in animals without any markers of cardiovascular disease. The sample size is small, and the experimental time course is short, not fully accounting for the effects of chronic hypertension on somatic growth or growth in between time points.Conclusion
Early intervention did not significantly alter flow, velocity or collateralization in animals treated for aortic coarctation. However, 4D flow MRI was a useful tool for studying both anatomical and functional changes in this model.Acknowledgements
GE Healthcare supports the University of Wisconsin.References
1 Ernst, S. et al. [Current diagnosis and therapy of non-occlusive mesenteric ischemia]. Rofo 175, 515-523, doi:10.1055/s-2003-38441 (2003).
2 Dias, M. Q., Barros, A., Leite-Moreira, A. & Miranda, J. O. Risk Factors for Recoarctation and Mortality in Infants Submitted to Aortic Coarctation Repair: A Systematic Review. Pediatr Cardiol 41, 561-575, doi:10.1007/s00246-020-02319-w (2020).
3 Rinnstrom, D. et al. Hypertension in adults with repaired coarctation of the aorta. Am Heart J 181, 10-15, doi:10.1016/j.ahj.2016.07.012 (2016).
4 Seri, A. et al. Outcomes of Heart Failure Hospitalizations in Adult Patients With Coarctation of Aorta: Report From National Inpatient Sample. Curr Probl Cardiol 48, 101888, doi:10.1016/j.cpcardiol.2023.101888 (2023).
5 Reifenstein, G. H., Levine, S. A. & Gross, R. E. Coarctation of the aorta; a review of 104 autopsied cases of the adult type, 2 years of age or older. Am Heart J 33, 146-168, doi:10.1016/0002-8703(47)90002-1 (1947).
6 Alkashkari, W., Albugami, S. & Hijazi, Z. M. Management of Coarctation of The Aorta in Adult Patients: State of The Art. Korean Circ J 49, 298-313, doi:10.4070/kcj.2018.0433 (2019).
7 Pickard, S. S. et al. A National Population-based Study of Adults With Coronary Artery Disease and Coarctation of the Aorta. Am J Cardiol 122, 2120-2124, doi:10.1016/j.amjcard.2018.08.051 (2018).
8 Pickard, S. S. et al. Stroke in Adults With Coarctation of the Aorta: A National Population-Based Study. J Am Heart Assoc 7, doi:10.1161/JAHA.118.009072 (2018).
9 Canniffe, C., Ou, P., Walsh, K., Bonnet, D. & Celermajer, D. Hypertension after repair of aortic coarctation--a systematic review. Int J Cardiol 167, 2456-2461, doi:10.1016/j.ijcard.2012.09.084 (2013).
10 Gu, T. et al. PC VIPR: a high-speed 3D phase-contrast method for flow quantification and high-resolution angiography. AJNR Am J Neuroradiol 26, 743-749 (2005).
11 Hope, M. D. et al. Clinical evaluation of aortic coarctation with 4D flow MR imaging. J Magn Reson Imaging 31, 711-718, doi:10.1002/jmri.22083 (2010).
12 Schafer, M. et al. Impact of different coarctation therapies on aortic stiffness: phase-contrast MRI study. Int J Cardiovasc Imaging 34, 1459-1469, doi:10.1007/s10554-018-1357-6 (2018).
13 Wentland, A. L., Grist, T. M. & Wieben, O. Review of MRI-based measurements of pulse wave velocity: a biomarker of arterial stiffness. Cardiovasc Diagn Ther 4, 193-206, doi:10.3978/j.issn.2223-3652.2014.03.04 (2014).
Figures