3399
Anatomy of neo-aorta can cause abnormal flow patterns1Department of Congenital Heart Disease and Pediatric Cardiology, University Hospital Schleswig-Holstein, Kiel, Germany, 2Department of Congenital Heart Disease and Pediatric Cardiology, University Hospital Schleswig-Holstein, Campus Kiel, Kiel, Germany, 3Dept. of Cardiovascular Engineering Institute of Applied Medical Engineering, Institute of Applied Medical Engineering, RWTH Aachen University, Aachen, Germany, 4Faculty of Mechanical Engineering, University of Applied Sciences Kiel, Kiel, Germany
Synopsis
Keywords: Flow, Surgery, Congenital heart disease
Motivation: The descending aorta (DAo) in patients with hypoplastic left heart syndrome (HLHS) after Norwood procedure is frequently enlarged although this region is not subject to surgical procedures.
Goal(s): The aim of this study is to investigate whether the aortic anatomy can cause abnormal flow patterns which are related to vascular alterations.
Approach: Based on anatomic models and flow boundaries from 4D flow MRI, we studied fluid-dynamics using CFD simulations.
Results: We found increased vorticity and wall-shear stress in the HLHS descending aorta. Increased wall shear stress has been associated with the development of dilation and may explain vascular alterations in the descending aorta.
Impact: This study gives motivation for further investigations and may ultimately lead to future Norwood procedure modifications.
Background
The descending aorta (DAo) in patients with hypoplastic left heart syndrome (HLHS) after Norwood procedure is frequently dilated and exhibits increased stiffness [1], a region which was not subject to surgical procedures. A recent study indicated that patients with DAo dilation had caliber changes of more than 40% in the aortic arch and significantly increased vorticity in the DAo, [2]. Vorticity was used to quantify rotational flow patterns. The aim of the present study was to investigate whether the abnormal shape of the aortic arch may have a causative influence on increased vorticity and increased wall shear stress and thus may promote the development of dilation in the DAo.Methods
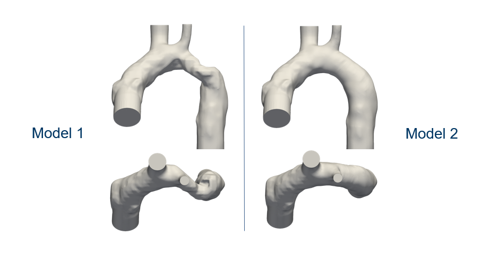
Neo-aortic anatomy and velocity boundary conditions were extracted from 4DFlow MRI of a HLHS patient (female, 2 yrs., 1 year after TCPC completion). Two watertight surface models were prepared from phase-contrast angiography using the open-source 3D computer graphics software tool blender (version 3.4.1). The first model corresponds to the original neo-aortic anatomy, while the second model was modified in the aortic arch to correct for kinking and caliber changes in order to obtain a smooth aortic arch. Other regions remained unchanged. CFD simulations were based on the two mesh models. CFD simulations were carried out with the open-source CFD software OpenFOAM-v2206 using the pimpleFoam solver. The Casson transport model was used to represent the shear thinning (non-Newtonian) rheology of blood [3]. Flow distal to the aortic valve and flow into to the head vessel branches from 4DFlow MRI were boundary conditions to the simulations. In order to avoid start-up effects, two cardiac cycles were simulated and the second cycle was then further evaluated. Acquired and reconstructed temporal resolution of MRI flow boundaries of 35 ms was interpolated for transient CFD simulations to operate with a temporal resolution of 0.1 ms. Each CFD setting ran for about 9 hours on a 12-core Intel Xeon CPU ES-2677, 3.20GHz processor with hyperthreading disabled. Fluid-dynamics results were visualized with pathlines and evaluated quantitatively. For quantitative comparison of the two models, the fluid-dynamics quantities average vorticity and wall shear stress were evaluated in a 5 cm long section of the Dao, referred to as the region of interest. Validation of CFD results in the region of interest were performed by comparison with MRI measurements. For both, CFD and MRI data, fluid-dynamics quantification was performed with the image processing framework (MeVis Medical Solutions AG, Bremen, Germany, version 3.1.1) as described previously [4]. For this purpose, the CFD results of model 1 were restructured using the Resample With Dataset filter to convert the cell data from the original unstructured mesh to the temporal and spatial arrangement of the reconstructed 4DFlow MRI data. The CFD data set thus obtained was treated in exactly the same way as the 4DFlow MRI data set within the fluid-dynamics quantification.Results
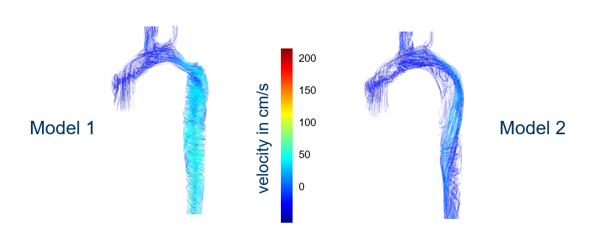
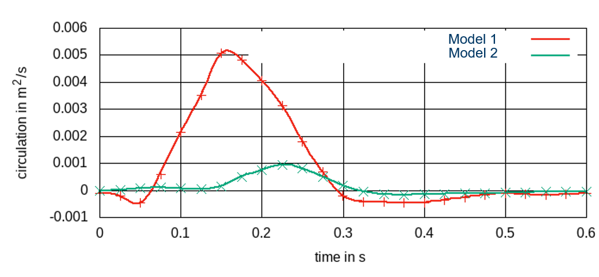
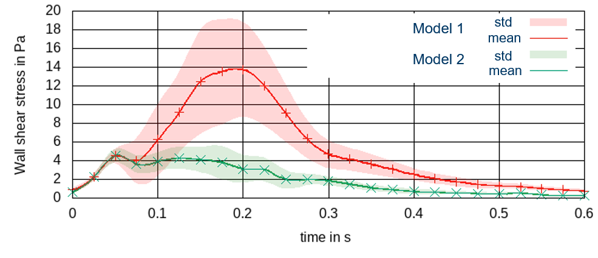
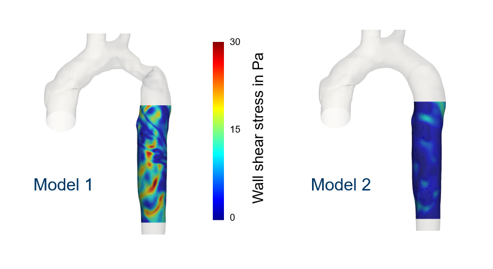
The two non-cartesian, hexahedral meshes used for CFD simulations had 2.5 million cells and covered the aorta between neo-aortic valve and DAo at the diaphragm level, Figure 1. Visualization of pathlines revealed strong rotational velocities in the first (original) model in agreement with MRI results and in contrast to the second (smooth) model, Figure 2. In the first model, vorticity reached a maximum of 50 cm2/s, whereas only up to 10 cm2/s was reached in the second (smooth) aortic model, Figure 3. Average wall-shear-stress was up to 14 Pa in the first model and up to 5 Pa in the second model (Figs. 4, 5). Time-resolved CFD results for on vorticity averaged over the region of interest for model 1 differed from corresponding 4DFlow MRI measurements by up to 15 cm2/s, whereas the difference at the reported maximum values was 10 cm2/s.Conclusion
The abnormal anatomy of the neo-aortic arch was associated with increased vorticity and wall shear stress compared to a smooth anatomy. Increased wall shear stress has been associated with the development of dilation [5]. This study demonstrated that the abnormal shape of the neo-aortic arch can directly cause the observed rotational flow patterns.Acknowledgements
No acknowledgement found.References
1. Voges I, Jerosch-Herold M, Wegner P, Hart C, Gabbert D, Al Bulushi A, Fischer G, Andrade AC, Pham HM, Kristo I, Kramer HH, Rickers C. Frequent Dilatation of the Descending Aorta in Children With Hypoplastic Left Heart Syndrome Relates to Decreased Aortic Arch Elasticity. J Am Heart Assoc. 2015 Oct 5;4(10):e002107.
2. Voges I, Scheewe J, Attmann T, Uebing A, Oechtering T, Gabbert D. Abnormal aortic arch shape and vortical flow patterns are associated with descending aortic dilatation in patients with hypoplastic left heart syndrome. Int J Cardiol. 2021 Jan 15;323:65-67.
3. Casson, N. (1959) A Flow Equation for Pigment-Oil Suspensions of the Printing Ink Type. In: Mill, C.C., Ed., Rheology of Disperse Systems, Pergamon Press, Oxford, 84-104.
4. Gabbert DD, Kheradvar A, Jerosch-Herold M, Oechtering TH, Uebing AS, Kramer HH, Voges I, Rickers C. MRI-based comprehensive analysis of vascular anatomy and hemodynamics. Cardiovasc Diagn Ther. 2021 Dec;11(6):1367-1378.
5. Guala A, Dux-Santoy L, Teixido-Tura G, Ruiz-Muñoz A, Galian-Gay L, Servato ML, Valente F, Gutiérrez L, González-Alujas T, Johnson KM, Wieben O, Casas-Masnou G, Sao Avilés A, Fernandez-Galera R, Ferreira-Gonzalez I, Evangelista A, Rodríguez-Palomares JF. Wall Shear Stress Predicts Aortic Dilation in Patients With Bicuspid Aortic Valve. JACC Cardiovasc Imaging. 2022 Jan;15(1):46-56.
Figures