3398
Myocardial Pre-contrast T1 at 3T Detects Progressive Changes in Duchenne Muscular Dystrophy1Radiology, University of Pennsylvania, Philadelphia, PA, United States, 2Radiological Sciences, University of California, Los Angeles, Los Angeles, CA, United States, 3Cardiology, Childrens Hospital of Orange County, Orange, CA, United States, 4Pediatric Cardiology, University of California, Los Angeles, Los Angeles, CA, United States, 5Radiolgy, Stanford University, Palo Alto, CA, United States
Synopsis
Keywords: Cardiovascular, Cardiomyopathy
Motivation: Duchenne muscular dystrophy (DMD) leads to pediatric cardiomyopathy. Pre-contrast T1 in DMD identifies myocardial remodeling, but it remains unclear if T1-Mapping biomarkers can detect longitudinal changes in DMD.
Goal(s): The objective was to characterize progressive myocardial pre-contrast T1 changes in DMD at 3T.
Approach: Boys with DMD and healthy controls underwent a 3T CMR exam that included standard functional and pre-contrast T1 mapping sequences. Boys with DMD were examined at two points (18 months apart).
Results: Pre-contrast T1 was capable of detecting progressive changes in boys with DMD 18 months post baseline while functional metrics like LVEF did not.
Impact: T1 Mapping biomarkers can detect disease progression in DMD. T1 Mapping biomarkers, in combination with biomarkers of function have the potential to track patient-specific changes.
Introduction
Duchenne muscular dystrophy (DMD) is a fatal X-linked genetic disorder characterized by progressive muscle weakness and pediatric onset cardiomyopathy, ultimately leading to heart failure and death in the second decade of life. Conventional late gadolinium enhancement (LGE) imaging is the current gold standard for detecting myocardial tissue remodeling (i.e. fibrosis), but it is often a late finding (mean onset observed at 15.2±5.1 years). Global pre-contrast T1 mapping biomarkers of myocardial remodeling have shown promise in distinguishing between healthy controls and boys with DMD. Additionally, regional myocardial T1 differences between the septal and lateral mid-ventricular LV wall suggest myocardial heterogeneity in the DMD heart. However, it remains unclear if pre-contrast T1-Mapping biomarkers are prognostic and capable of detecting longitudinal changes in DMD. The objective was to characterize progressive myocardial pre-contrast T1 changes in DMD at 3T.Methods
Imaging: Boys with DMD (N=15, 12.5±4.8 years at Scan-1) and healthy boys (N=20, 12.5±2.5 years) were prospectively enrolled in an IRB-approved study for a cardiac MRI (CMR) exam at 3T (Siemens Skyra) after providing informed consent. Boys in the DMD group (N=15,14.4±3.9 years at Scan-2) had a follow-up exam 18.9±7.2mo later for progressive changes in T1. The CMR exam included standard functional imaging (i.e., bSSPF CINE and LGE imaging) and motion-corrected mid-ventricular pre-contrast T1 mapping with a MOLLI 5(3)3 sequence. Typical pre-contrast T1 parameters were: matrix size=192x132mm2, voxel size=2x2x8mm3, FA=20°, BW 1085 Hz/Px, initial TI of 100ms with 80ms increments, TE/TR=1.01ms/2.44ms and a 268.3ms temporal footprint.Post-processsing: T1 maps were generated and a region of interest encompassing the left ventricular (LV) myocardium was manually segmented, extracted, and analyzed for its corresponding global and regional T1 (MATLAB, MathWorks, FIG.1). Progressive T1 changes were evaluated using within-subject inter-quartile range (IQR) and relative regional measurements (ΔT1= Lateral - Septal). Group-wise comparisons were performed using a Wilcoxon-rank sum test. Data is reported as median and IQR.
Results
At Scan-1, boys with DMD demonstrated the following significant functional differences: reduced LVEDVi [81.3(21.7) v. 87.7(17.4) ml/m2; p=0.05], reduced LVMi [35.9(8.7) v. 38.9(15.1) g/m2; p=0.04] and reduced LVEF [51.4(11.2) v. 56.9(5.75) %; p=0.02] compared to healthy controls. At Scan-2, the LVEDVi and LVESVi was significantly reduced when compared to controls (FIG.2). No functional metrics demonstrated progressive changes between the two DMD groups (i.e., Scan-1 v. Scan-2). At Scan-1, lateral T1 [1354(122) v 1287(27) ms; p=0.02] and the within-subject lateral T1 IQR [85.4(39.4) v. 67.2(27.0) ms; p=0.02] were significantly elevated compared to healthy controls; the septal T1 was unchanged [1302 (72.7) ms v 1313 (68) ms; p=0.96]. At scan-2, lateral T1[1307(97.1) v. 1287(56.2) ms; p=0.03] and within-subject septal T1[108(33.6) v. 63.4(31.2) ms; p<0.01] were significantly increased from control, (FIG. 3). Between Scan-1 and Scan-2, ΔT1 reduced significantly in boys with DMD FIG. 3) .Discussion
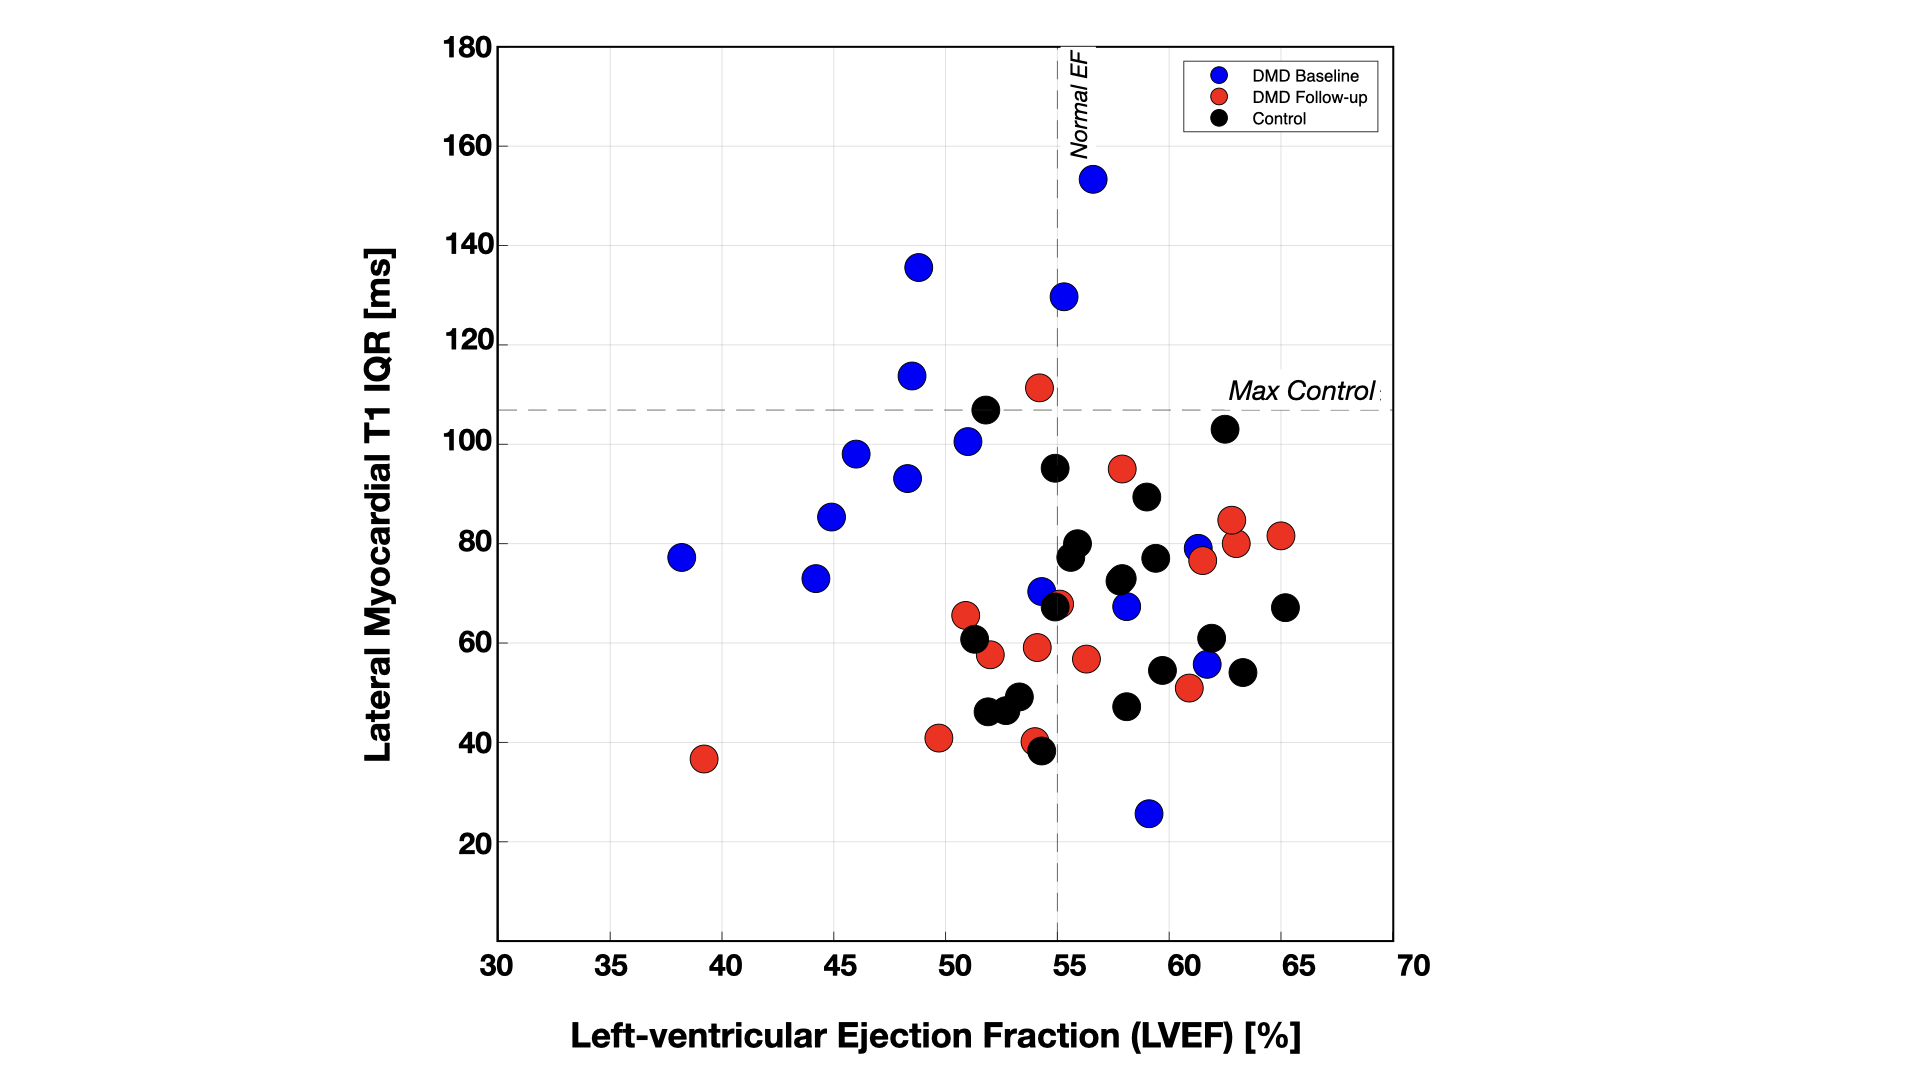
Pre-contrast T1 demonstrated utility in detecting progressive changes in boys with DMD at 18 months post Scan-1 while conventional ejection fraction did not. ΔT1 was capable of distinguishing between healthy controls and DMD at both stages (FIG. 3). Thus, a well-established reference age- and sex-matched control is useful in characterizing DMD disease progression in a specific boy with DMD. FIG. 4 illustrates a clear separation between Scan-1 and Scan-2 and further suggests that at the initial scan, boys with DMD exhibit elevated within-subject lateral myocardial T1 with decreasing EF. By Scan-2, FIG. 4 suggests that DMD boys demonstrate a slight improvement in EF and reduced within-subject myocardial lateral wall T1. The septal wall involvement appears to be the driver of the reduction in lateral wall T1variation (FIG. 3). Subsequent scans may indicate that the improvement in EF is dictated by the initiation of heart failure medication. Ultimately, T1 mapping shows to be a reliable technique for monitoring remodeling in DMD. Future aims of this study will include a broad assessments of medication impact on T1 measurements, along with adding more subjects.Acknowledgements
Funding NIH R01 HL131975 to DBE.
Funding NSF DGE 1650604 to NGM.
References
[1] Ryder S et al., OJRD 2017
[2] D’Amario D et al.,Heart 2017
[3] Florian A et al., Eur Heart J Cardiovasc Imaging 2014.
[4] Mavrogeni S et al., Eur J Clin Invest 2017.
[5] Soslow J et al., JCMR 2016.
[6] Soslow J et al., Pediatr Cardiol. 2015.
[7] Jerosch-Herold M et al., Topics in MRI 2014.
[8] Messroghli DR et al., MRM 2004.
[9] Koo T et al., JCM 2015.
[10] Maforo NG et al., JCMR 2020.
Figures
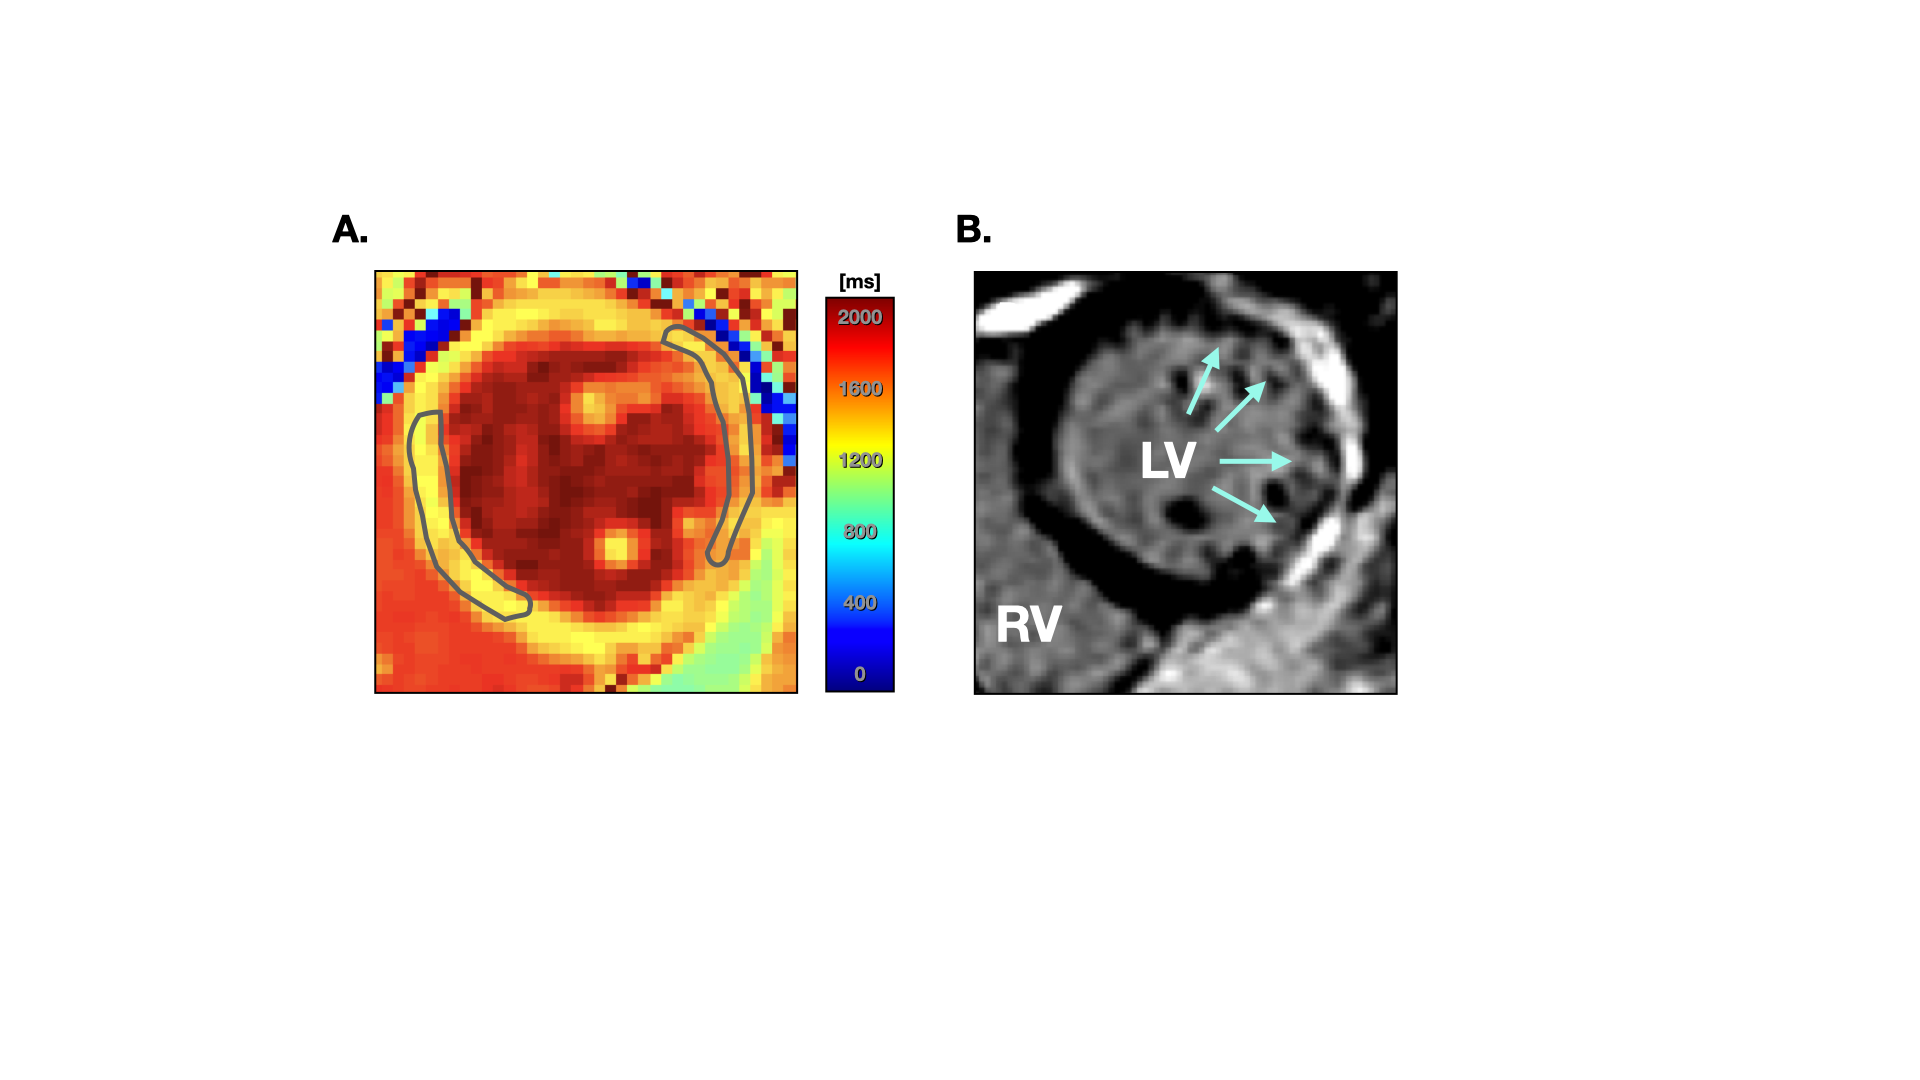
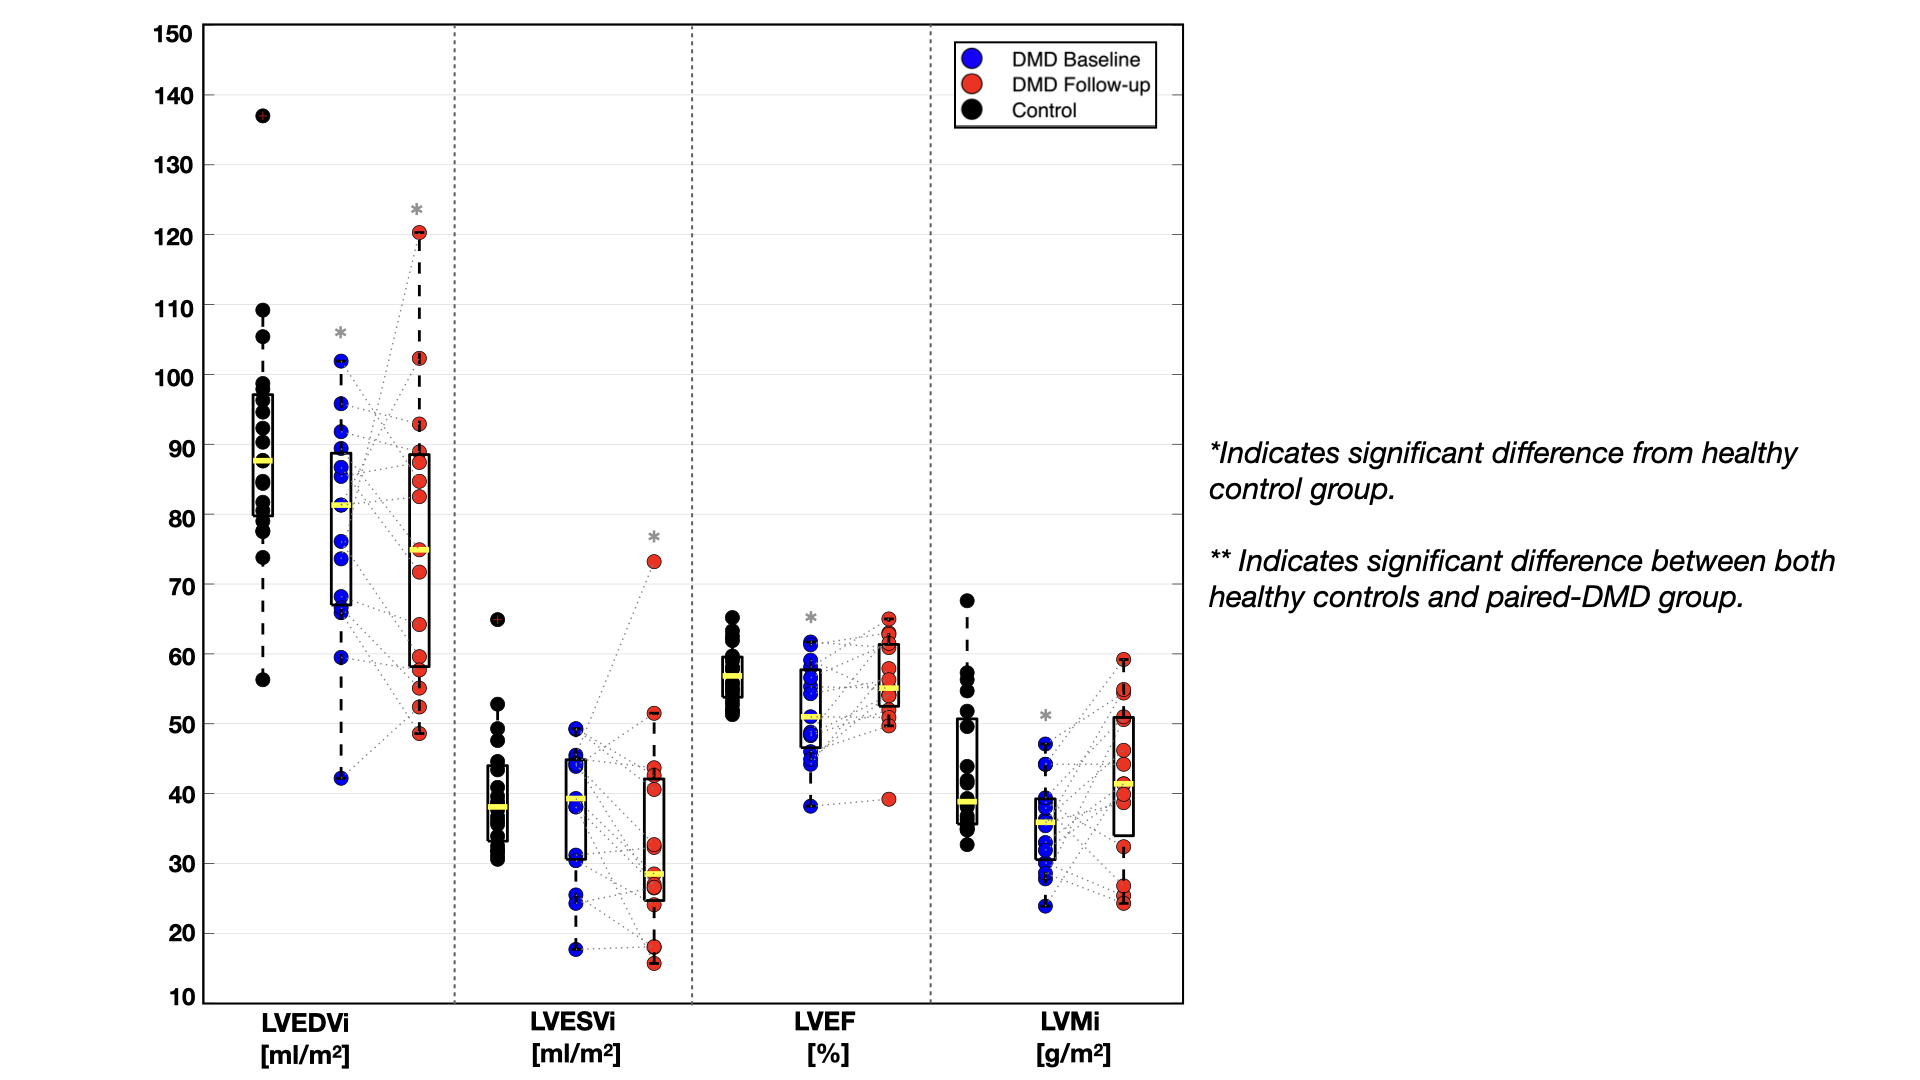
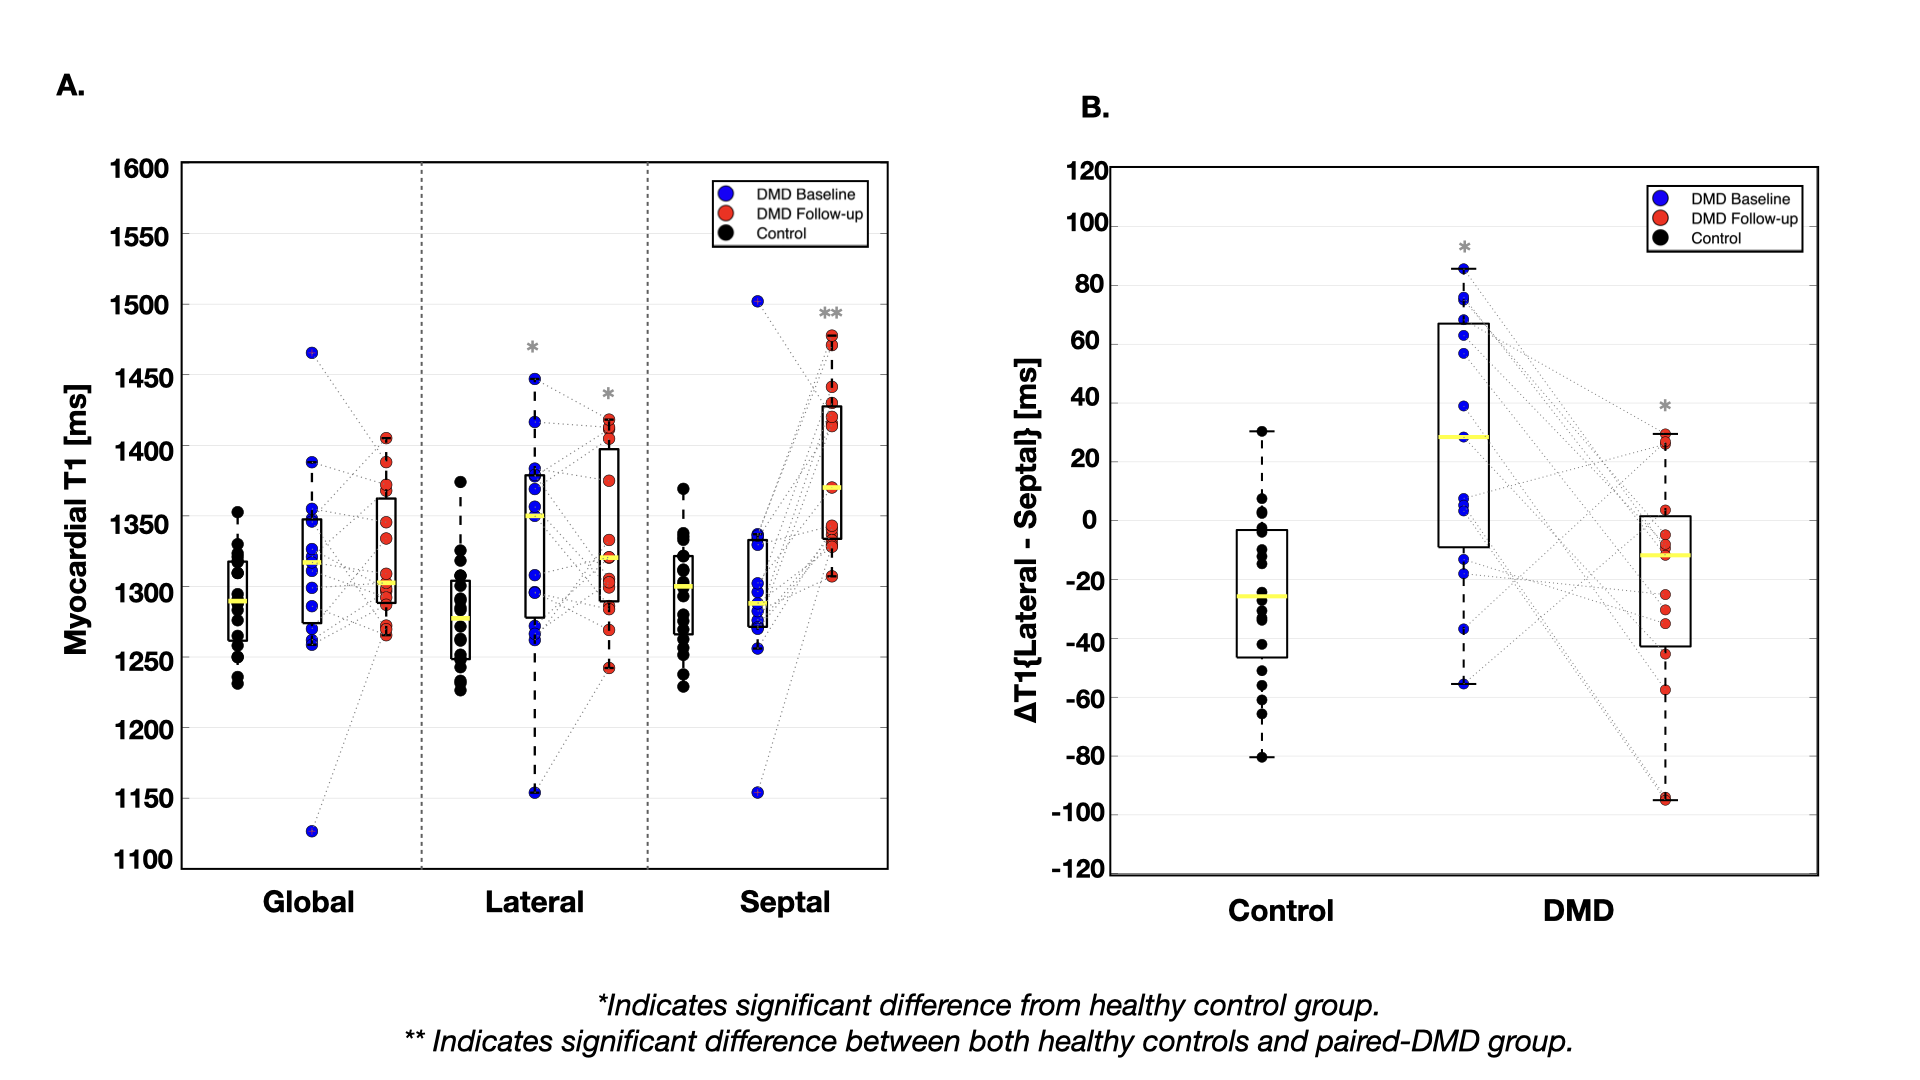
FIG. 3. Box plots of regional pre-contrast T1 values in healthy controls and boys with DMD at the baseline (Scan-1) and follow-up (Scan-2) timepoints. Metrics of pre-contrast T1 are capable of detecting myocardial changes 18 months post baseline scan, demonstrating promise for prognostic power.