3394
Slice-to-Volume 4D flow MRI in pediatric patients with congenital heart disease1Translational Medicine, The Hospital for Sick Children, Toronto, ON, Canada, 2Medical Biophysics, University of Toronto, Toronto, ON, Canada, 3Department of Diagnostic Imaging, The Hospital for Sick Children, Toronto, ON, Canada
Synopsis
Keywords: Cardiovascular, Pediatric, Multidimensional Flow Imaging
Motivation: In the absence of injected contrast agent, the quality of magnitude data from traditional 4D flow techniques can be poor, making structural visualization and blood vessel segmentation challenging.
Goal(s): Slice-to-volume 4D flow data has inherently high signal in blood vessels owing to in-flow effects. We apply slice-to-volume 4D flow in pediatric patients and evaluate its accuracy.
Approach: 7 pediatric patients were imaged with slice-to-volume 4D flow. Dynamic magnitude reconstructions and angiograms were assessed. The flow accuracy was evaluated using traditional 2D phase contrast MRI.
Results: Slice-to-volume 4D flow provided accurate flow quantification along with high quality anatomical and angiographic visualisations without contrast injection.
Impact: Volumetric flow imaging was performed using slice-to-volume 4D flow in pediatric patients. The technique provided accurate flow quantification along with high quality anatomical and angiographic visualisations without contrast injection.
Introduction
Volumetric (4D) flow assessment is important for the evaluation of pediatric congenital heart disease (CHD) and its response to therapy. Along with flow measurements, structural information is crucial to determine the location of cardiovascular abnormalities and assess their contribution to complex flows in CHD. Traditional 4D flow techniques typically rely on conventional or blood pool contrast agents to improve vessel conspicuity for segmentation and to improve signal-to-noise from blood for flow quantification. In the absence of injected contrast agent, however, the quality of magnitude data can be poor, making structural visualization and blood vessel segmentation challenging [1].An alternative 4D flow approach has recently been demonstrated that overcomes this limitation, using 2D multi-slice phase contrast (PC) acquisitions that are combined via slice-to-volume reconstruction (SVR). SVR 4D flow data has naturally high signal in blood vessels owing to slice in-flow effects, which makes vessels more conspicuous [2].
In this work, SVR 4D flow MRI was performed in pediatric patients with CHD. We evaluated the accuracy of these 4D flow data by comparison with traditional 2D Cartesian PCMRI and analyze the resulting dynamic anatomical and angiographic reconstructions.
Methods
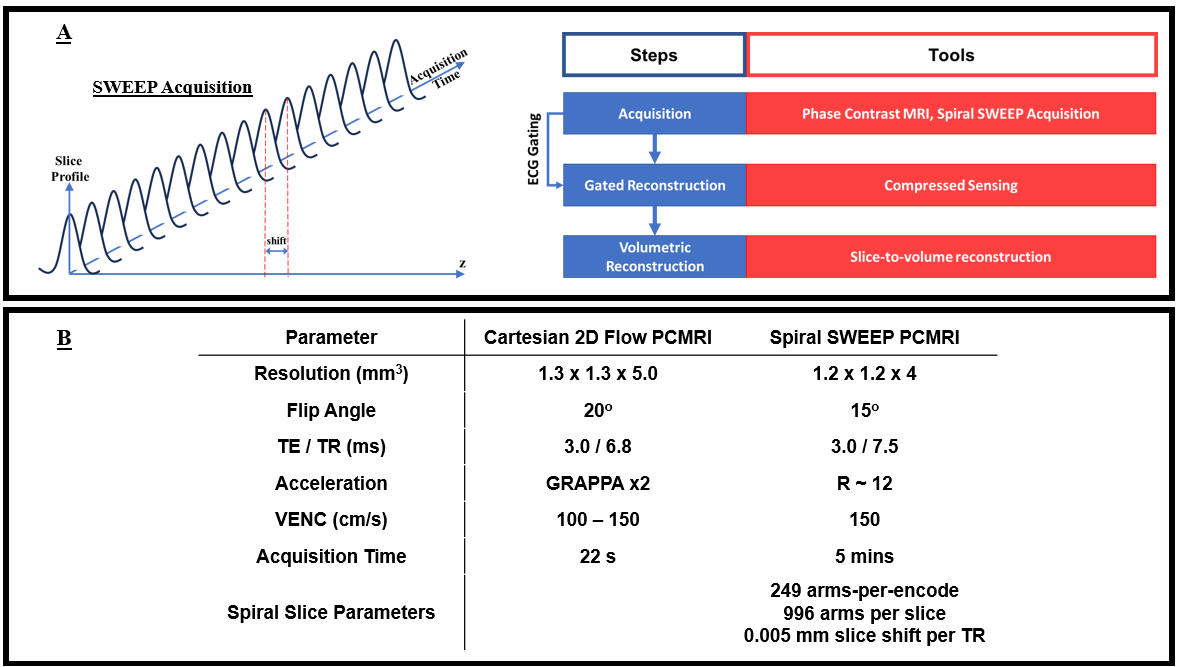
7 pediatric patients (8-17 years old) with CHD (n = 3 Tetralogy of Fallot, 1 pulmonary valve stenosis, 1 single ventricle, 1 Ebstein’s anomaly, and 1 supravalvular aortic stenosis) were scanned on a clinical 1.5T system (AvantoFIT, Siemens Healthineers) with informed consent. All scans were ECG gated and performed under free-breathing conditions.SVR 4D flow datasets were computed from 2D multi-slice PC data, which was obtained using a spiral trajectory with a continuously moving slice (see Figure 1A). Hereafter referred to as spiral SWEEP PCMRI, this approach included a continuous spatial shift in the slice direction each TR (by a small fraction of the slice thickness) [3]. This allowed retrospective reconstruction of 2D slices at arbitrary positions from sets of consecutively acquired spiral arms, which could then be combined into a volume using SVR. The advantage of the SWEEP approach is the dense spatial sampling in the slice direction, which facilitates retrospective volumetric reconstructions with high, isotropic resolution. Imaging parameters for 2D Cartesian and SWEEP PCMRI are summarized in Figure 1B.
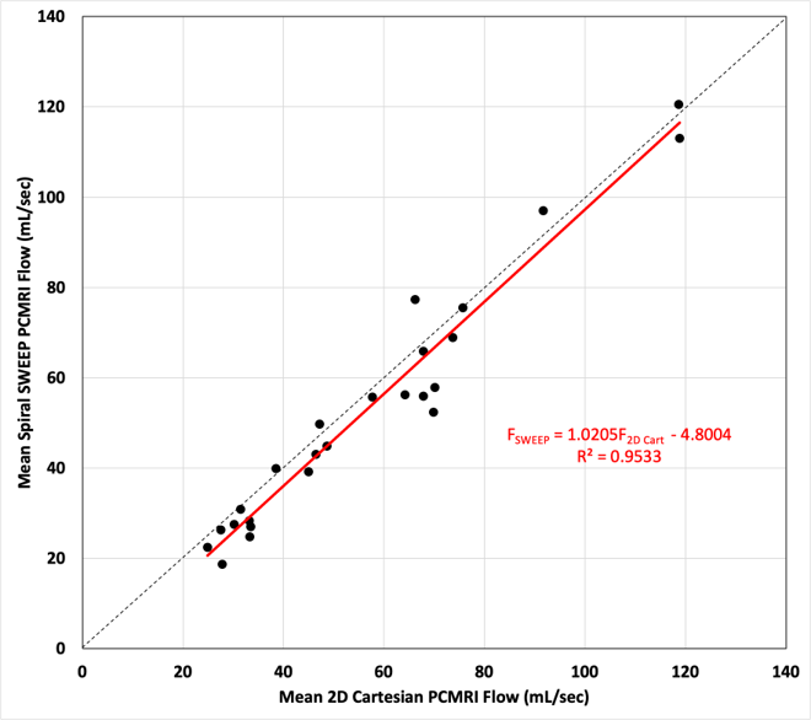
Spiral SWEEP PCMRI data were reconstructed into multislice velocity sensitive CINEs (with compressed sensing) by combining sets of 996 spiral arms, with 332 arms shared between adjacent slices. The CINEs were temporally synchronised to each other using the ECG signal and were then combined into an isotropic flow sensitive volume via SVR. Volumetric flows were assessed using a prototype software (4D Flow v2.4, Siemens [5]). The cardiac anatomy and surrounding great vessels were segmented and seeded with emitters to generate particle traces mapping the blood flow in a representative cardiac cycle. Dynamic angiograms (product of magnitude and speed) and magnitude (3D rendering) volumes were visually analyzed to characterize the vasculature. Mean flows in the great vessels (descending aorta, ascending aorta, superior vena cava, inferior vena cava, and main pulmonary artery) derived from SWEEP PCMRI volumetric reconstructions and 2D Cartesian PCMRI were compared through linear regression.
Results and Discussion
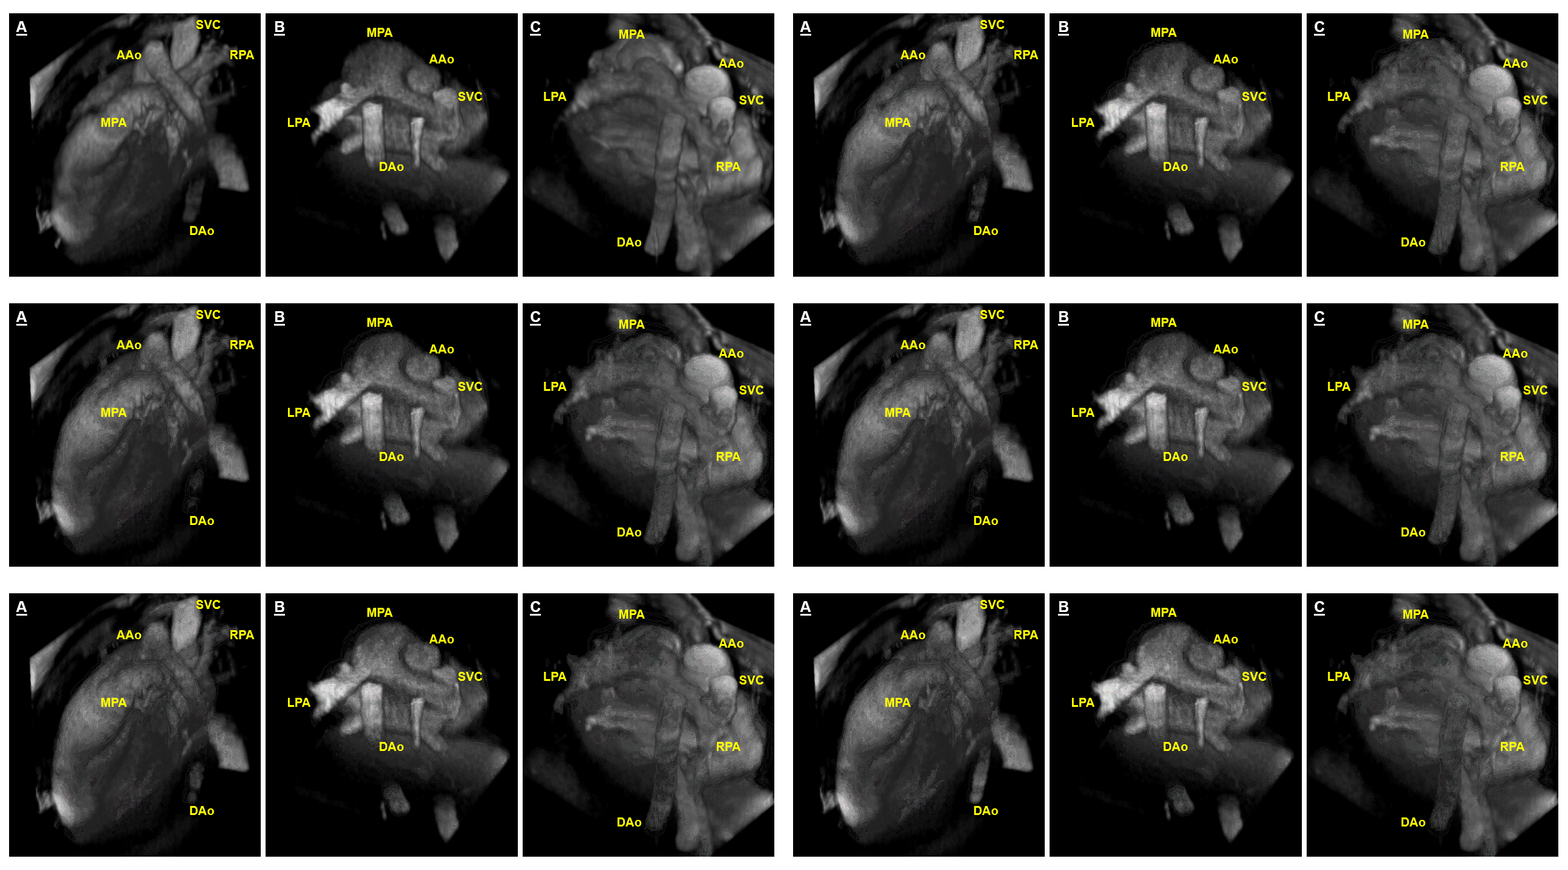
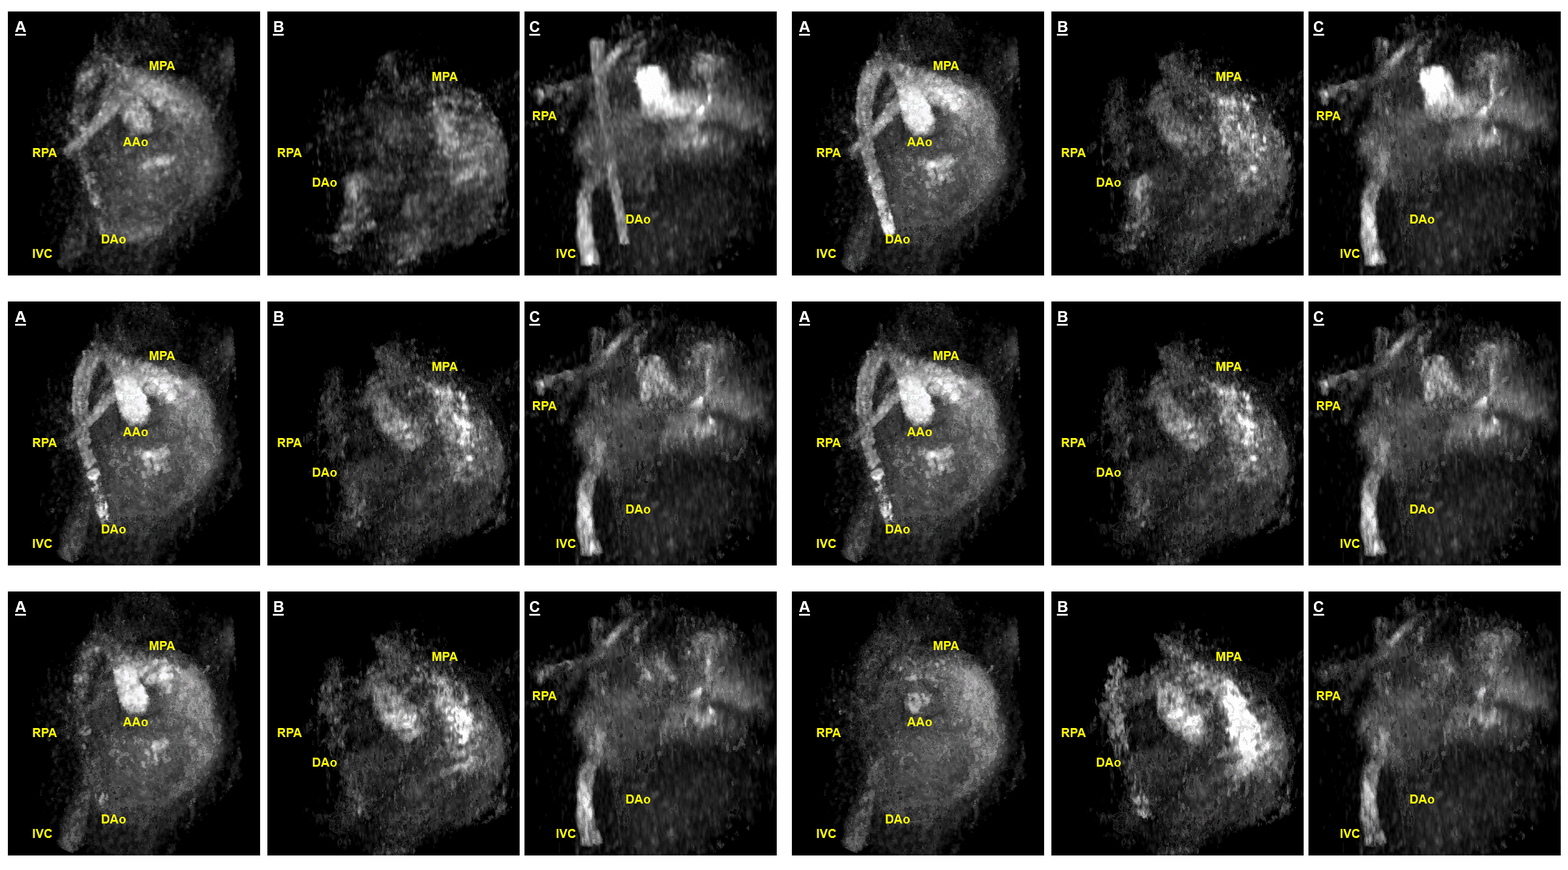
Figure 2 depicts good agreement between the mean flows from 2D Cartesian PCMRI and spiral SWEEP PCMRI (FSWEEP = 1.02∙F2D Cart - 4.8, R² = 0.95). Differences between the two techniques can be explained by slight discrepancies in measurement locations and poor signal in some regions in the SWEEP PCMRI data (arising from localized low signal-to-noise ratio from inactive coils or abrupt random motion).Figure 3 shows dynamic volumetric magnitude images from 3 patients. These images depict the cardiac anatomy and surrounding great vessels with good conspicuity. Figure 4 shows dynamic angiograms from 3 patients. Note the conspicuity of the great vessels in these images, thanks to the naturally bright signal from blood which flows into the imaging slice.
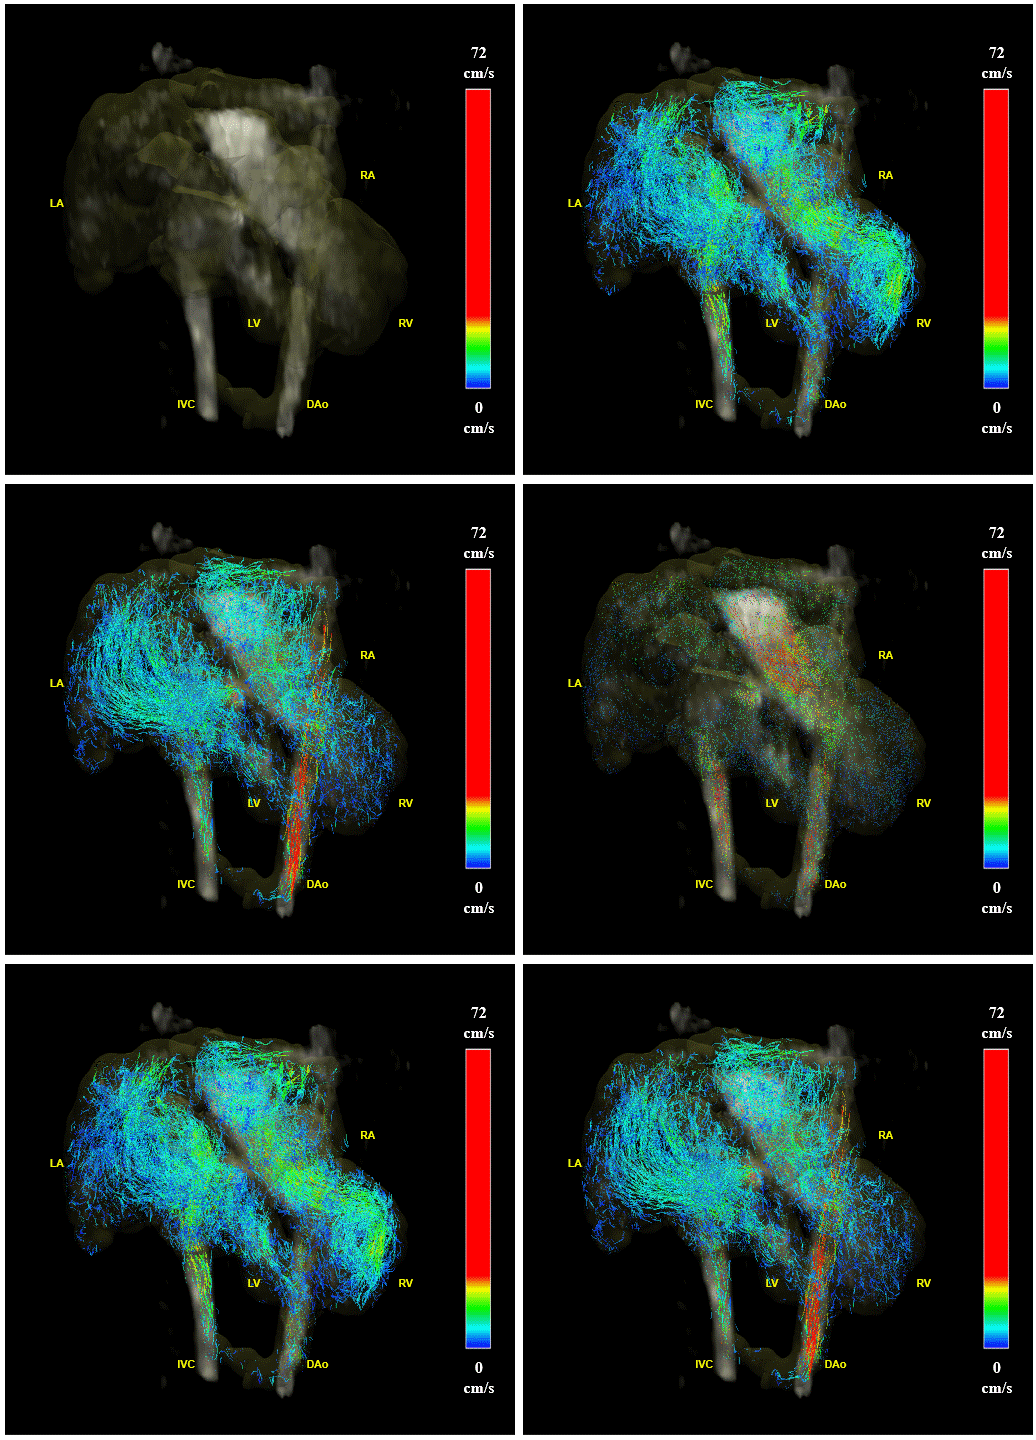
Figure 5 depicts particle traces tracking blood in the segmented intracardiac volume over a cardiac cycle in one patient. Blood can be seen entering heart through the inferior vena cava during diastole and feeding into the right atrium and ventricle. Vortical formations are apparent in the left atrium before entering the left ventricle. Ejection of blood from the ventricles is visible during systole.
Conclusion
Volumetric flow imaging was performed using spiral SWEEP PCMRI in pediatric patients with CHD. The technique provided accurate flow quantification along with high quality anatomical and angiographic visualisations without contrast injection.Acknowledgements
No acknowledgement found.References
[1] K. Mukai, N. S. Burris, V. S. Mahadevan, E. D. Foster, K. G. Ordovas, and M. D. Hope, “4D flow image quality with blood pool contrast: a comparison of gadofosveset trisodium and ferumoxytol,” Int J Cardiovasc Imaging, vol. 34, no. 2, pp. 273–279, Feb. 2018.
[2] D. S. Goolaub, J. Xu, E. M. Schrauben, D. Marini, J. C. Kingdom, J. G. Sled, M. Seed, and C. K. Macgowan, “Volumetric Fetal Flow Imaging with Magnetic Resonance Imaging,” IEEE Transactions on Medical Imaging, pp. 1–1, 2022.
[3] L. H. Jackson, A. N. Price, J. Hutter, A. Ho, T. A. Roberts, P. J. Slator, J. R. Clough, M. Deprez, L. McCabe, S. J. Malik, L. Chappell, M. A. Rutherford, and J. V. Hajnal, “Respiration resolved imaging with continuous stable state 2D acquisition using linear frequency SWEEP,” Magnetic Resonance in Medicine, vol. 82, no. 5, pp. 1631–1645, 2019.
[4] A. Uus, T. Zhang, L. H. Jackson, T. A. Roberts, M. A. Rutherford, J. V. Hajnal, and M. Deprez, “Deformable Slice-to-Volume Registration for Motion Correction of Fetal Body and Placenta MRI,” IEEE Transactions on Medical Imaging, vol. 39, no. 9, pp. 2750–2759, Sep. 2020.
[5] M. A. Gulsun, M.-P. Jolly, J. Guehring, C. Guetter, A. Littmann, A. Greiser, M. Markl, and A. F. Stalder, “A Novel 4D Flow Tool for Comprehensive Blood Flow Analysis,” p. 1.
Figures