3386
RAMI: Radiomics Predictive Model of Myocardial Infarction and Microvascular Obstruction1Champalimaud Foundation, Lisbon, Portugal, 2Center of Marine Sciences (CCMAR), Faro, Portugal, 3School of Biomedical Engineering and Imaging Sciences, King's College London, London, United Kingdom
Synopsis
Keywords: Myocardium, Radiomics, Late Gadolinium Enhancement; Myocardial Infarction; Microvascular Obstruction; Random Forest;
Motivation: Late gadolinium Enhancement (LGE) is the method of choice for assessing myocardial infarction (MI) and viability, essential to guide revascularization decisions. LGE also shows no-reflow regions that occur when blood flow remains inadequate post-revascularization. Existing automatic segmentation methods identify regions of LGE uptake but ignore no-reflow regions.
Goal(s): Our goal is to provide a robust and automated solution for the detection of MI and no-reflow.
Approach: We propose two LGE-based radiomics models, RAMI and RAMI-NOR, to improve MI diagnosis and detect no-reflow, respectively.
Results: RAMI distinguishes normal and pathological cases accurately. RAMI-NOR shows potential in assessing MI with no-reflow but needs further refinement.
Impact: The proposed RAMI and RAMI-NOR methods extract radiomics features from LGE images to automatically detect infarcted and microvascular obstruction areas, essential for the diagnosis and treatment management of patients suffering from myocardial infarction.
Background
Late gadolinium Enhancement (LGE) has become the reference standard for assessing myocardial infarction (MI) and viability, which can be used to guide revascularization decisions.1-4 LGE can also predict functional recovery after revascularization therapy. In addition, dark no-reflow regions (or microvascular obstruction) can appear within LGE-enhanced regions, indicating that blood flow remains inadequate post-revascularization. These no-reflow regions have been associated with worse clinical outcomes.5 Segmentation and classification methods have been proposed to automatically detect scar tissue in LGE images. However, these mainly focus on regions of LGE uptake and do not address areas of no-reflow.6,7 Moreover, automated segmentation is challenging due to high variability across subjects, potential lack of contrast between myocardial scar tissue and adjacent blood pool, complex LGE-enhancement patterns, and poor image quality. Radiomics has become popular in medical imaging for automatic quantitative feature extraction,8.9 which can potentially help identify diseased tissues. The obtained features can describe shape, first-, second-, and higher-order statistics. Shape features reflect morphological characteristics (e.g., volume, maximum surface), first-order features describe intensity distributions (e.g., mean, standard deviation), second-order features provide texture information to measure the spatial arrangement of pixel intensities (e.g., gray-level co-occurrence matrix), and high-order features analyze the spatial relationships by applying filters or mathematical transforms (e.g., wavelet). Here, we propose two radiomics models based on LGE features to improve MI diagnosis and detect no-reflow.Methods
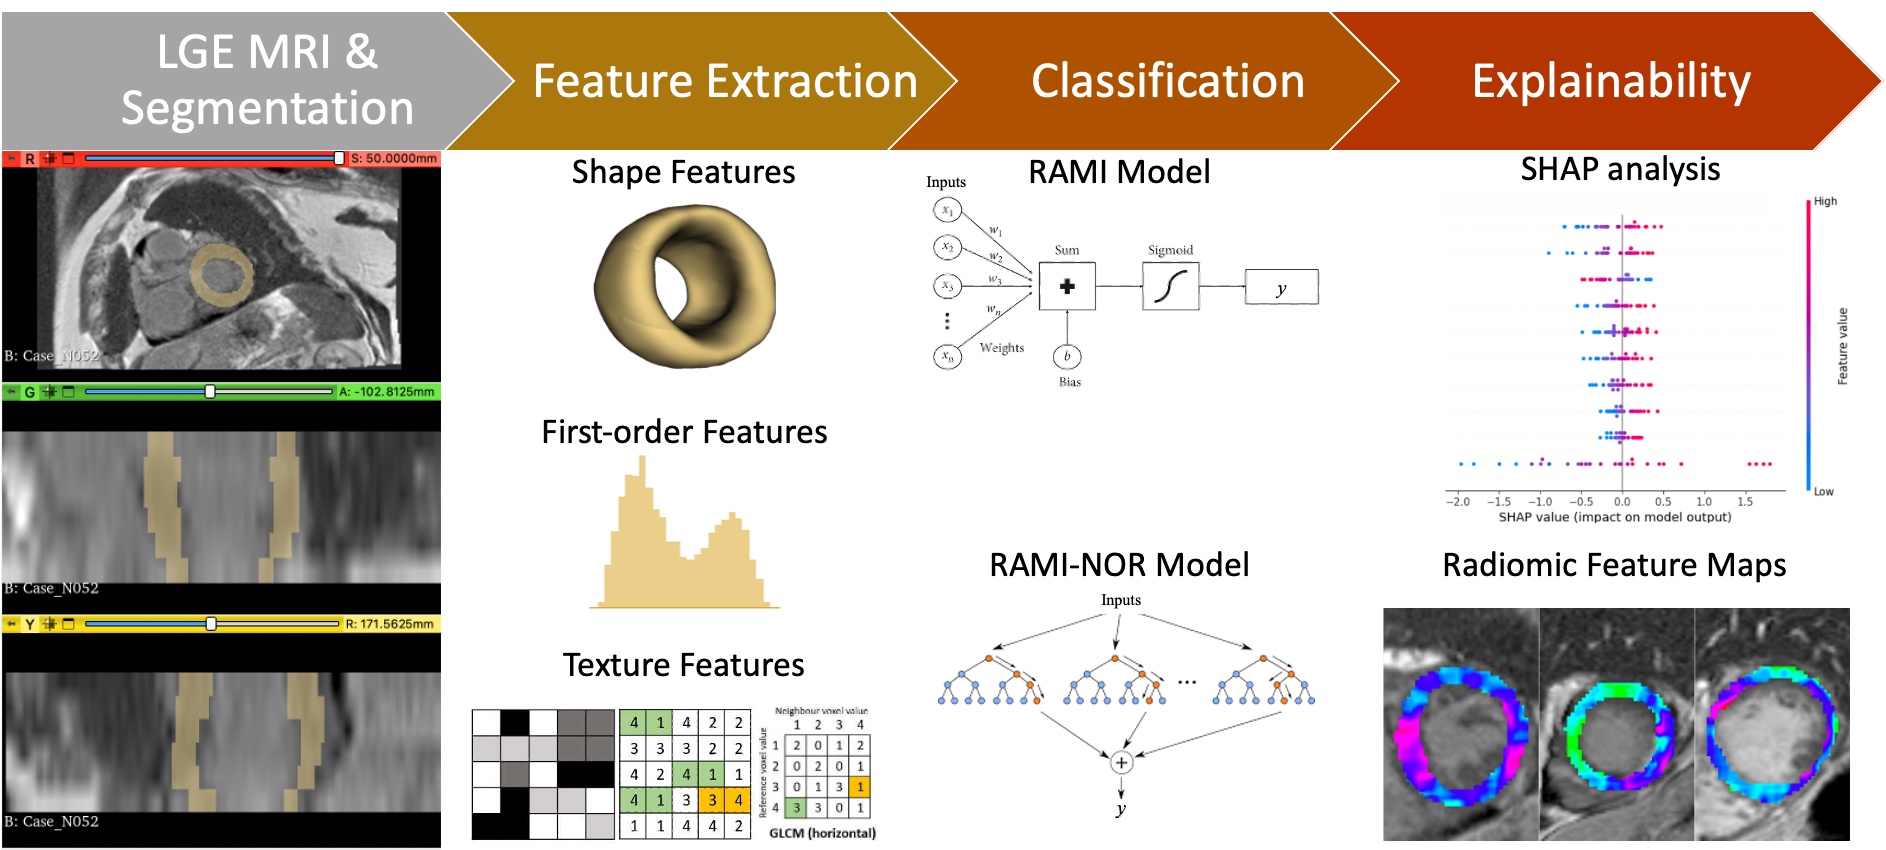
Clinical data: 100 patient datasets (33 normal cases and 67 pathological cases, including 40 with no-reflow) from the EMIDEC T1-weighted Phase Sensitive Inversion Recovery (PSIR) dataset,10 and corresponding segmentation labels, were used. Data were obtained using 1.5T and 3T MRI scanners (Siemens, Erlangen, Germany) and consisted of 5-10 short-axis slices, with in-plane resolution between 1.25 × 1.25 mm2 and 2 × 2 mm2 and slice thickness of 8 mm. For each image, segmentations of the healthy myocardium, myocardial infarction, and no-reflow were also used. The dataset was split into training (70%), used to optimize the models through a 4-fold cross-validation process, and held-out test (30%) sets while maintaining stratified proportions.Model 1 | RAMI: The first RAdiomics model for Myocardial Infarction detection, RAMI, was constructed using logistic regression with elastic net regularization and image features extracted from myocardium segmentation.
Model 2 | RAMI-NOR: The second model, RAMI-NOR, was developed using a random forest that specifically targeted the identification of MI with NO-Reflow by considering image features extracted from MI segmentation.
SHapley Additive exPlanations (SHAP) analysis was used to explain model outputs. Figure 1 shows the models flowchart.
Results
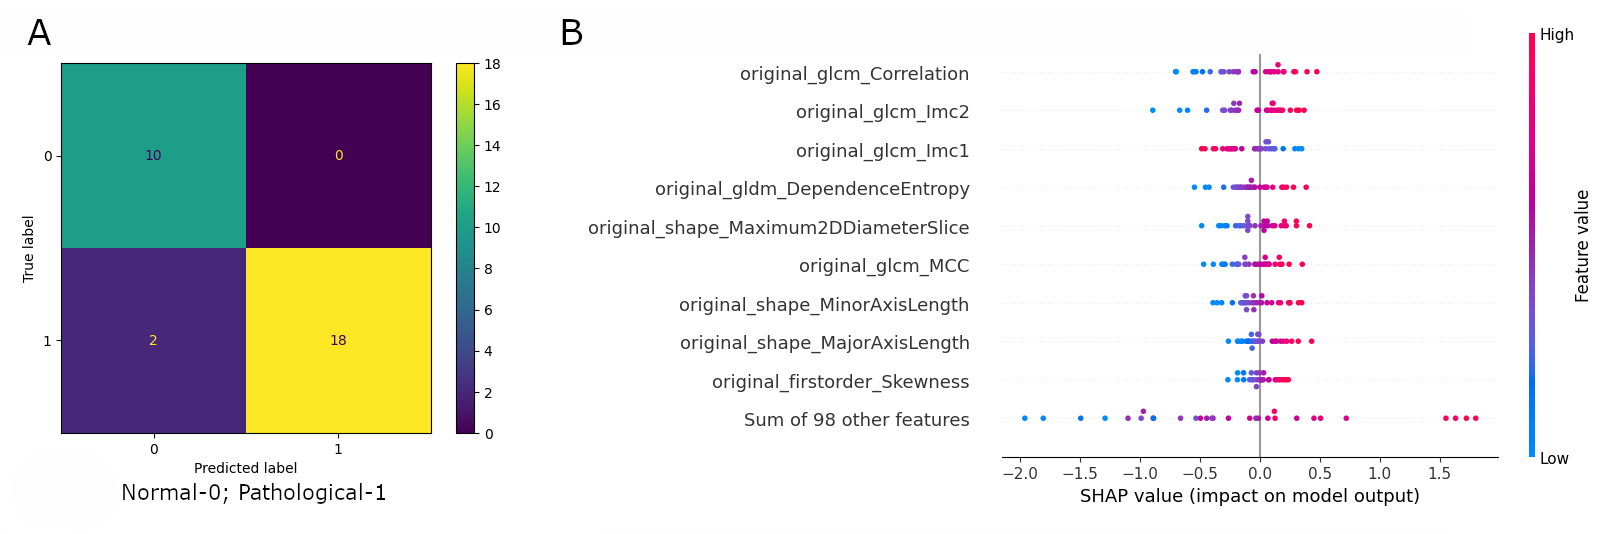
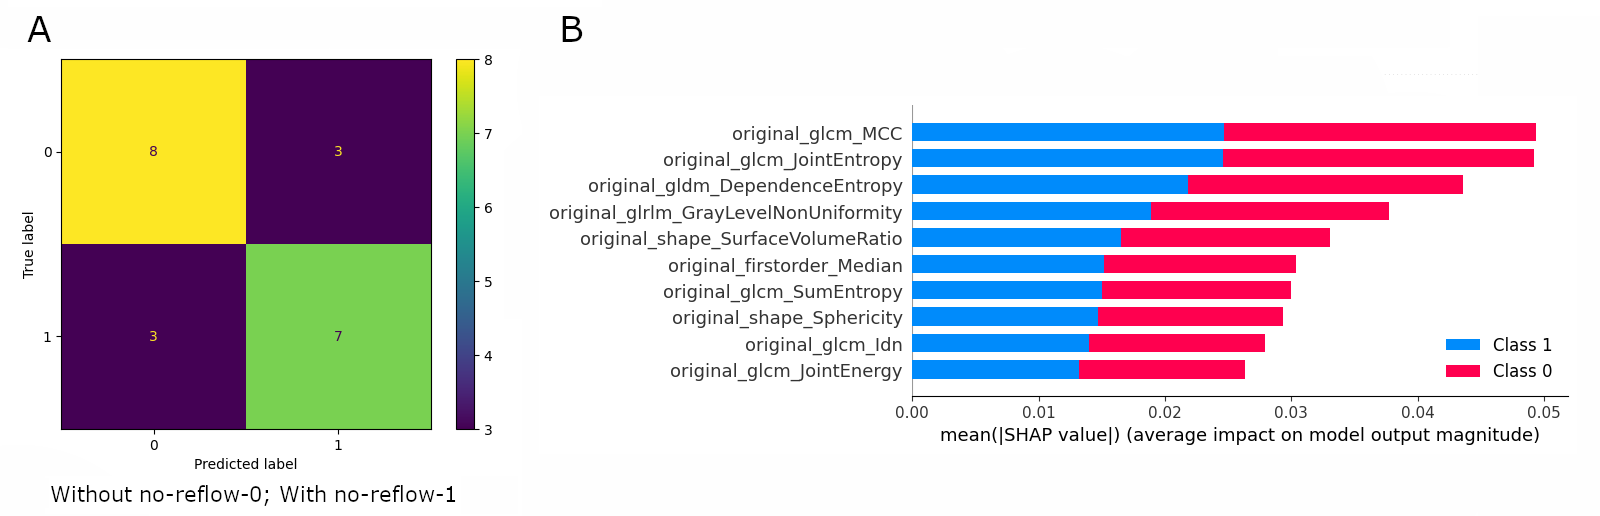
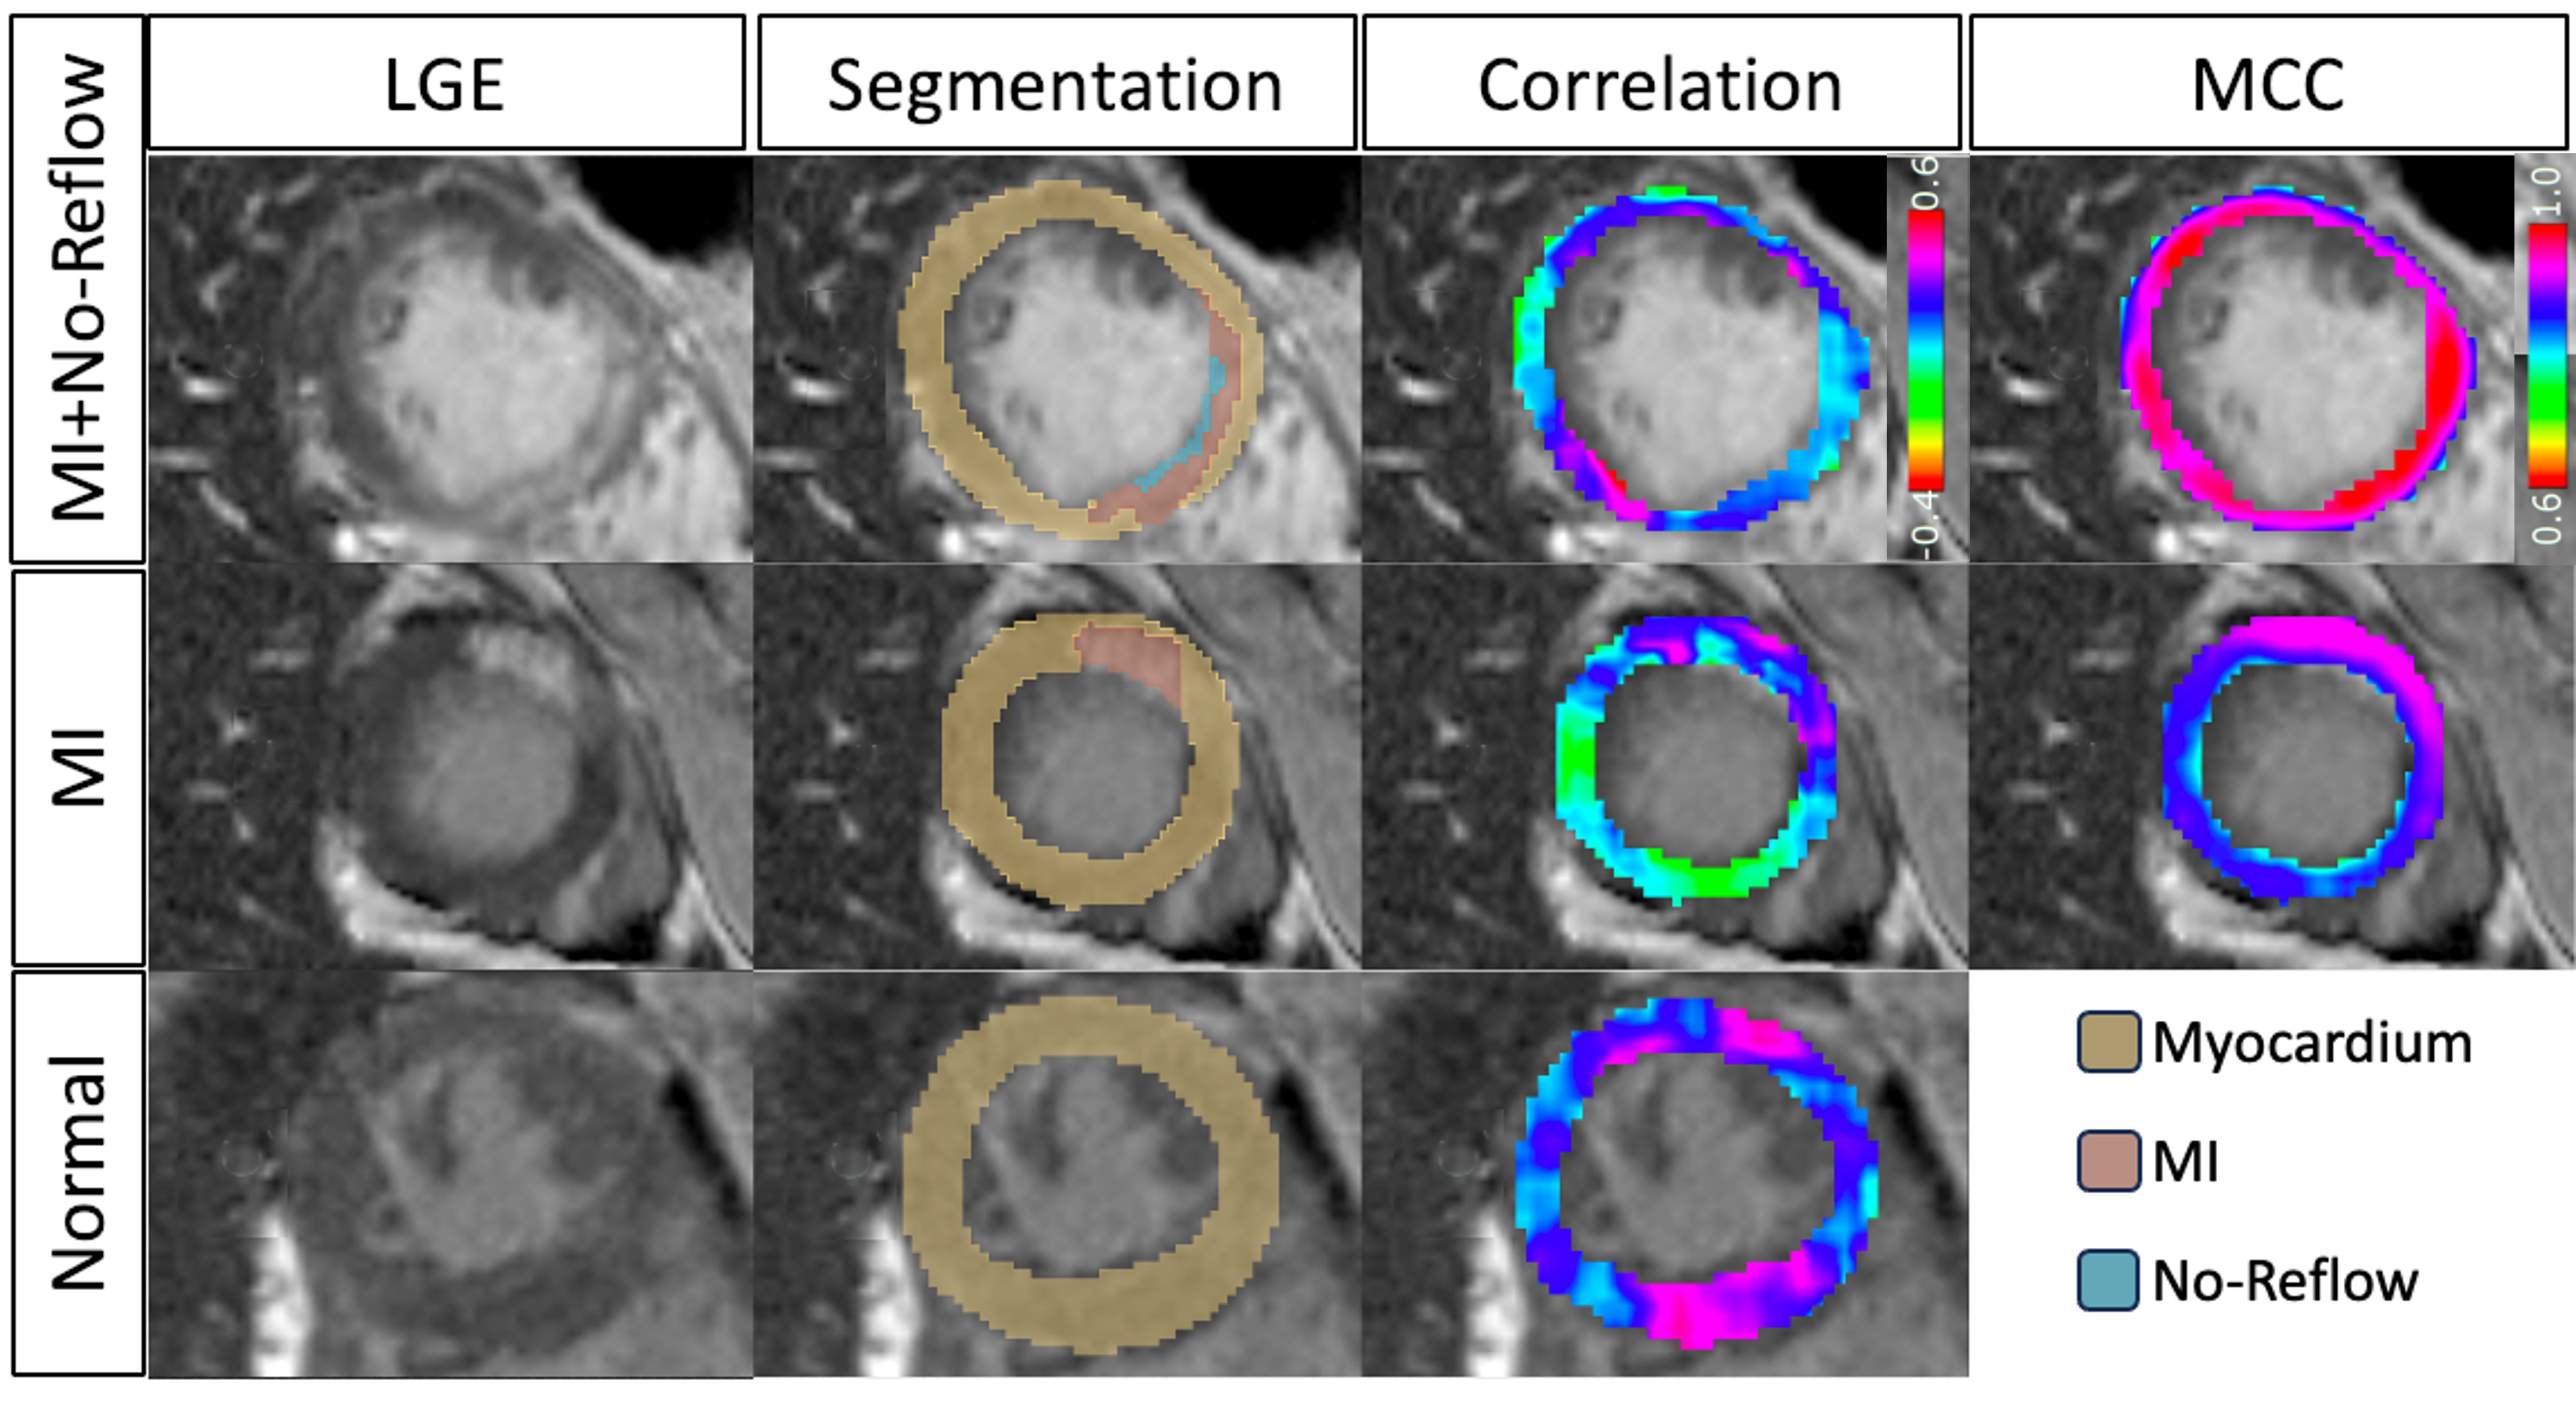
RAMI, the proposed model for automated MI detection, exhibited excellent performance, achieving an area under the receiver operating characteristic curve (AUC) of 0.99 ± 0.02 and 0.95 on the cross-validation and held-out test, respectively. RAMI achieved a remarkable sensitivity of 100% ± 0% on both sets and specificities of 90% ± 17% and 100%, respectively. RAMI-NOR, the model designed to identify MI cases with no-reflow, yielded lower AUC values of 0.76 ± 0.10 on the cross-validation and 0.71 on the held-out test. Regarding sensitivity, this model achieved 83% ± 17% on the cross-validation and 70% on the held-out test. Specificity values were 79% ± 27% and 73%, respectively. Figures 2&3 show the confusion matrices and SHAP plots for RAMI and RAMI-NOR. Figure 4 displays representative cases featuring segmentations and obtained radiomics maps. For RAMI, the most important feature was the correlation feature from gray-level co-occurrence matrix (glcm). The Maximal Correlation Coefficient (MCC) feature achieved the best performance in discriminating between cases with and without non-reflow.Conclusions
Two radiomics models based on LGE features were proposed to automatically assess the presence of myocardial infarction (RAMI) and microvascular obstruction (RAMI-NOR). RAMI, a highly accurate logistic regression model, showed great potential to automatically distinguish normal and pathological cases based on LGE radiomics features. RAMI-NOR has shown promise for assessing MI cases with no-reflow, but still requires further fine-tuning or exploration of alternative deep learning-based methods to address the more complex cases effectively.Acknowledgements
This research was supported by: FCT through projects UIDB/04326/2020, UIDP/04326/2020 and LA/P/0101/2020 and “la Caixa” Foundation and FCT, I.P. under the project code [LCF/PR/HR22/00533].References
1. Ismail F. et al. Cardiac MR: From Theory to Practice. Front Cardiovasc Med 9:826283 (2022).
2. Arai, A..The cardiac magnetic resonance (CMR) approach to assessing myocardial viability. J Nucl Cardiol 18(6), 1095–1102 (2011).
3. Allman, K., et al. Myocardial viability testing and impact of revascularization on prognosis in patients with coronary artery disease and left ventricular dysfunction: a meta-analysis. J Am Coll Cardiol 39(7), 1151–8 (2002).
4. Gerber, B., et al. Prognostic value of myocardial viability by delayed-enhanced magnetic resonance in patients with coronary artery disease and low ejection fraction: impact of revascularization therapy. J Am Coll Cardiol 59(9), 825–35 (2012).
5. Pineda, V., et al. No-reflow phenomenon in cardiac MRI: Diagnosis and clinical implications. AJR Am J Roentgenol 191, 73–79 (2008).
6. Lourenço, A., et al. Automatic Myocardial Disease Prediction from Delayed-Enhancement Cardiac MRI and Clinical Information. In: Puyol Anton, E., et al. Statistical Atlases and Computational Models of the Heart. M&Ms and EMIDEC Challenges. STACOM 2020. Lecture Notes in Computer Science, vol 12592 (2021).
7. Lalande, A., et al. Deep learning methods for automatic evaluation of delayed enhancement-MRI. The results of the EMIDEC challenge. Medical Image Analysis, 79, 102428 (2022).
8. Spadarella, G., et al. Radiomics in Cardiovascular Disease Imaging: from Pixels to the Heart of the Problem. Curr Cardiovasc Imaging Rep 15, 11–21 (2022).
9. Leiner, T., et al. Machine learning in cardiovascular magnetic resonance: basic concepts and applications. J Cardiovasc Magn Reson 21, 61 (2019).
10. Lalande, A., et al. Emidec: A Database Usable for the Automatic Evaluation of Myocardial Infarction from Delayed-Enhancement Cardiac MRI. Data 5, 89 (2020).
Figures