3382
A Spiral, Golden Angle SPGR Sequence for Blood Vessel T1 and T2 Measurement1Medical Biophysics, University of Toronto, Toronto, ON, Canada, 2Translational Medicine, The Hospital for Sick Children, Toronto, ON, Canada, 3Division of Cardiology, Department of Pediatrics, The Hospital for Sick Children, University of Toronto, Toronto, ON, Canada, 4Department of Diagnostic Imaging, The Hospital for Sick Children, University of Toronto, Toronto, ON, Canada
Synopsis
Keywords: Vascular, Blood
Motivation: Current methods for measuring T1 and T2 in fetal blood are inefficient, which limits their applicability to the largest vessels in late gestation.
Goal(s): To develop a faster, more motion-robust sequence for blood T1 and T2 measurement, which can be applied in fetal subjects.
Approach: A spiral, spoiled gradient echo sequence (sp-SPGR) was developed to jointly estimate blood T1 and T2 from a single, 12 second scan. sp-SPGR accuracy was validated in adult volunteers by comparison with conventional MOLLI and T2p-bSSFP techniques.
Results: The sp-SPGR sequence obtained T1 and T2 estimates consistent with conventional methods in approximately one-fifth the acquisition time.
Impact: As a faster, more motion robust sequence for estimating blood T1 and T2, sp-SPGR will support oximetry measurements in the fetal great vessels at earlier gestational age, facilitating more accurate and timely evaluation of fetal hypoxia.
Introduction
We present our recent work developing and validating a spiral, golden angle, spoiled gradient echo pulse sequence (referred to as sp-SPGR) for blood vessel T1 and T2 measurement. As described previously, estimates of blood T1 and T2 can be used to non-invasively determine oxygen saturation and hematocrit1. The sp-SPGR sequence jointly estimates T1 and T2 from a single, 12 second acquisition. This contrasts with current approaches, which measure T1 and T2 with separate, ~30 second acquisitions2,3. The added efficiency and inherent motion robustness of the golden angle spiral trajectory (and potential for in-plane motion correction4), makes sp-SPGR well-suited for measurements in fetal blood vessels.Methods
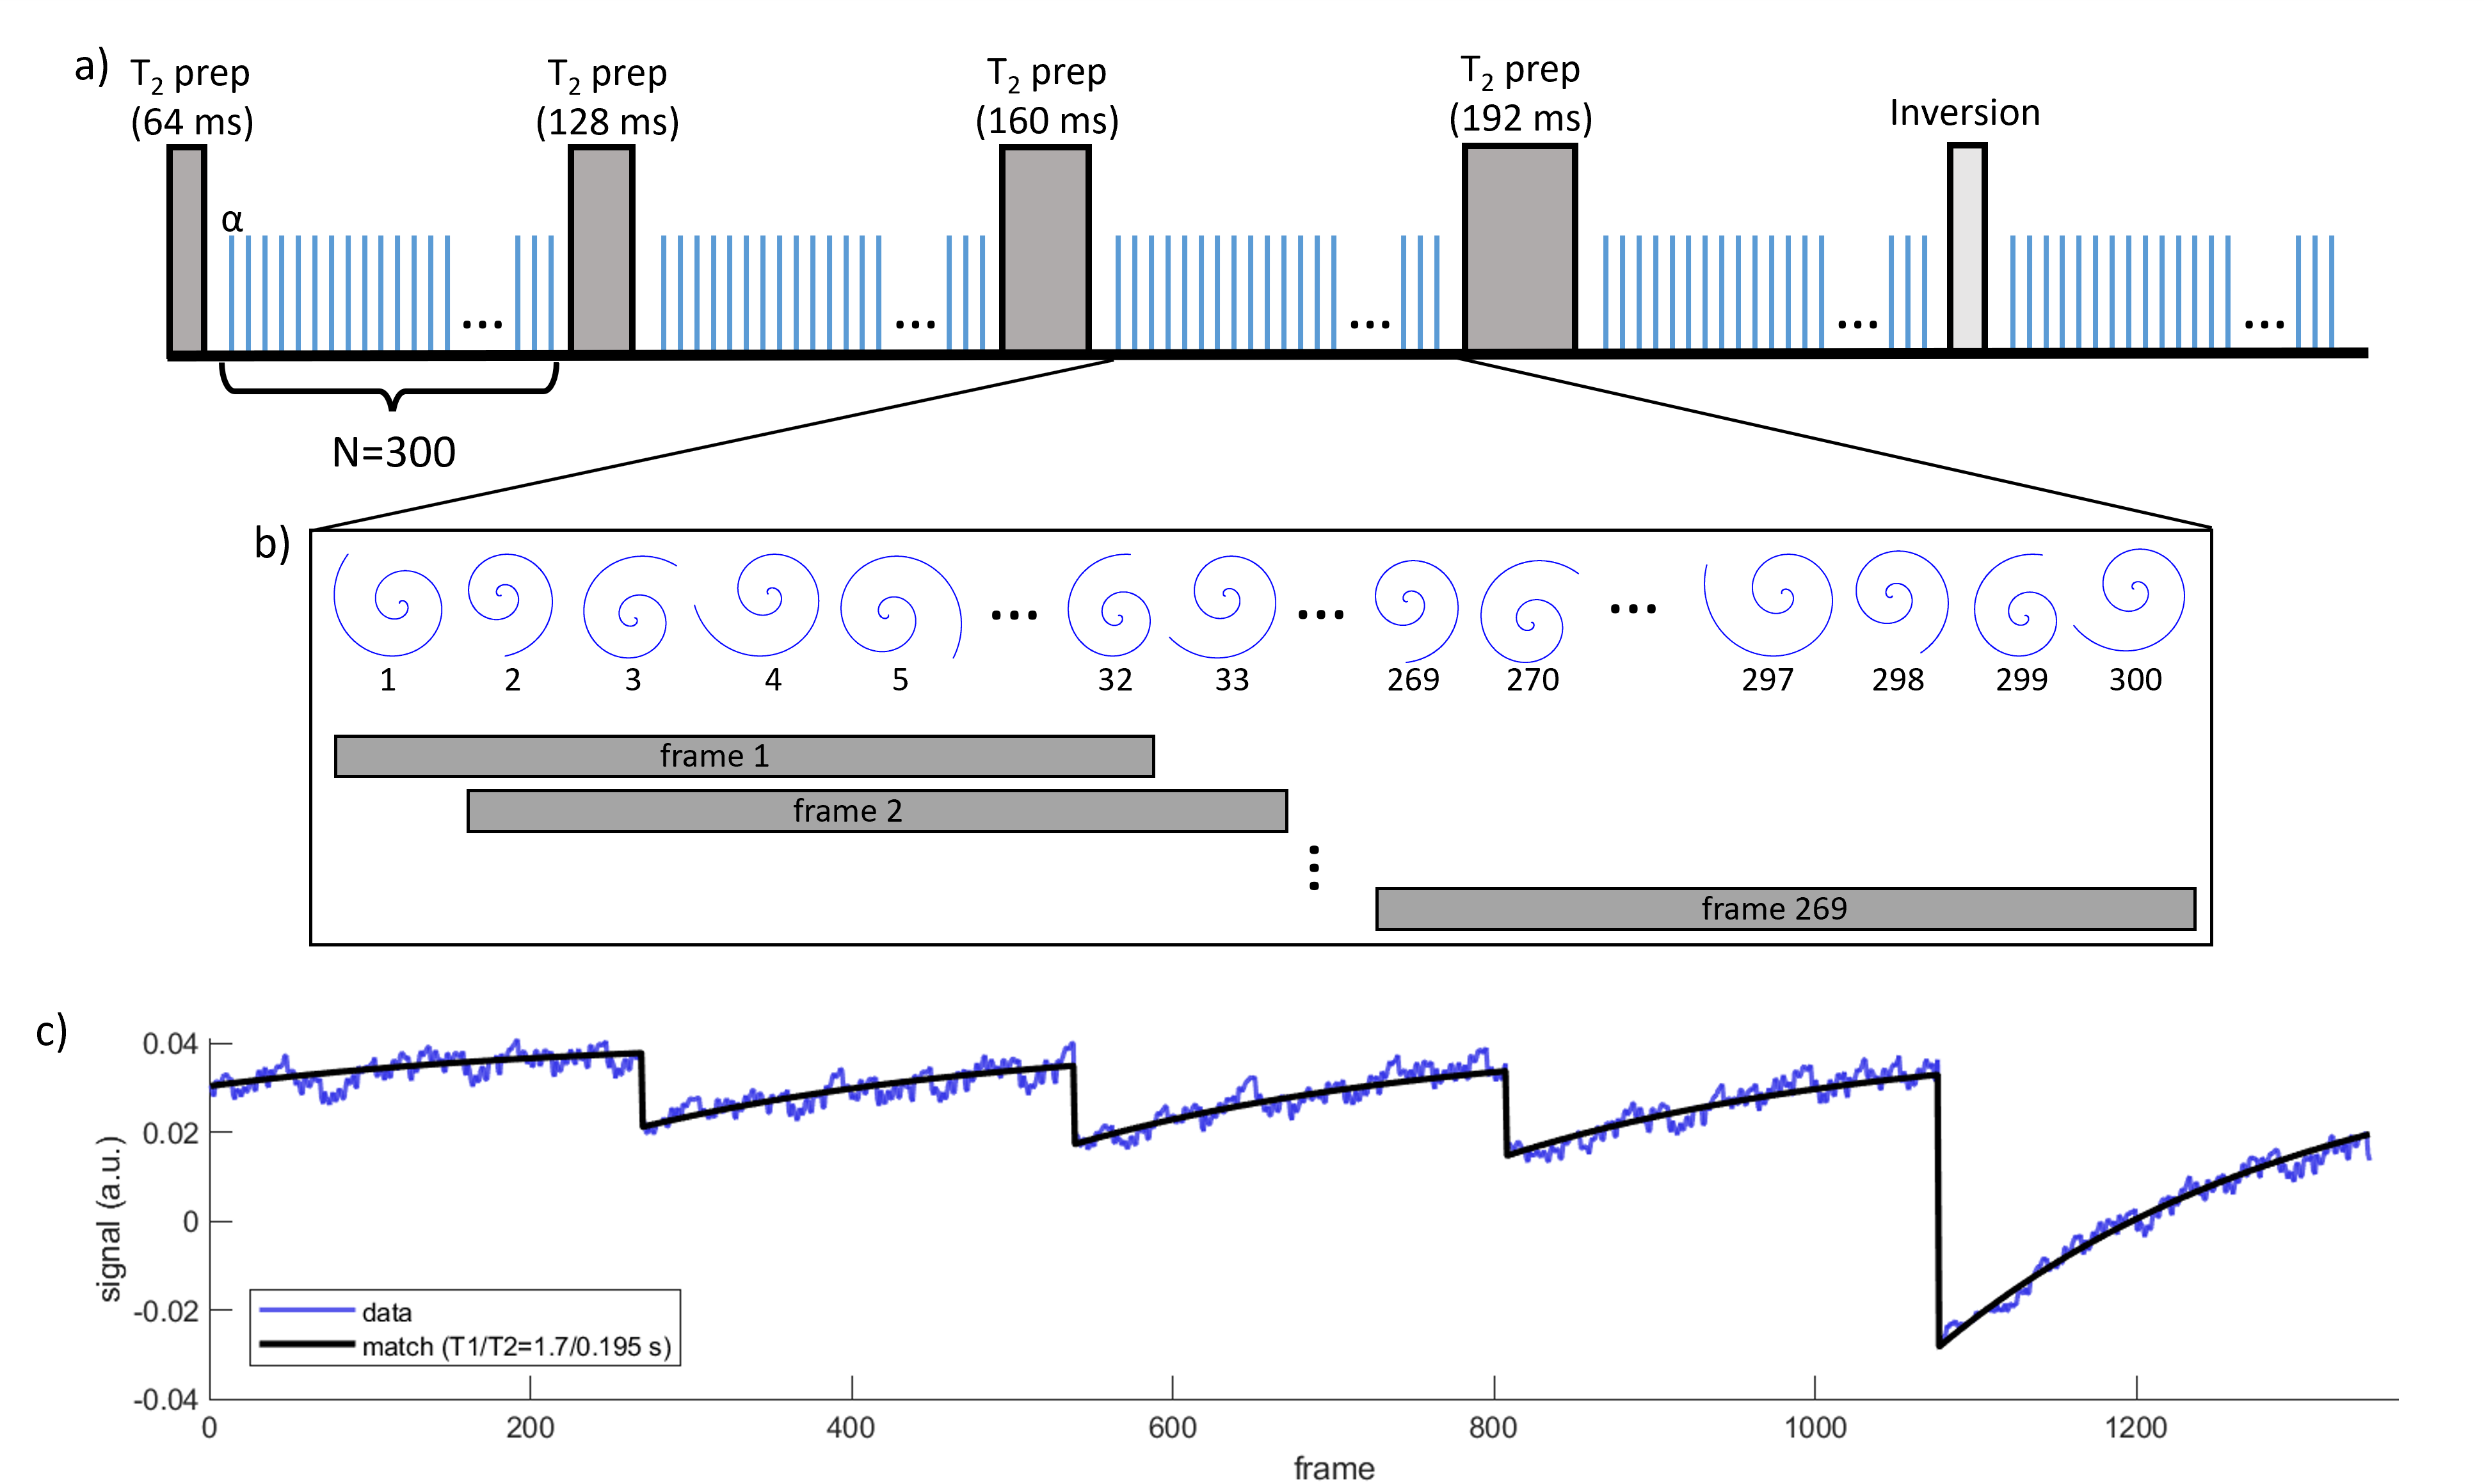
Data AcquisitionFigure 1a shows a schematic of the sp-SPGR sequence. Scanning was performed on a 1.5T AvantoFIT system (Siemens Healthineers, Erlangen, Germany). A single slice was acquired in the upper thighs of 7 adult volunteers and T1 and T2 were measured in the femoral veins. The femoral vein was chosen for its small diameter (~6.5 mm5), which is comparable to that of the fetal great vessels at late-gestation, as fetal vascular oximetry is the intended application of the sp-SPGR sequence.
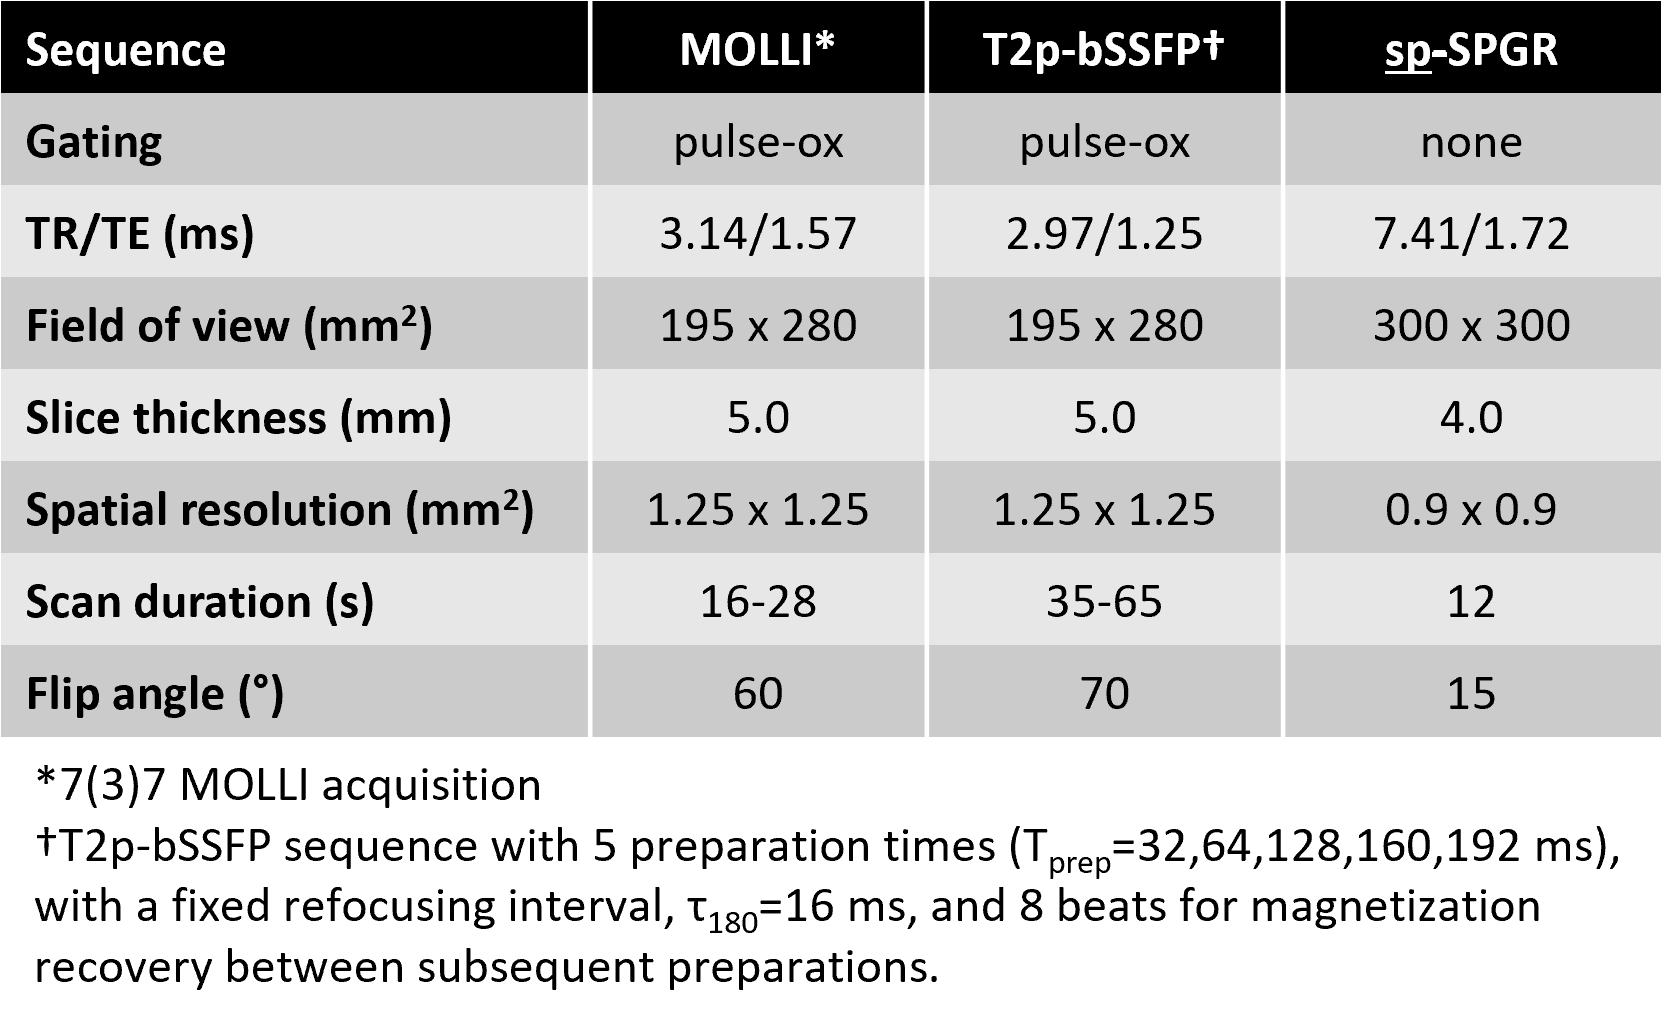
Modified Look-Locker inversion recovery (MOLLI) and T2-prepared balanced SSFP (T2p-bSSFP) acquisitions were also performed. Pulse sequence parameters are summarized in Table 1. Within the bore, participants were positioned with their knees at isocentre and the imaging slice was placed 150 mm superior. This helps ensure that venous blood from the lower legs, which enters the slice during the acquisition, is covered by the transmit RF coil and experiences all magnetization preparations.
T1, T2 Estimation
sp-SPGR: Regions of interest (ROIs) were hand-drawn in the femoral veins on a time-average image generated from the NUFFT of all 1500 spiral arms. A sliding window reconstruction (see Fig. 1b) was then performed, which combined consecutive sets of 32 spiral arms to generate a time series with 269x5=1345 frames. T1 and T2 were estimated by matching the time series ROI signal with a dictionary generated by Bloch equation simulations followed by sliding window summation (see Fig. 1c).
To incorporate flow effects, Bloch simulations were performed assuming that fresh blood, which did not experience previous SPGR excitations, fills the slice at every TR. With TR=7.41 ms and slice thickness = 4 mm (see Table 1), this corresponds to a velocity, v≥54 cm/sec. While this condition might not be met, especially in veins, preliminary simulations indicated that even with velocities 8 times slower (i.e. v=6.75 cm/sec), T1 and T2 were underestimated by less than 10%.
MOLLI, T2p-bSSFP: T1 and T2 were estimated by fitting the mean signal, S, within a hand-drawn ROI as a function of inversion time, TI, or preparation time, Tprep, to the expression S=A+B∙exp(-TI/T1) and S=A∙exp(-Tprep/T2), respectively.
Results
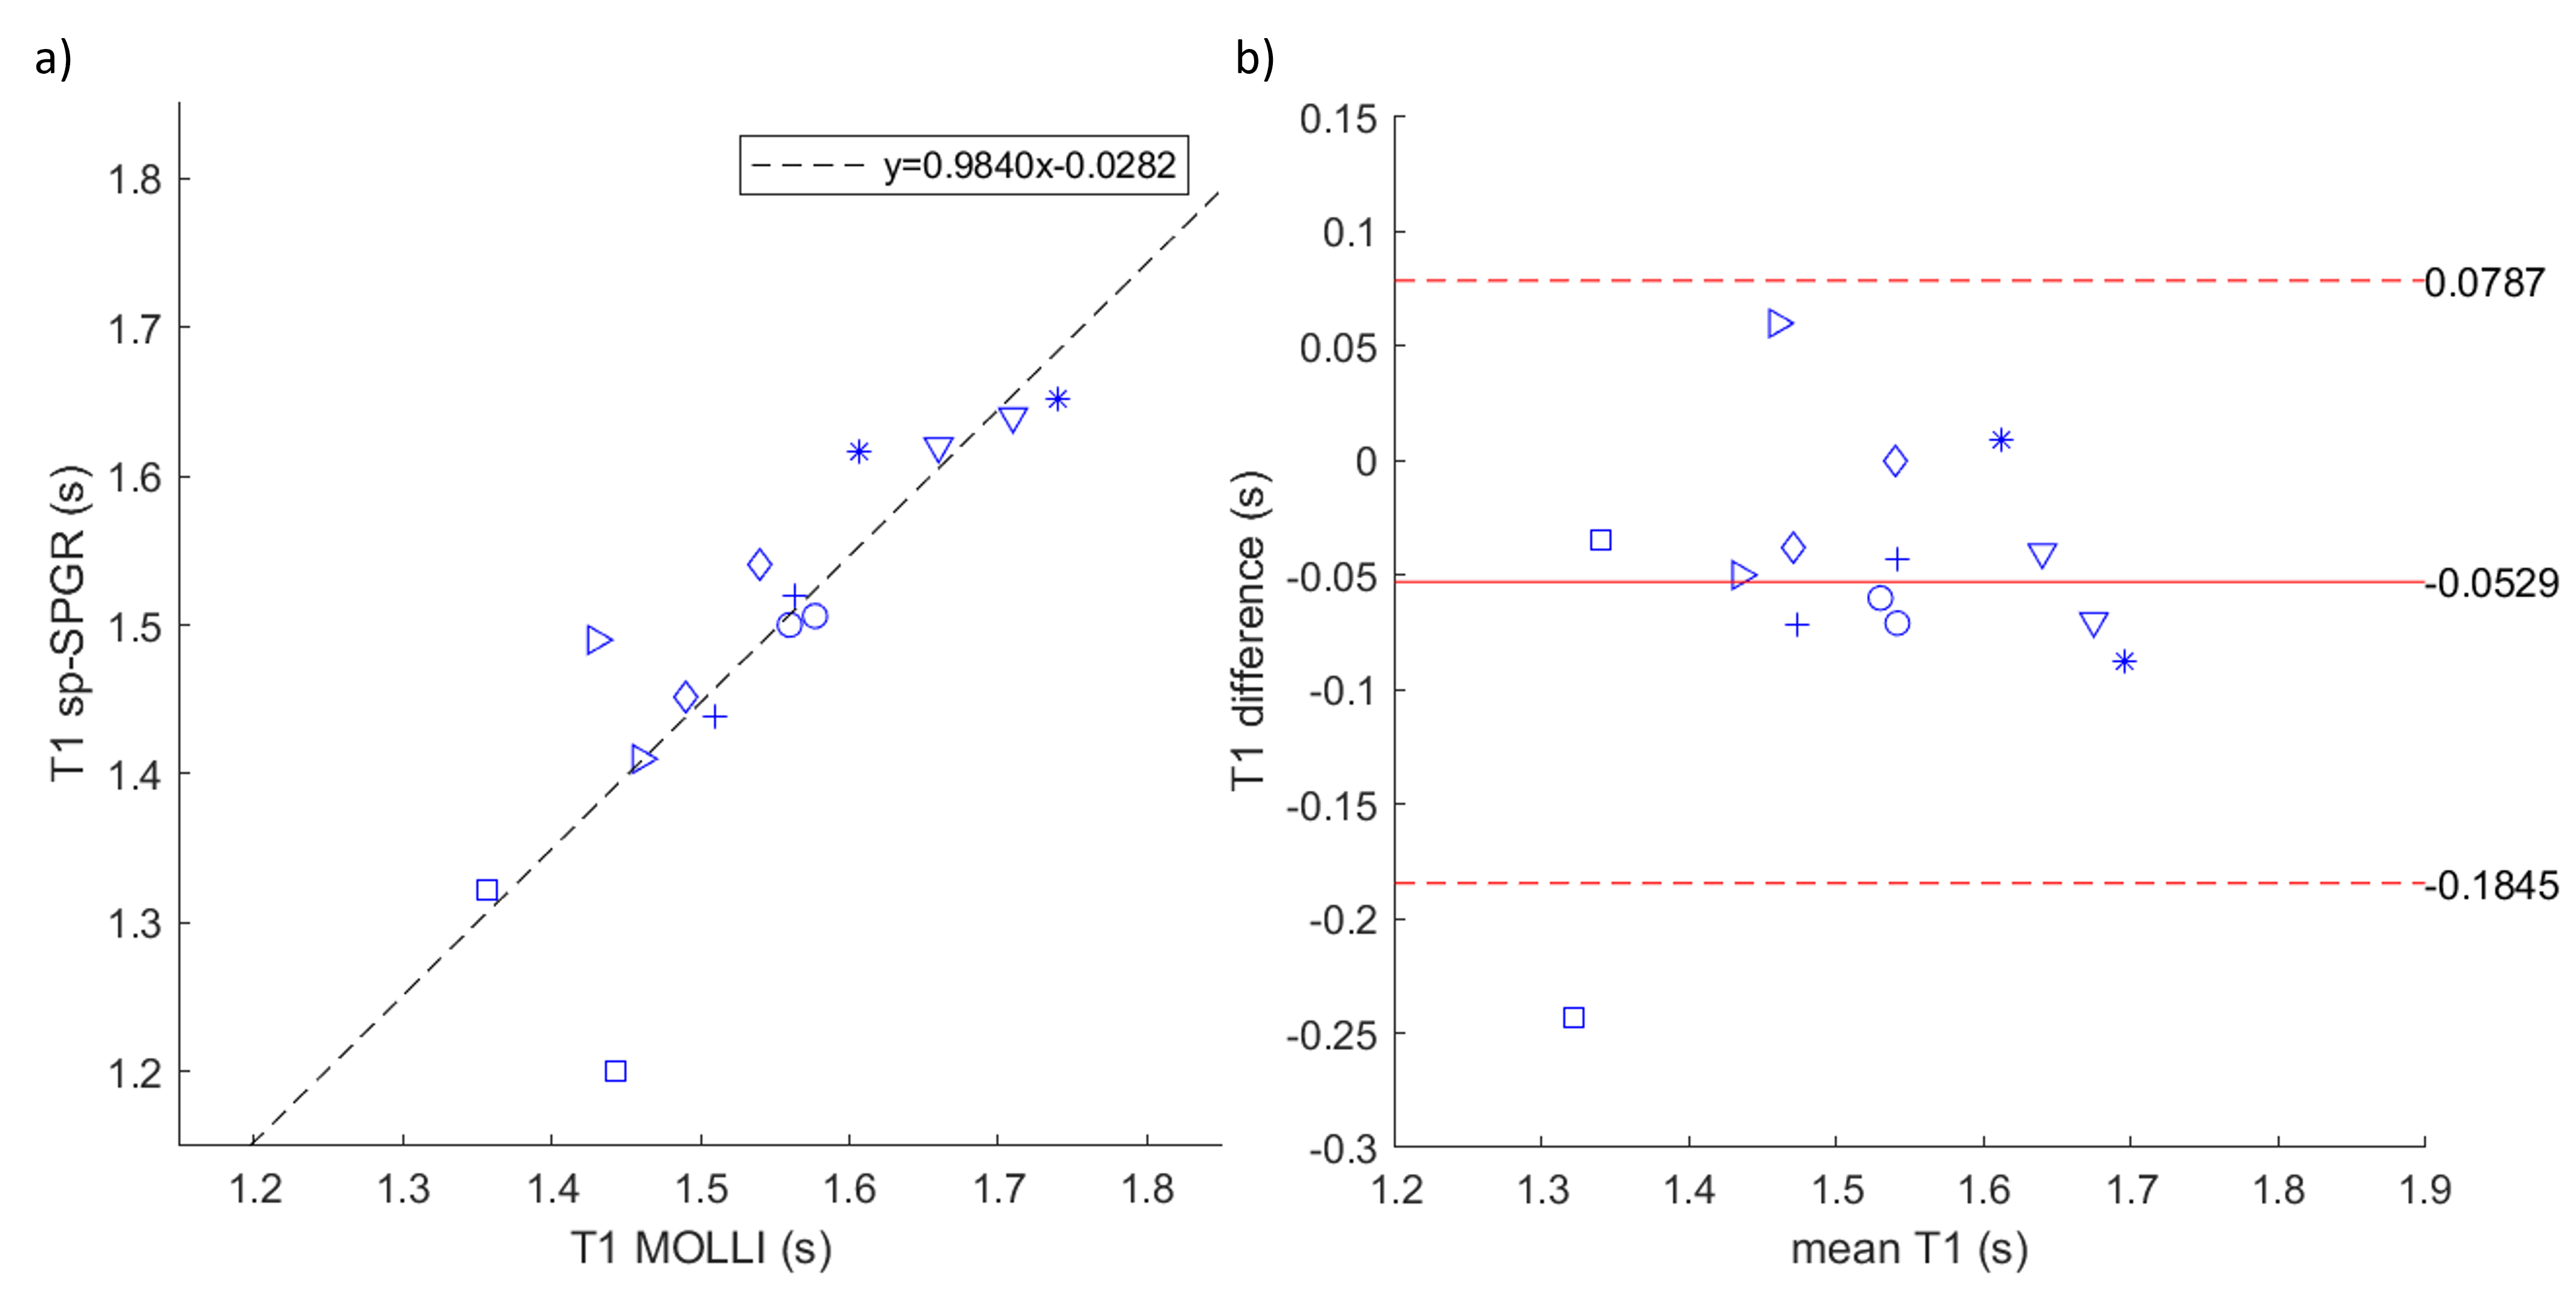
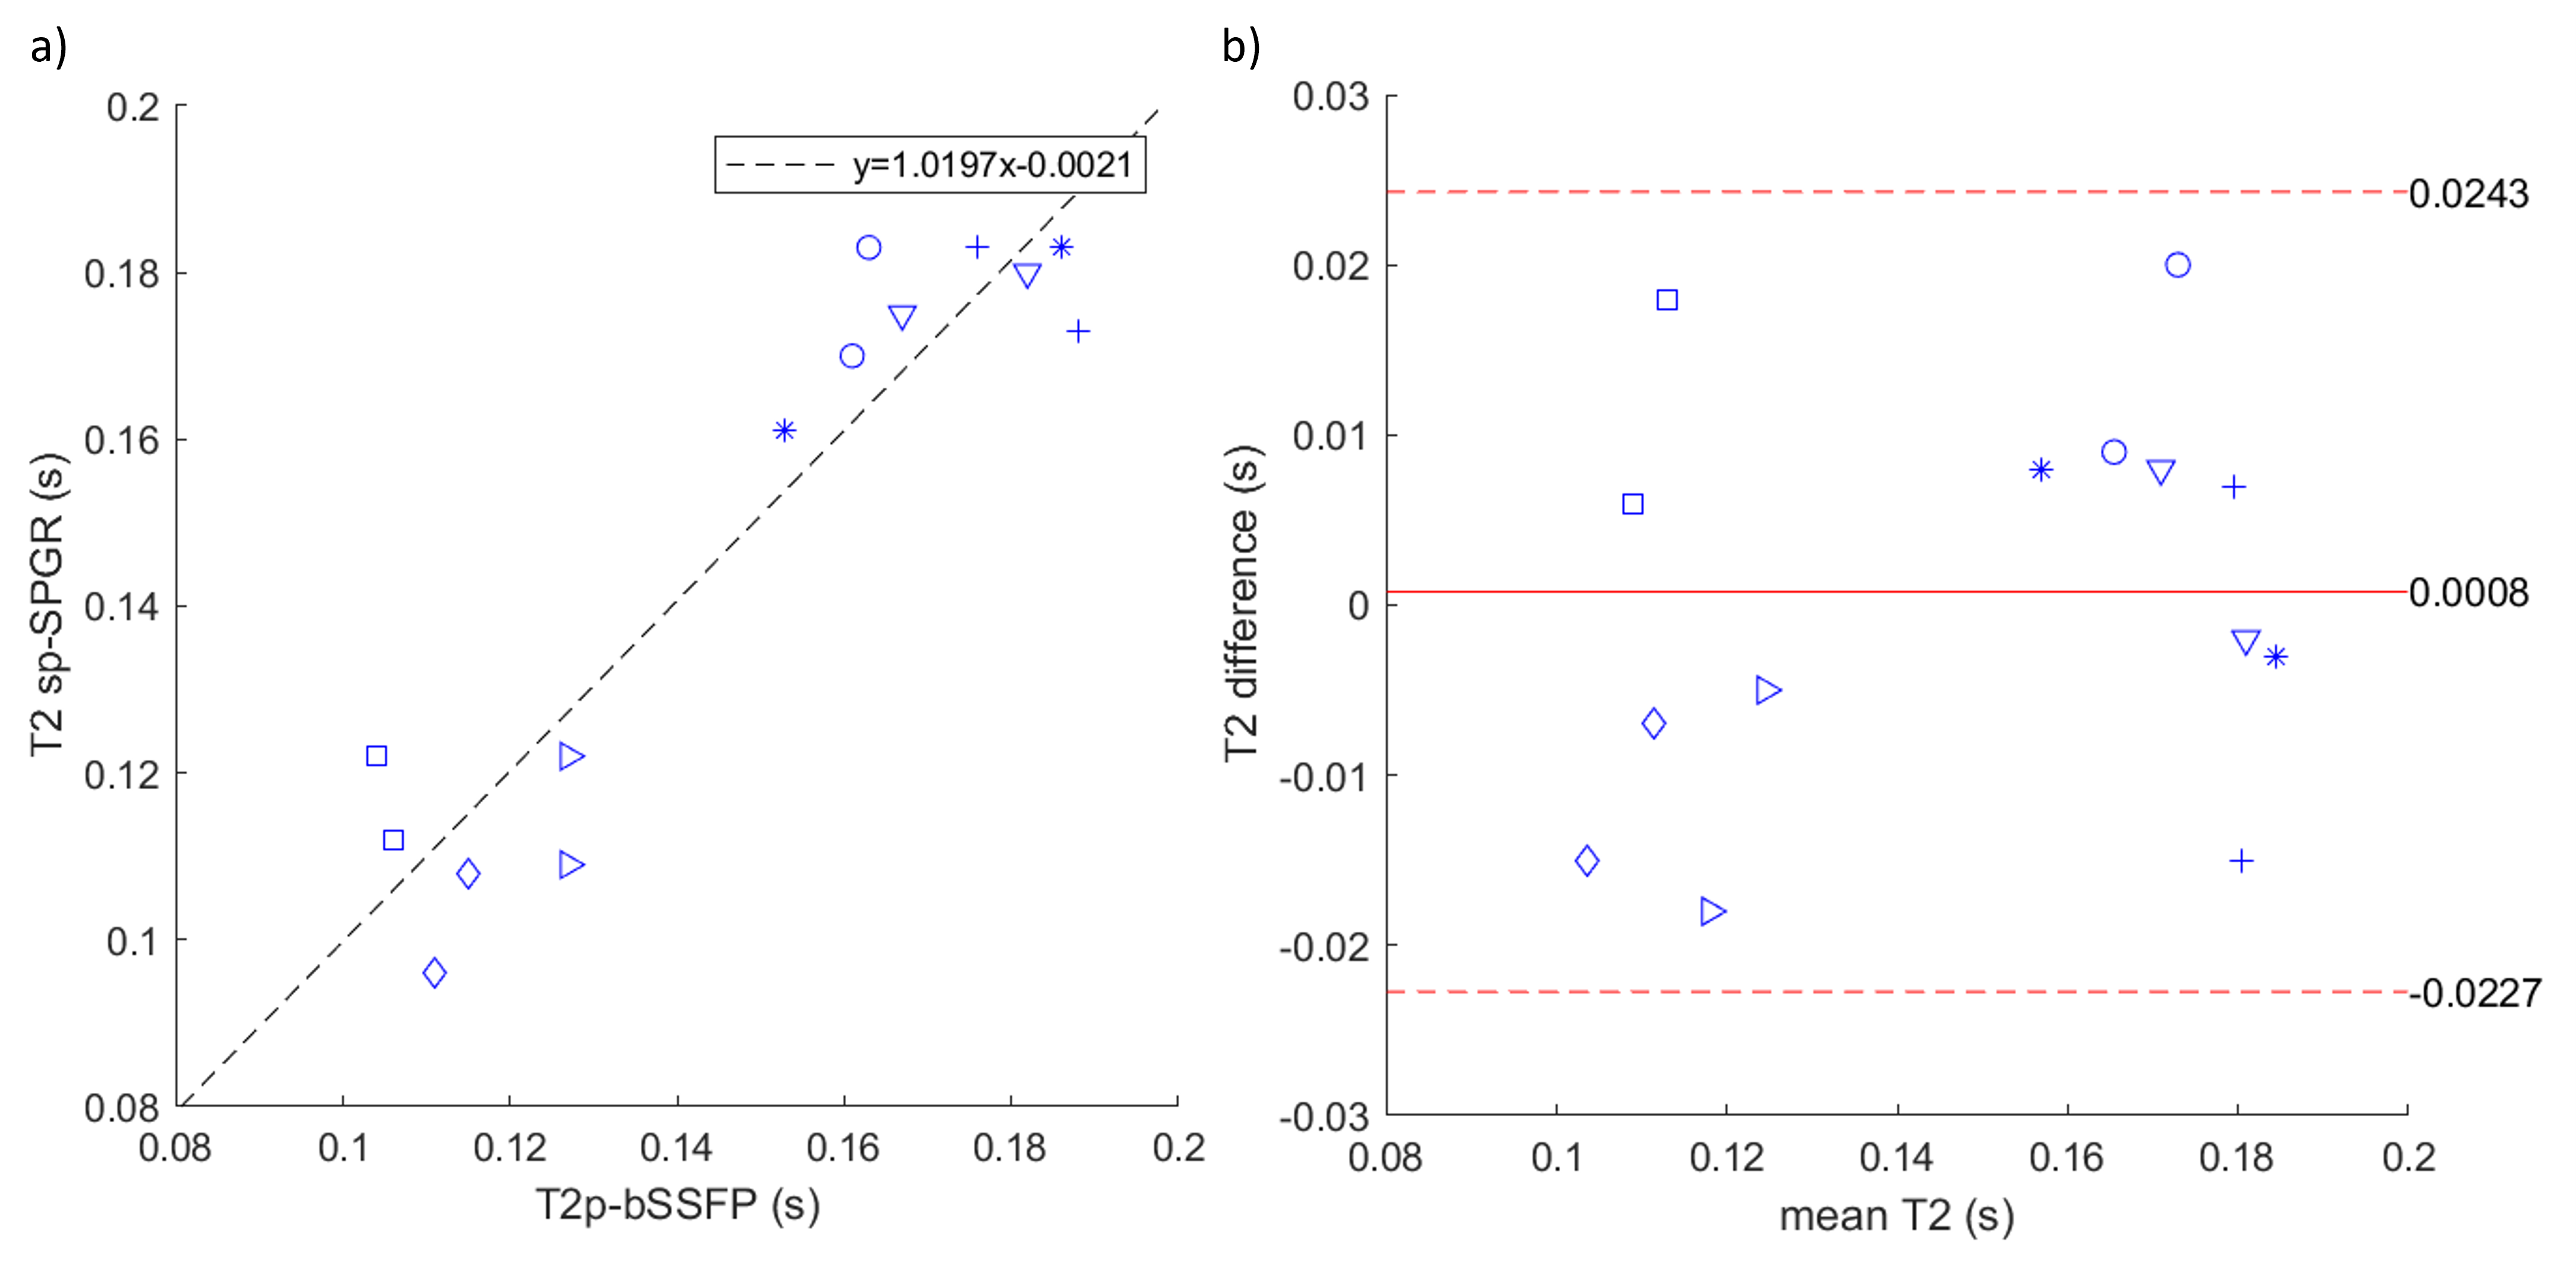
Comparisons of T1 and T2 values obtained with sp-SPGR to those from MOLLI and T2p-bSSFP acquisitions are shown in Figures 2 and 3, respectively. Bland-Altman analysis revealed good agreement between sp-SPGR and MOLLI, with slight bias towards T1 underestimation (-53 ms bias, 95% limits of agreement -185 to 79 ms). Good agreement, with minimal bias, was observed between sp-SPGR and T2p-bSSFP (0.8 ms bias, 95% limits of agreement -23 to 24 ms).Discussion
We present a spiral, golden angle, SPGR sequence for quantification of blood T1 and T2 relaxation times. Evaluation of the sequence in the femoral veins of 7 adult volunteers indicates good agreement with conventional methods. Even better agreement, without T1 underestimation, might be achieved by creating a more accurate dictionary with the help of a flow measurement to establish how many TRs (NTR) blood spins spend within the imaging slice (rather than assuming NTR=1).T1 underestimation may also come from out-of-coil inflow effects, where, in spite of positioning subjects’ knees at isocentre, blood which was beyond the extent of the transmit coil (and therefore did not experience all magnetization preparations) arrived in the imaging slice. sp-SPGR is more susceptible to out-of-coil inflow than MOLLI due to a longer interval between magnetization preparation and acquisition (~12 seconds between the first T2 prep and the last acquisition, compared to a maximum TI of ~9 seconds with MOLLI).
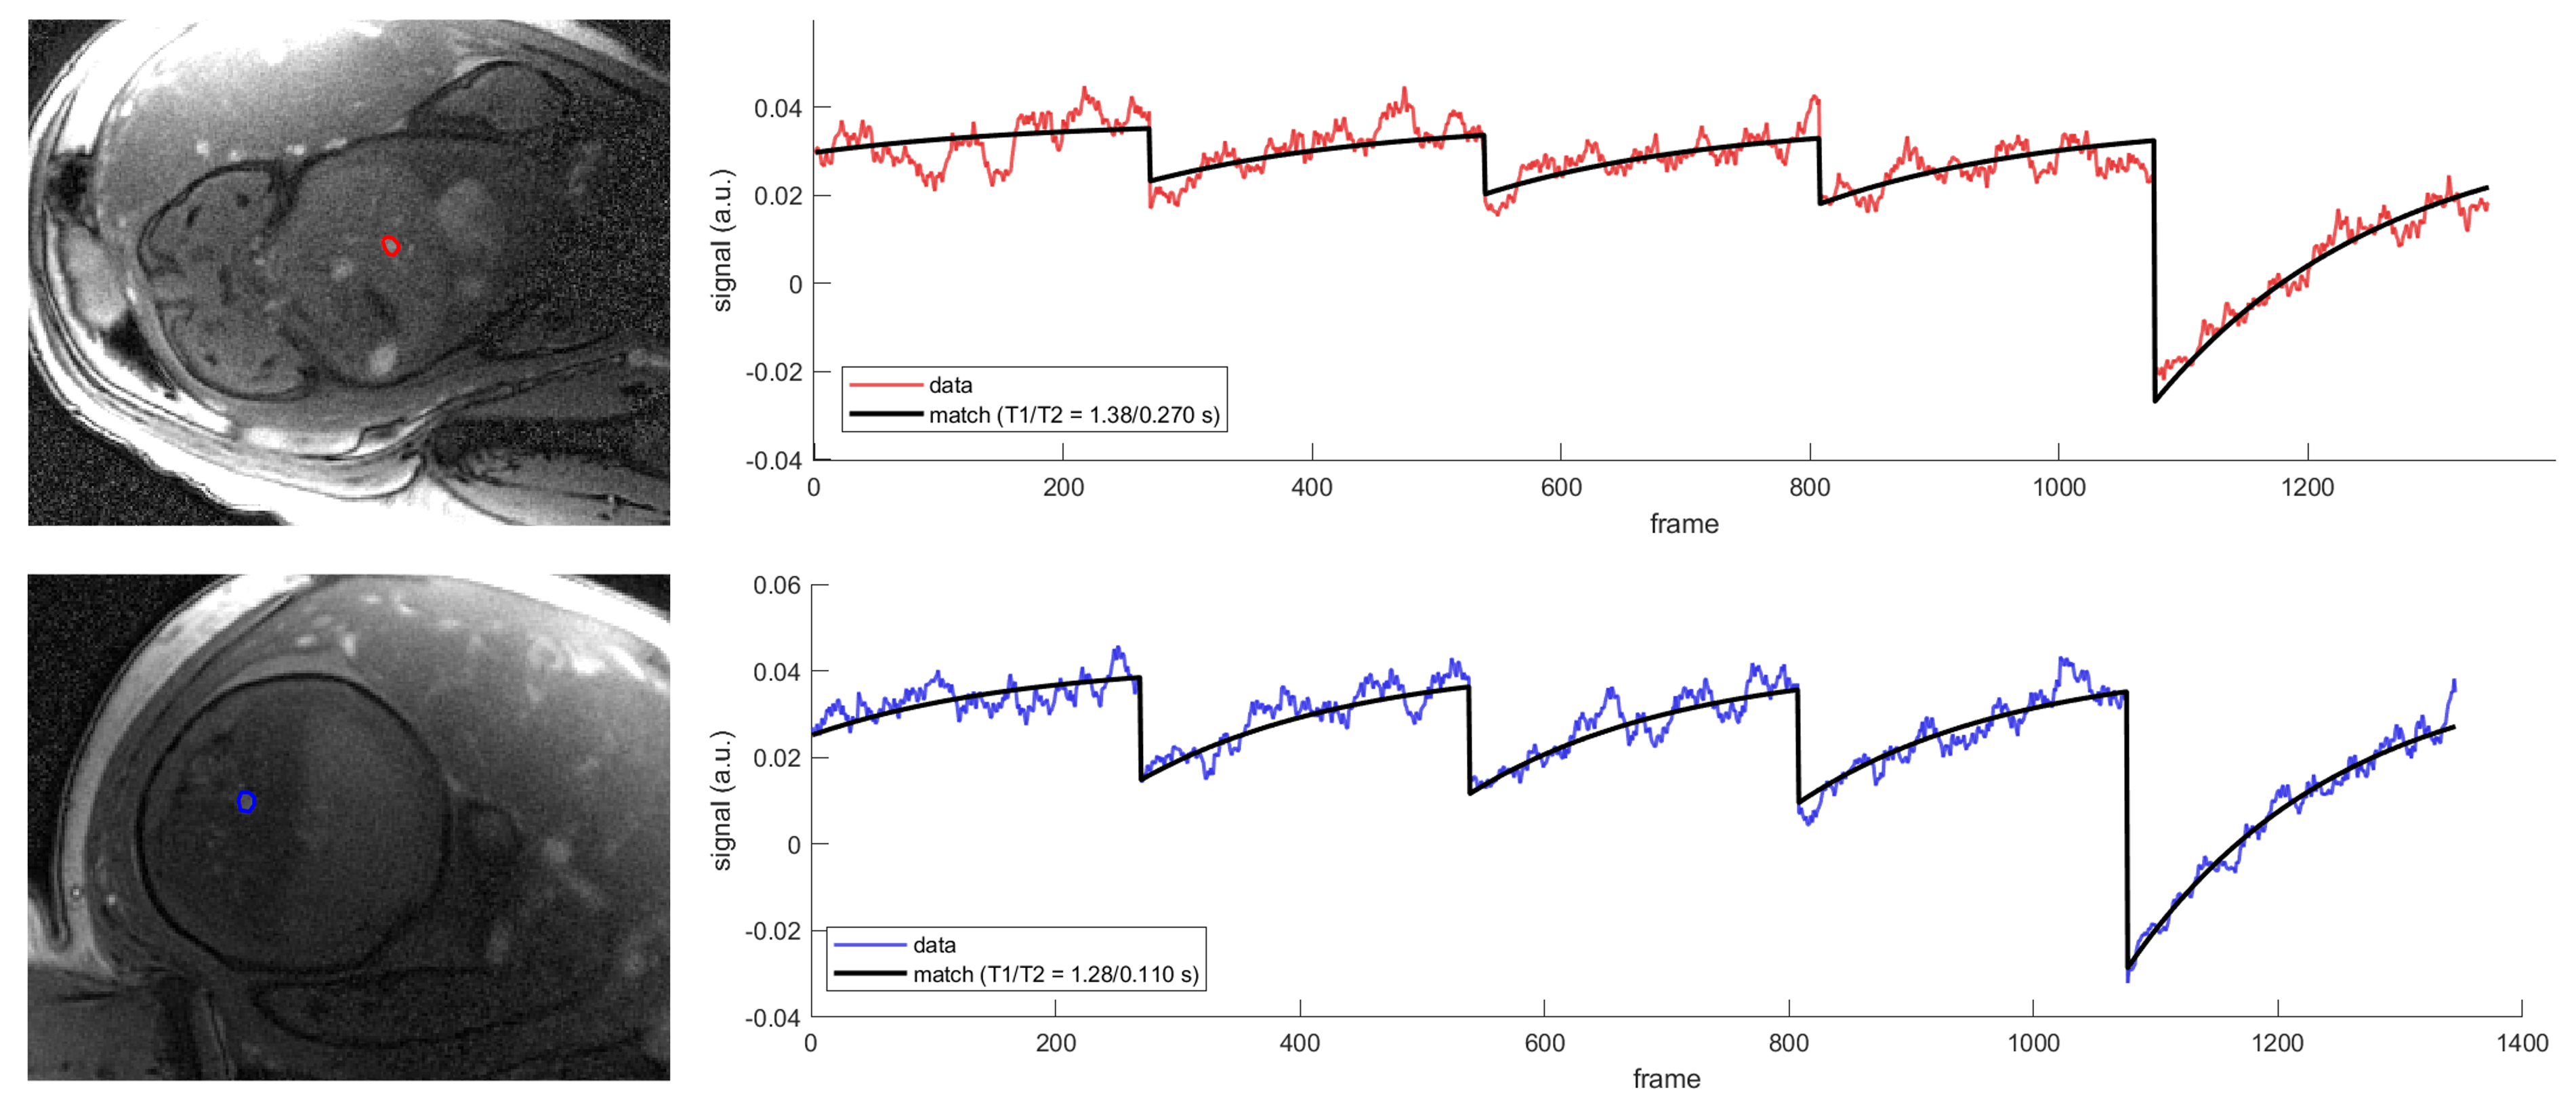
Future work will evaluate sp-SPGR in fetal subjects. Importantly, out-of-coil inflow is not a concern in fetal applications, as the entire fetal circulatory system is covered by the transmit coil. Figure 4 shows preliminary data demonstrating the feasibility of fetal sp-SPGR. We anticipate that the efficiency and motion-robustness of sp-SPGR will lead to improved accuracy in fetal blood T1 and T2 estimates and facilitate measurements at earlier gestational age than conventional methods currently permit.
Acknowledgements
No acknowledgement found.References
1. Portnoy, S, Seed M, Sled JG, and Macgowan CK. Non-invasive evaluation of blood oxygen saturation and hematocrit from T1 and T2 relaxation times: In-vitro validation in fetal blood. Magn Reson Med. 2017;78(6):2352-2359.
2. Sun L, van Amerom JFP, Marini D, et al. MRI characterization of hemodynamic patterns of human fetuses with cyanotic congenital heart disease. Ultrasound Obstet Gynecol. 2021;58(6):824-836.
3. Xu J, Duan AQ, Marini D, et al. The utility of MRI for measuring hematocrit in fetal anemia. Am J Obstet Gynecol. 2020;222:81.e1-13.
4. Roy CW, Seed M, Kingdom JC, Macgowan CK. Motion compensated cine CMR of the fetal heart using radial undersampling and compressed sensing. J Cardiovasc Magn Reson. 2017;19(1):29.
5. Hertzberg BS, Kliewer MA, DeLong DM, et al. Sonographic assessment of lower limb vein diameters: implications for the diagnosis and characterization of deep venous thrombosis. Am J Roentgenol. 1997;168(5):1253-1257.
Figures