3381
Feasibility of a 2D Radial Simultaneous Multi-Slice Phase Contrast MRI sequence for Aortic Pulse Wave Velocity Measurements1Medical Physics, University of Wisconsin-Madison, Madison, WI, United States, 2Radiology, University of Wisconsin-Madison, Madison, WI, United States, 3Medicine, University of Wisconsin-Madison, Madison, WI, United States
Synopsis
Keywords: Flow, Velocity & Flow, Simultaneous Multi-Slice, Pulse Wave Velocity
Motivation: Pulse wave velocity (PWV) is an important biomarker for cardiovascular risk that can be measured non-invasively with phase contrast MRI. Sequential scans at different planes can lead to inaccurate measurements so an alternate approach is needed.
Goal(s): We aim to develop a 2D simultaneous multi-slice (SMS) radial phase contrast sequence to image multiple planes concurrently, reduce timing inconsistencies, and measure PWV more accurately.
Approach: The radial phase contrast SMS sequence was implemented on a GE scanner and included in an ongoing volunteer study.
Results: The SMS scan provided higher quality images in less scan time than sequential and had reduced timing inconsistencies.
Impact: Pulse wave velocity (PWV) is a clinically important biomarker for cardiovascular risk. A simultaneous multi-slice radial 2DPC sequence allows for faster, more accurate MR flow measurements with high temporal resolution and reduced timing inconsistency which can improve early detection.
Introduction
Pulse wave velocity (PWV) refers to the speed of blood pressure waves as they propagate through the vasculature1. PWV is inversely related to arterial stiffness and has emerged as a useful tool for diagnosis and risk stratification of cardiovascular disease2. Aortic PWV can be determined non-invasively using 2D Phase-Contrast (2DPC) MRI by measuring the time-shifts between flow waveforms at 2+ points along the aorta and vessel pathlengths between them1. However, accuracy of the calculated PWV depends highly on the temporal synchronization of the 2DPC scans. Current clinical procedures involve prescribing two breath-hold 2DPC sequences back-to-back at different locations along the aorta. This can introduce significant misalignment between the sequences due to physiologic changes in heart rate and blood pressure. To overcome synchronization issues and enable the acquisition of 2DPC datasets with a high separation distance, we introduce a Simultaneous Multi-Slice (SMS) radial free-breathing 2DPC sequence. We compare this approach to 2 sequentially acquired single-slice radial 2DPC datasets in a small cohort of elderly subjects.Methods
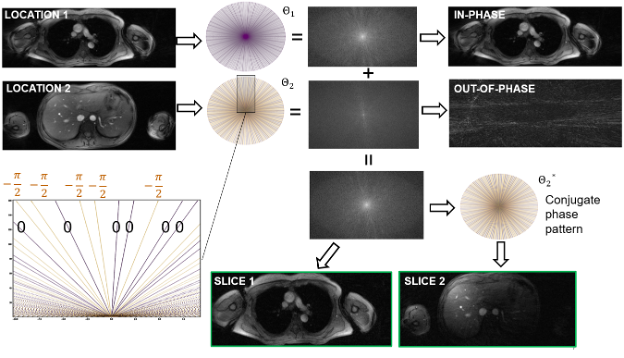
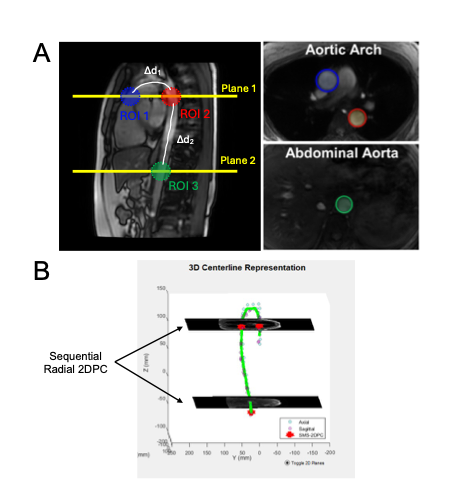
The radial 2DPC SMS sequence was implemented on a clinical 3T system (GE Healthcare, WI), and featured golden-angle sampling to enable retrospective cardiac and respiratory gating3. The SMS acquisition was achieved using phase cycling (blipping) which applies a phase ramp across alternating radial projections4,5,6. An SMS factor of 2 was targeted with a fixed slice separation distance of 158mm, further illustrated in Figure 1. Two-point velocity encoding was included by applying gradient blips to alternating phase encoding pairs. A PILS reconstruction was performed using a GPU-accelerated Python framework on the demodulated datasets7,8.This SMS sequence was included in an ongoing study with a cohort of elderly subjects at risk for Alzheimer’s Disease. Thirteen subjects (3M/10F, mean age=66.8y, range=56-76y) were scanned with the SMS sequence and the 2 sequential radial sequences on a 3T clinical system (Discovery MR750, GE Healthcare, WI) with a 30-channel chest coil9. The superior slice locations were matched so they were both located at the pulmonary bifurcation, bisecting the ascending (AAo) and descending (DAo) aortas (Figure 2A). Due to the SMS sequence’s fixed separation distance in this pilot study, the lower planes bisecting the abdominal aorta (AbdAo) were not matched (Figure 2B). Both sequences were acquired with similar parameters: TR/TE=7.4/4.2ms; flip=10°(SMS)/25°(sequential);#projections=10,000;VENC=150cm/s;gating=PPG(cardiac)/bellows(resp);reconstructed cardiac frames=40;temporal res.=25.2ms;scan time=150s (x2 for sequential). Additionally, ungated FIESTA images were acquired for aortic distance calculations.
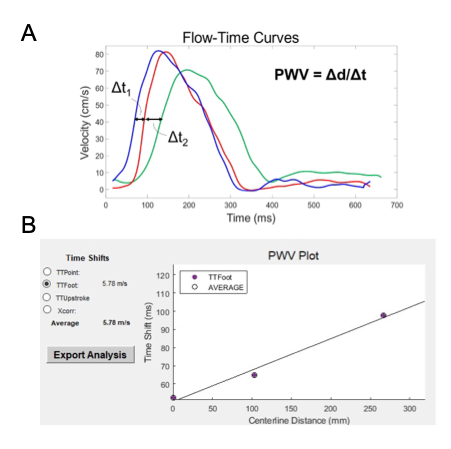
A custom GUI developed in MATLAB was used to semi-automatically trace aortic centerlines from the FIESTA images and compute flow curves from the 2DPC scans for each ROI7 (Figure 3A). PWV was calculated using the Time-to-Foot (TTF) method between each pair of ROIs and also globally by fitting a line to all 3 measurement points1 (Figure 3B). PWVs calculated between the AAo and DAo (Arch-PWV) were compared between the SMS and sequential sequences and a two-tailed paired t-test was performed to assess differences in the methods. PWV calculated from the AAo to the AbdAo (Global-PWV) were also calculated for both sequences.
Results
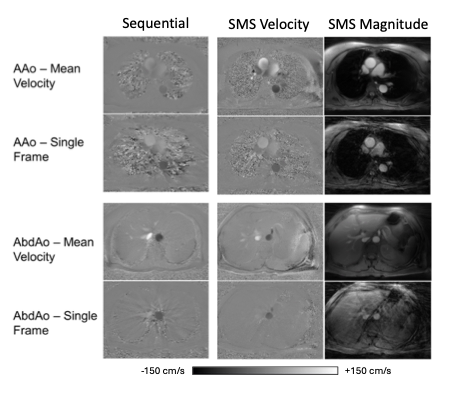
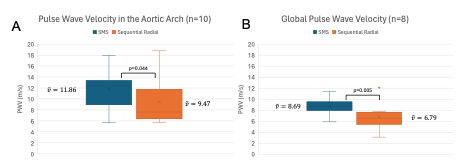
Figure 4 illustrates representative images from the SMS and sequential sequences. Of the 13 subjects with SMS scans, 3 had sequential scans with poor image quality that were excluded. Figure 5A shows box plots comparing the Arch-PWVs for the SMS and SSR sequences. From the remaining 10 subjects, there were 2 subjects with sequential scans that had temporal misregistration resulting in unphysiological Global-PWVs (>20 or <0 m/s) which were then excluded for the sake of comparison in Figure 5B.Discussion
As illustrated in Figure 4, the SMS sequence produced higher quality 2DPC images with fewer undersampling artifacts within the same scan time as a single sequential sequence while still having identical physiological gating. In the aortic arch, where both scan prescriptions were matched, the SMS scans produced a mean Arch-PWV (11.86m/s, SD=3.28) significantly higher than the sequential scans (9.47m/s, SD=4.63). Mean Global-PWV was also significantly higher for SMS (8.69m/s, SD=1.48) compared to the sequential sequences (6.79m/s, SD=2.40), although differing path lengths makes comparison difficult. Additionally, 2/10 subjects sequential scans had temporal inconsistencies between planes leading to extremely small time-shifts and unrealistically large PWVs, an issue that did not affect the SMS scans.Conclusion
This study demonstrated the feasibility of an SMS approach to acquire PWV data in the aorta. Images from the SMS sequence had higher quality and took less time to acquire while avoiding temporal misregistration issues that led to the exclusion of some sequential scans. Future work will include further sequence and image quality optimization to provide adjustable slice separation distance, higher acquisition acceleration, constrained reconstruction, and larger cohort studies/validations.Acknowledgements
The authors wish to acknowledge the NIH (R01AG062167, RF1AG027161, P30AG062715, F31AG071183) for supporting this study, as well as GE Healthcare which provides research support to the University of Wisconsin.References
1. Wentland AL, Wieben O, François CJ, Boncyk C, Munoz Del Rio A, Johnson KM, Grist TM, Frydrychowicz A. Aortic pulse wave velocity measurements with undersampled 4D flow-sensitive MRI: comparison with 2D and algorithm determination. J Magn Reson Imaging. 2013 Apr;37(4):853-9. doi: 10.1002/jmri.23877. Epub 2012 Nov 2. PMID: 23124585; PMCID: PMC3566322
2. Kim HL, Kim SH (2019) Pulse Wave Velocity in Atherosclerosis. Front. Cardiovasc. Med. 6:41. doi: 10.3389/fcvm.2019.00041
3. Winkelmann S, Schaeffter T, Koehler T, Eggers H, Doessel O. An optimal radial profile order based on the Golden Ratio for time-resolved MRI. IEEE Trans Med Imaging. 2007 Jan;26(1):68-76. doi: 10.1109/TMI.2006.885337. PMID: 17243585.
4. Yutzy SR, Seiberlich N, Duerk JL, Griswold MA. Improvements in multislice parallel imaging using radial CAIPIRINHA. Magn Reson Med. 2011 Jun;65(6):1630-7. doi: 10.1002/mrm.22752. Epub 2011 Feb 1. PMID: 21287592; PMCID: PMC3097277.
5. Setsompop K, Gagoski BA, Polimeni JR, Witzel T, Wedeen VJ, Wald LL. Blipped-controlled aliasing in parallel imaging for simultaneous multislice echo planar imaging with reduced g-factor penalty. Magn Reson Med. 2012 May;67(5):1210-24. doi:
6. Barth M, Breuer F, Koopmans PJ, Norris DG, Poser BA. Simultaneous multislice (SMS) imaging techniques. Magn Reson Med. 2016 Jan;75(1):63-81. doi: 10.1002/mrm.25897. Epub 2015 Aug 26. PMID: 26308571; PMCID: PMC4915494. 10.1002/mrm.23097. Epub 2011 Aug 19. PMID: 21858868; PMCID: PMC3323676.
7. Griswold MA, Jakob PM, Nittka M, Goldfarb JW, Haase A. Partially parallel imaging with localized sensitivities (PILS). Magn Reson Med. 2000 Oct;44(4):602-9. doi: 10.1002/1522-2594(200010)44:4<602::aid-mrm14>3.0.co;2-5. PMID: 11025516.
8. Ong F, Lustig M. (2019, May). SigPy: a python package for high performance iterative reconstruction. In Proceedings of the ISMRM 27th Annual Meeting, Montreal, Quebec, Canada (Vol. 4819, No. 5).
9. Roberts GS, Johnson KM, Kecskemeti SR, Okonkwo O, Lose S, Eisenmenger L, Wieben O. Feasibility of a Free-Breathing 2D Phase Contrast MRI for Aortic Pulse Wave Velocity Measurements. ISMRM 2020. Abstract 2262
Figures