3375
Non-invasive estimation of relative pressure in the murine aortic arch using virtual work-energy (vWERP)1Department of Medical Physics, University of Greifswald, Greifswald, Germany, 2Department of Radiology, Northwestern University Feinberg School of Medicine, Chicago, IL, United States, 3Experimental Physics V, University of Wuerzburg, Wuerzburg, Germany, 4Department of Functional Materials in Medicine and Dentistry, University of Wuerzburg Institute of Functional Materials and Biofabrication (IFB), Wuerzburg, Germany, 5Department of Diagnostic and Interventional Radiology, University Clinics Wuerzburg, Wuerzburg, Germany, 6Institute of Experimental Biomedicine, University Clinics Wuerzburg, Wuerzburg, Germany, 7Department of Medical Clinic and Policlinic I, University Clinics Wuerzburg, Wuerzburg, Germany, 8Department of Molecular Medicine and Surgery, Karolinska Institutet, Solna, Sweden, 9Institute for Medical Engineering and Science, Massachusetts Institute of Technology, Cambridge, MA, United States
Synopsis
Keywords: Flow, Blood vessels
Motivation: MRI-based relative pressure is a promising imaging biomarker. A new technique, vWERP, improves pressure estimations compared to more simplified approaches. Validated in clinical settings, it's unexplored in mouse models.
Goal(s): To apply the vWERP algorithm to MRI-microscopy for pressure measurements in wild-type and atherosclerotic mouse models.
Approach: 4D flow MRI was performed in wild-type and ApoE-/- mice. Post-processing involved segmenting the aorta, defining analysis planes, and calculating pressure drops using the vWERP algorithm for analysis.
Results: Using vWERP with 4D flow MRI shows promise for studying vascular disease hemodynamics. Preliminary findings suggest pressure as a robust parameter to examine changes in CVD progression.
Impact: Application of vWERP to MRI-microscopy in mice reveals high potential for assessing cardiovascular disease progression, particularly in studying pressure changes. This new diagnostic tool benefits vascular health studies in preclinical settings and may be used to study atherosclerotic plaque development.
Background:
4D flow magnetic resonance imaging (MRI) is a promising imaging technique capable of comprehensive blood flow quantification. The technique was already successfully used across a broad range of applications to estimate hemodynamic behavior1. Recently, a novel image processing technique for relative pressure measurements based on 4D-hemodynamics was introduced: the virtual Work-Energy Relative Pressure (vWERP) method. The technique uses a virtual work-energy formulation of the Navier-Stokes equations, yielding more accurate estimations of regional pressure changes in comparison to alternative simplified approximations (e.g., the Bernoulli equation3). The vWERP technique has been successfully validated in various clinical settings, exhibiting excellent performance against invasive aortic catheter measurements2, as well as in patient-specific model setups representing both intracardiac4 and cerebrovascular5 pressure differences. Up to now, however, all studies have been focusing on human applications. For further knowledge of the progression and hemodynamic mechanisms of cardiovascular disease (CVD), preclinical studies in mouse models are often required. Of particular interest are mouse models that exhibit accelerated development of atherosclerotic plaques, such as Apolipoprotein E deficient (ApoE-/-) mice. Significant morphological and hemodynamic changes have already been published6 during aging and the development of plaques. Also significant pressure changes have been reported for these mouse models7, however, the implementation of new robust non-invasive analysis techniques such as vWERP to MRI-microscopy for more in-depth examinations has yet to be explored.Methods:
For this retrospective study, 4D flow MRI measurements in the aortic arch of 12-week-old wild-type (WT) mice (n=10, female) and 12-week-old ApoE-/- mice which had received an 8-week western chow diet (n=2, female) were selected. All 4D flow data was acquired at 17.6T within 32 minutes using the previously described self-navigated radial phase contrast (PC) CINE sequence8. Cine 4D flow MR images were reconstructed with 20 cardiac phases and an isotropic spatial resolution of 0.1 mm.Semi-automatic segmentation was performed to extract the aortic vessel geometry8. Subsequently, centerlines were computed in MATLAB with a custom-built analysis tool1. Using the centerlines, analysis planes were defined at four positions (see Figure 1a): A: In the ascending aorta. B: Between the brachiocephalic artery and the left common carotid artery. C: Between the left common carotid artery and the left subclavian artery. D: In the descending aorta. In all analysis planes, the time-resolved peak velocity values and volume flow rates were computed.
The pressure drop (dP) between an inlet and outlet plane was calculated with the vWERP algorithm, which was derived from the Navier Stokes equations2.
$$dP=-\frac{ 1 }{Q_e} \cdot \left(\frac{\partial }{\partial t} K_e + A_e + V_e \right )$$
Ke, Ae, Ve and Qe are virtual energy and flow values computed with vWERP as previously described2.
Here, the inlet plane is defined by analysis plane A (see Figure 1a) while the outlet plane is defined by planes B-D, respectively. Temporal resolved relative pressure values and the peak pressure values were computed. For statistical comparisons, a Mann-Whitney-U and a double T-test was used. Normal distribution was tested using a Lilifors test.
Results
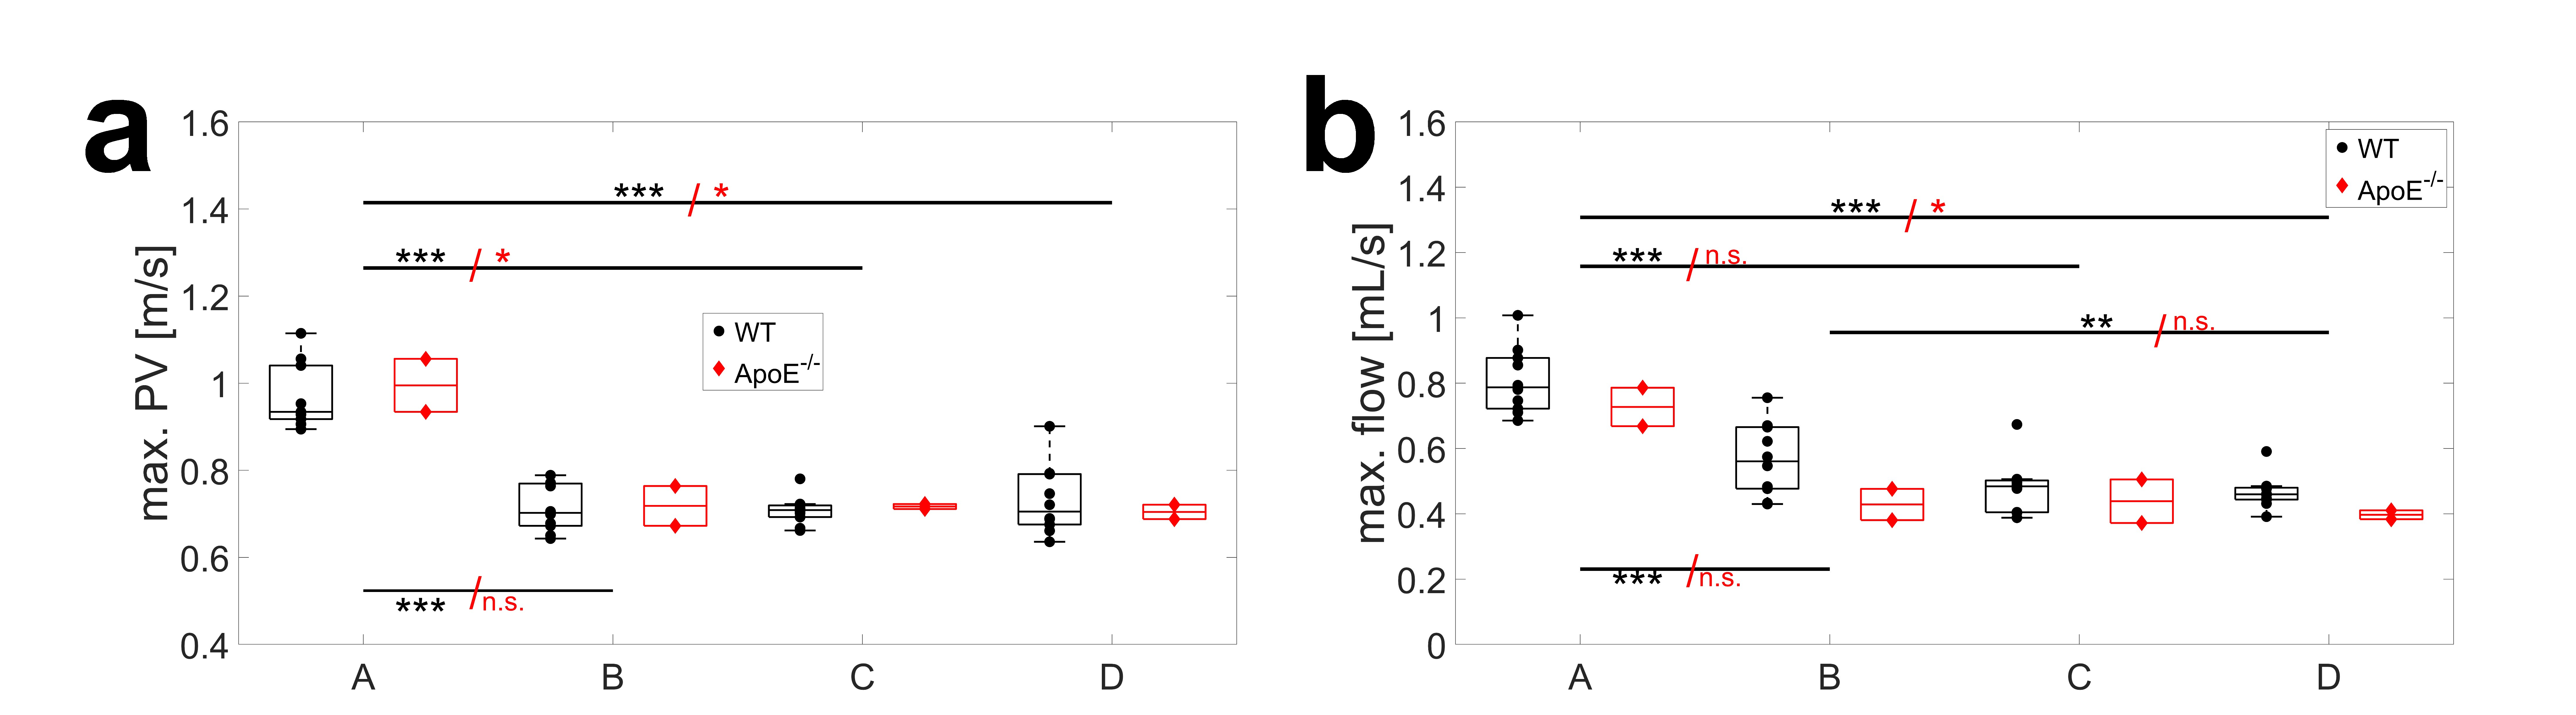
Figure 1b-d displays the time-resolved relative pressure values of 10 WT mice. With increasing plane index, a significant and progressively larger pressure drop is observable. Figure 2a-c shows a comparison of the median pressure values determined in WT mice (including interquartile range IQR) with two measurements in ApoE-/- mice. Figure 2d illustrates the corresponding peak pressure values. Between planes A and B and between B and C, significantly elevated pressure values were observed in comparison to healthy controls (B-A: p=0.0083; C-A: 0.029). In Figure 3, the time resolved peak velocity and flow rate values are shown for both groups. Significant differences of peak velocity and flow values were observed between analysis planes, however, not between the two phenotypes (Figure 4).Discussion and Conclusion
The relative pressure estimation based on 4D flow MRI using vWERP is a promising tool for studying hemodynamic changes in vascular diseases. Its advantages have already been demonstrated in a variety of human applications. In this abstract, we applied the vWERP algorithm for the first time to measurements in the aortic arch of WT and ApoE-/- mice, expanding the range of applications to MRI-microscopy. Preliminary pressure results indicated significant differences between the diseased animal group and the controls while no significant differences were observed for the other flow parameters. This may suggest that pressure could be a more robust parameter to examine hemodynamic changes. In the future, this hypothesis will be tested by applying the algorithm to a larger cohort of atherosclerotic mice to study its potential use as a diagnosis tool for characterization of CVD progression.Acknowledgements
This work was funded by the German Research Foundation (ZE827/15-1, BA 1069/14-1, HA 7152/8-1, HE 7108/3-1, SFB1158/A10) and the National Institutes of Health (NIH 1R01HL149787, 5R21NS122511). DM acknowledges funding from the Knut and Alice Wallenberg Foundation and the European Union (ERC, MultiPRESS, 101075494).References
1. Alireza Vali et al, Magn Reson Med 82(2): 749-762, 2019
2. David Marlevi, Scientific Reports 9: 1375, 2019
3. Zahra Keshavarz‐Motamed et al, J Biomech. 45:1239–1245, 2012
4. David Marlevi et al, Medical Image Analysis 68: 101948, 2021
5. David Marlevi et al, Magn Reson Med 86(6): 3096-3110, 2021
6. Kristina Andelovic, Patrick Winter et al, Biomedicines 9(12): 1856, 2021
7. Yasmeen M. Farra et al, Heart and Circulatory Physiology, 320(6): H2270-H2282, 2021
8. Patrick Winter, Kristina Andelovic et al, JCMR 64(21), 2019
Figures
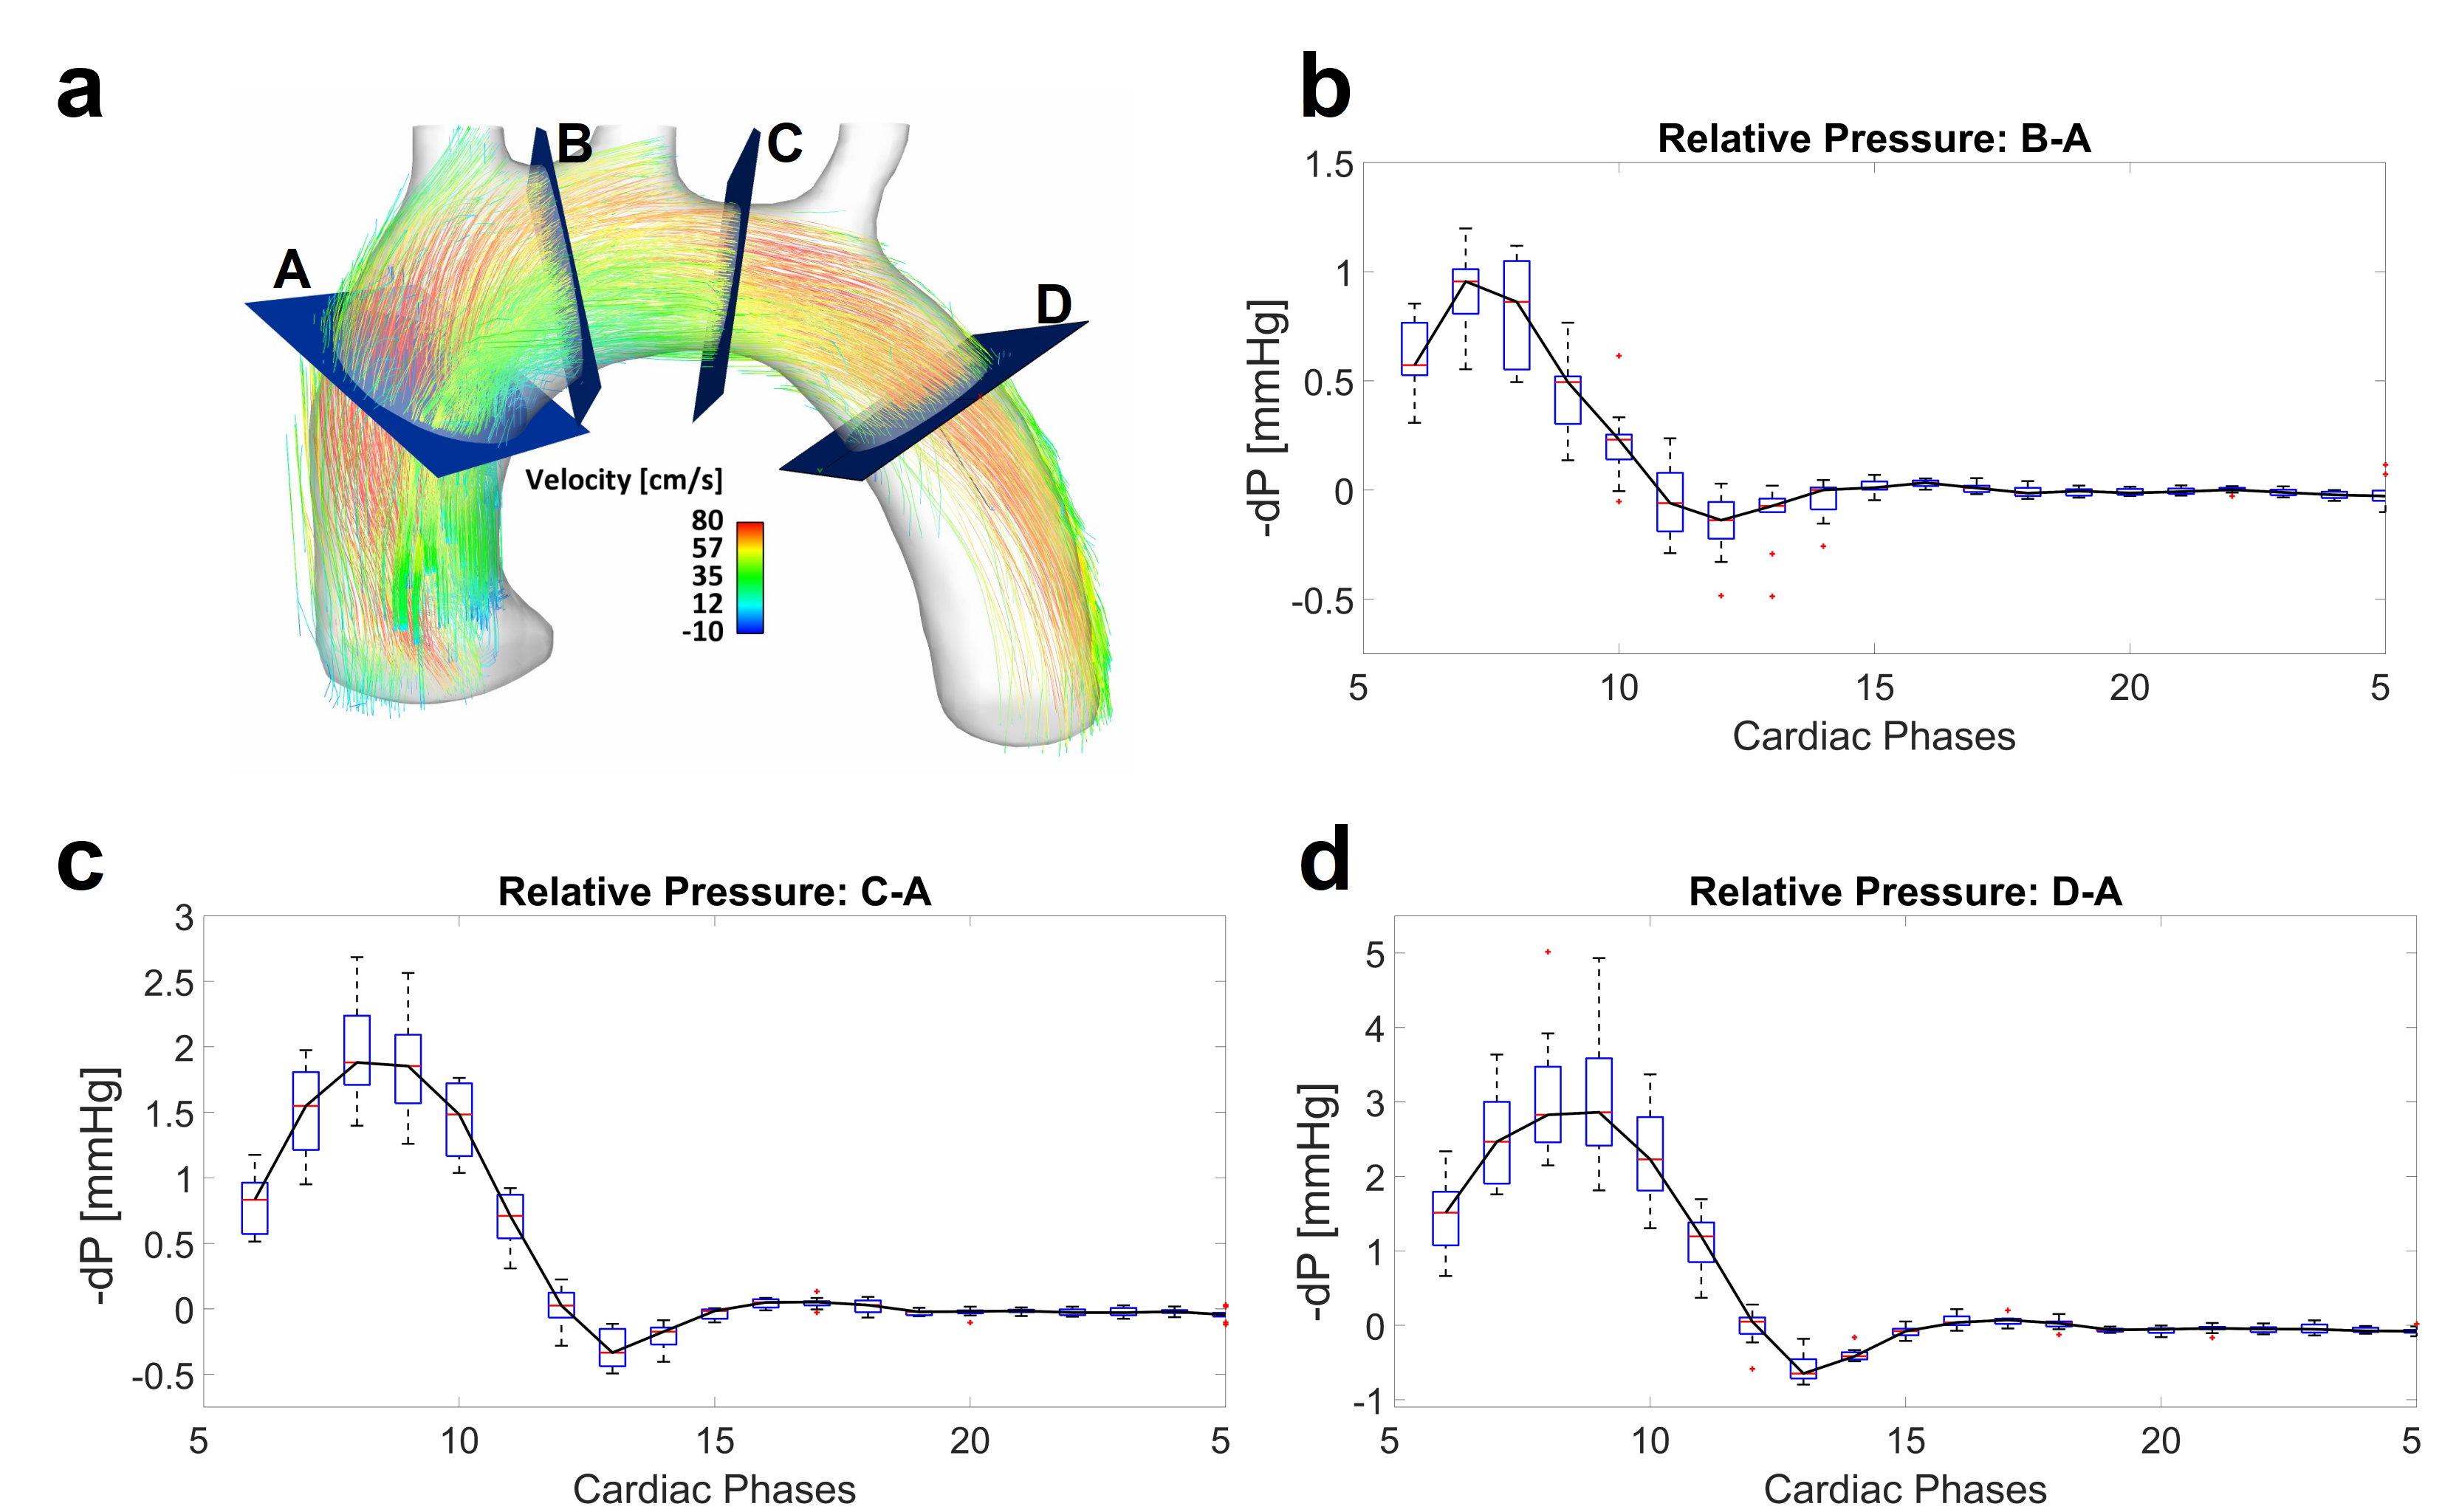
Figure1:
a) Analysis planes used for the relative pressure measurements and streamline presentation of the flow during the peak systole.
b) Time-resolved relative pressure (-dP) between analysis planes A and B. c) Time-resolved relative pressure (-dP) between analysis planes A and C. d) Time-resolved relative pressure (-dP) between analysis planes A and D. For the plots the data of 12-weeks-old WT mice (n=10, female) was used.
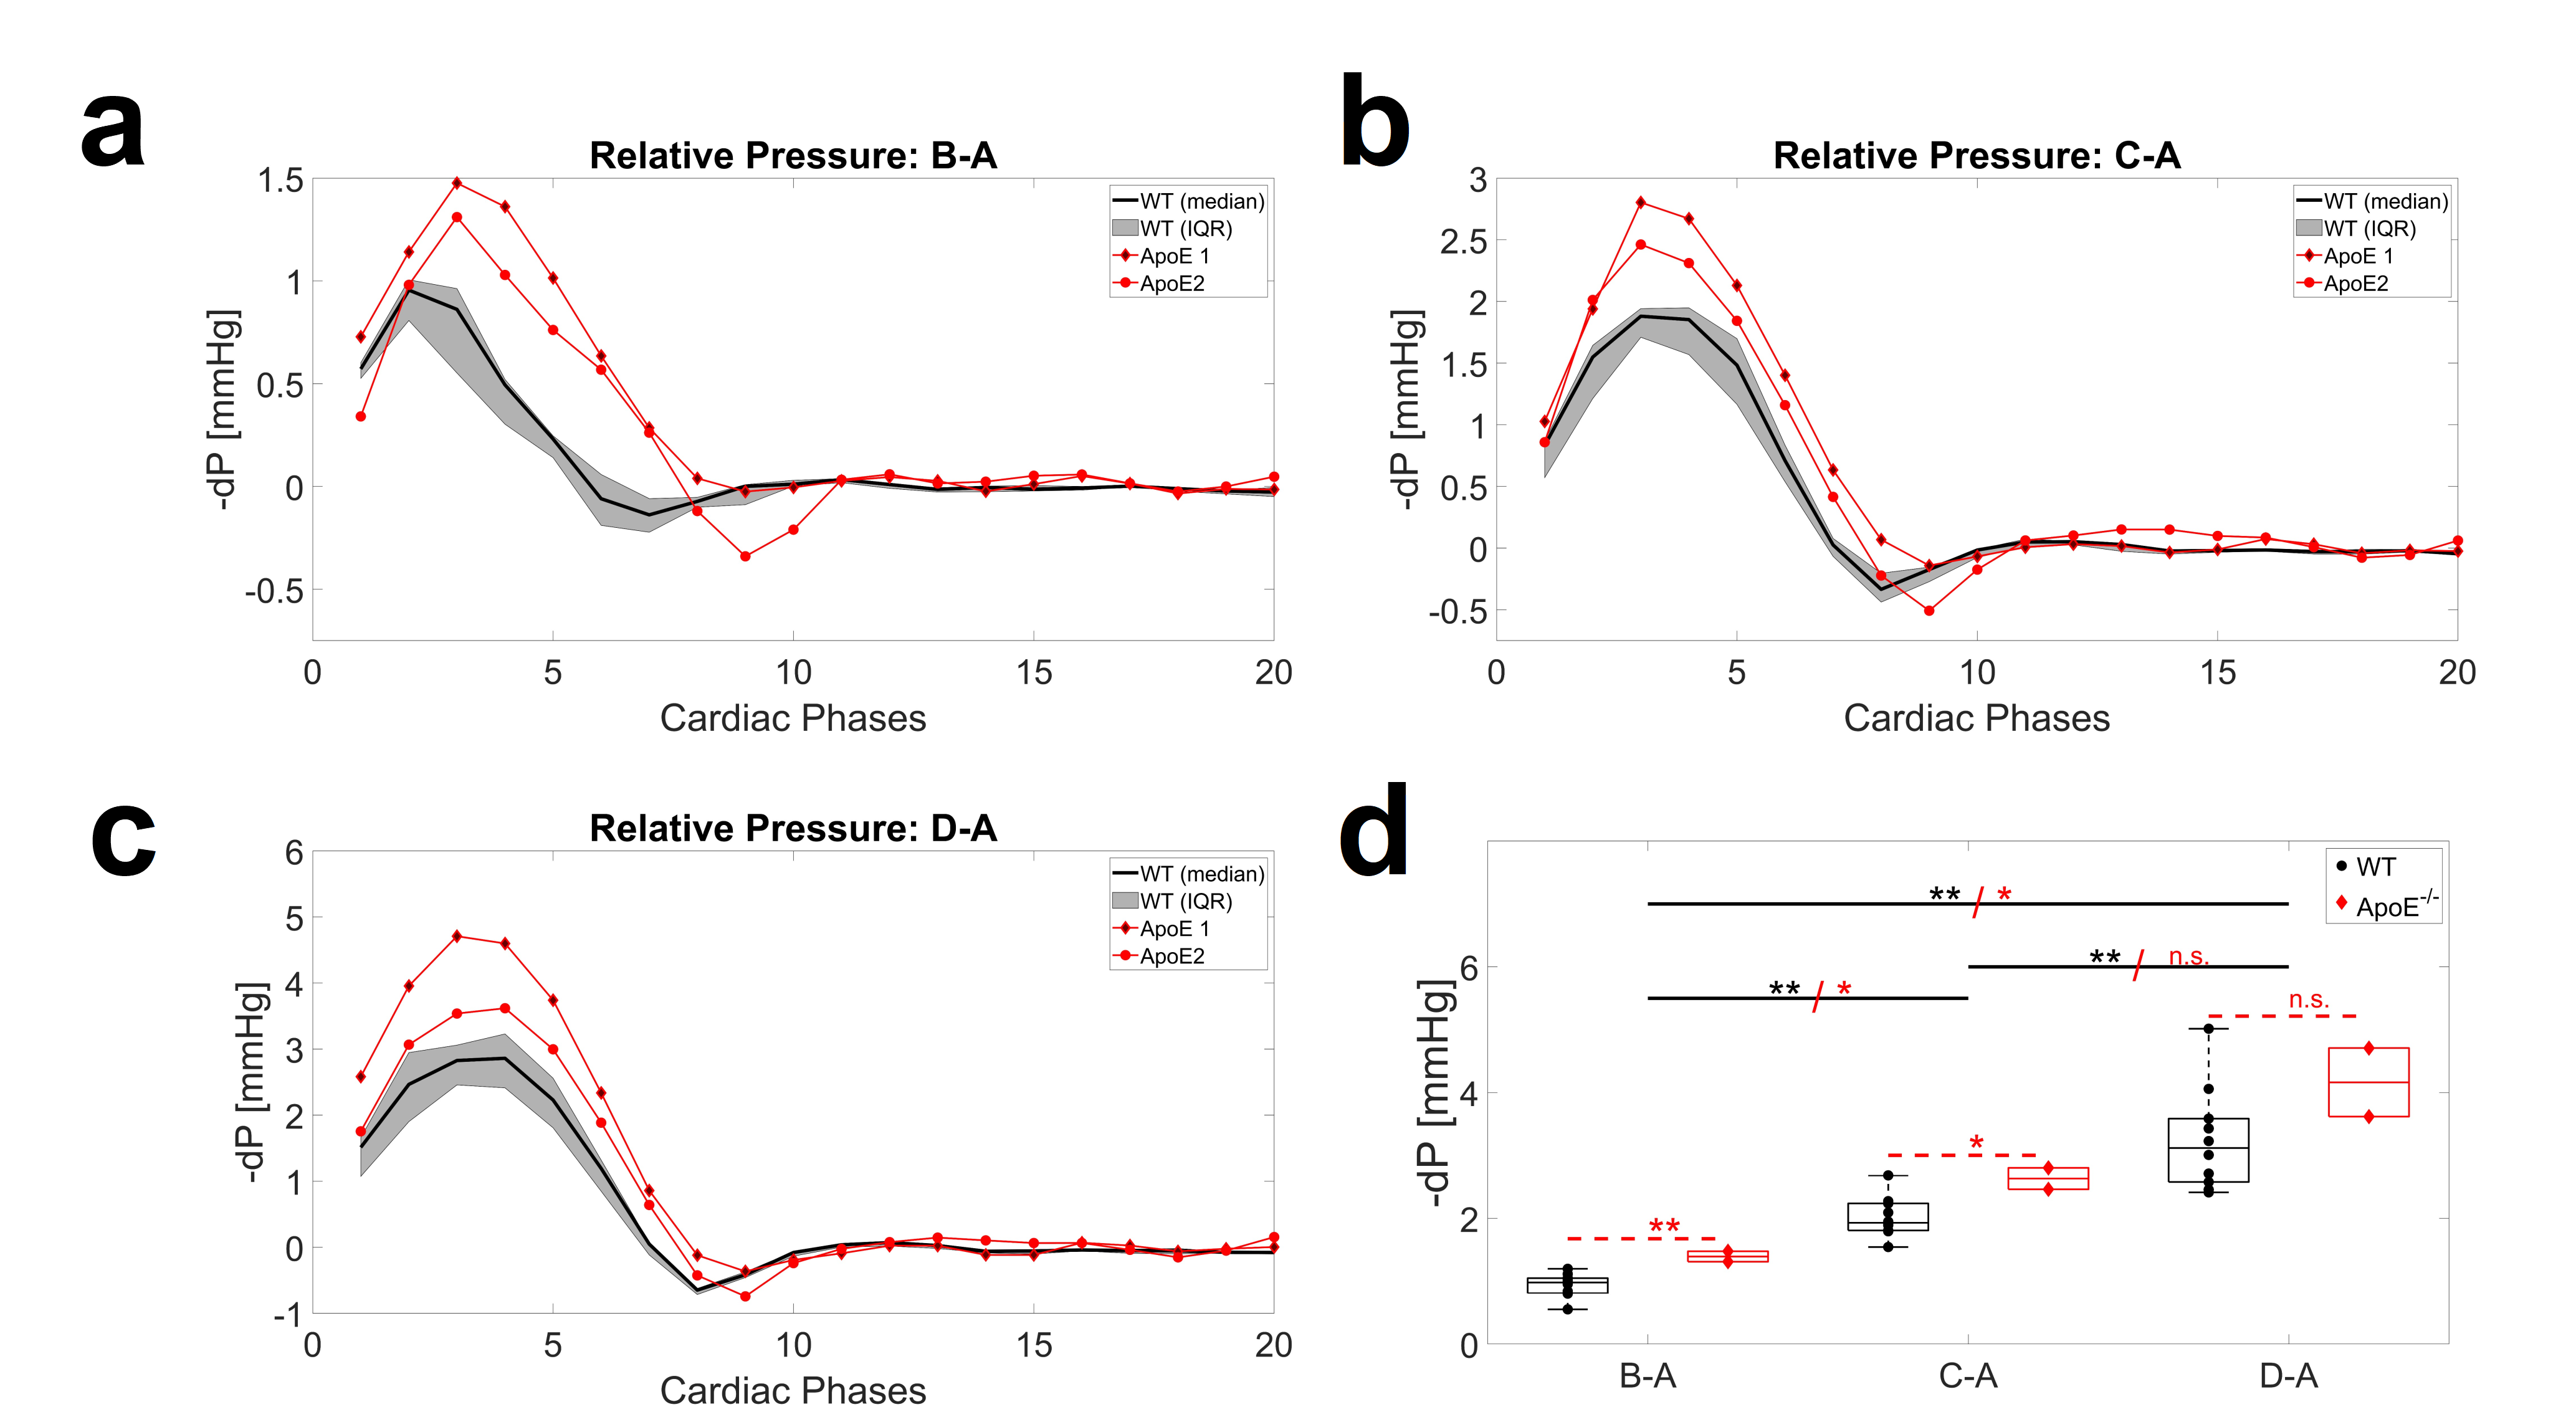
Figure 2:
a-c: Comparison of time resolved pressure values for 10 wild type mice (median and interquartile range IQR) and 2 ApoE-/- knockout mice. d: Maximum pressure drop -dP. In WT mice, significant differences were observed between all three analysis planes. In ApoE-/- mice, significant pressure drops are noticeable between A-B and A-D as well as between A-C and A-D. Pressure values were significantly elevated in comparison to healthy controls between A and B and between A and C. *: p<0.05; **: p<0.01; n.s.: not significant.
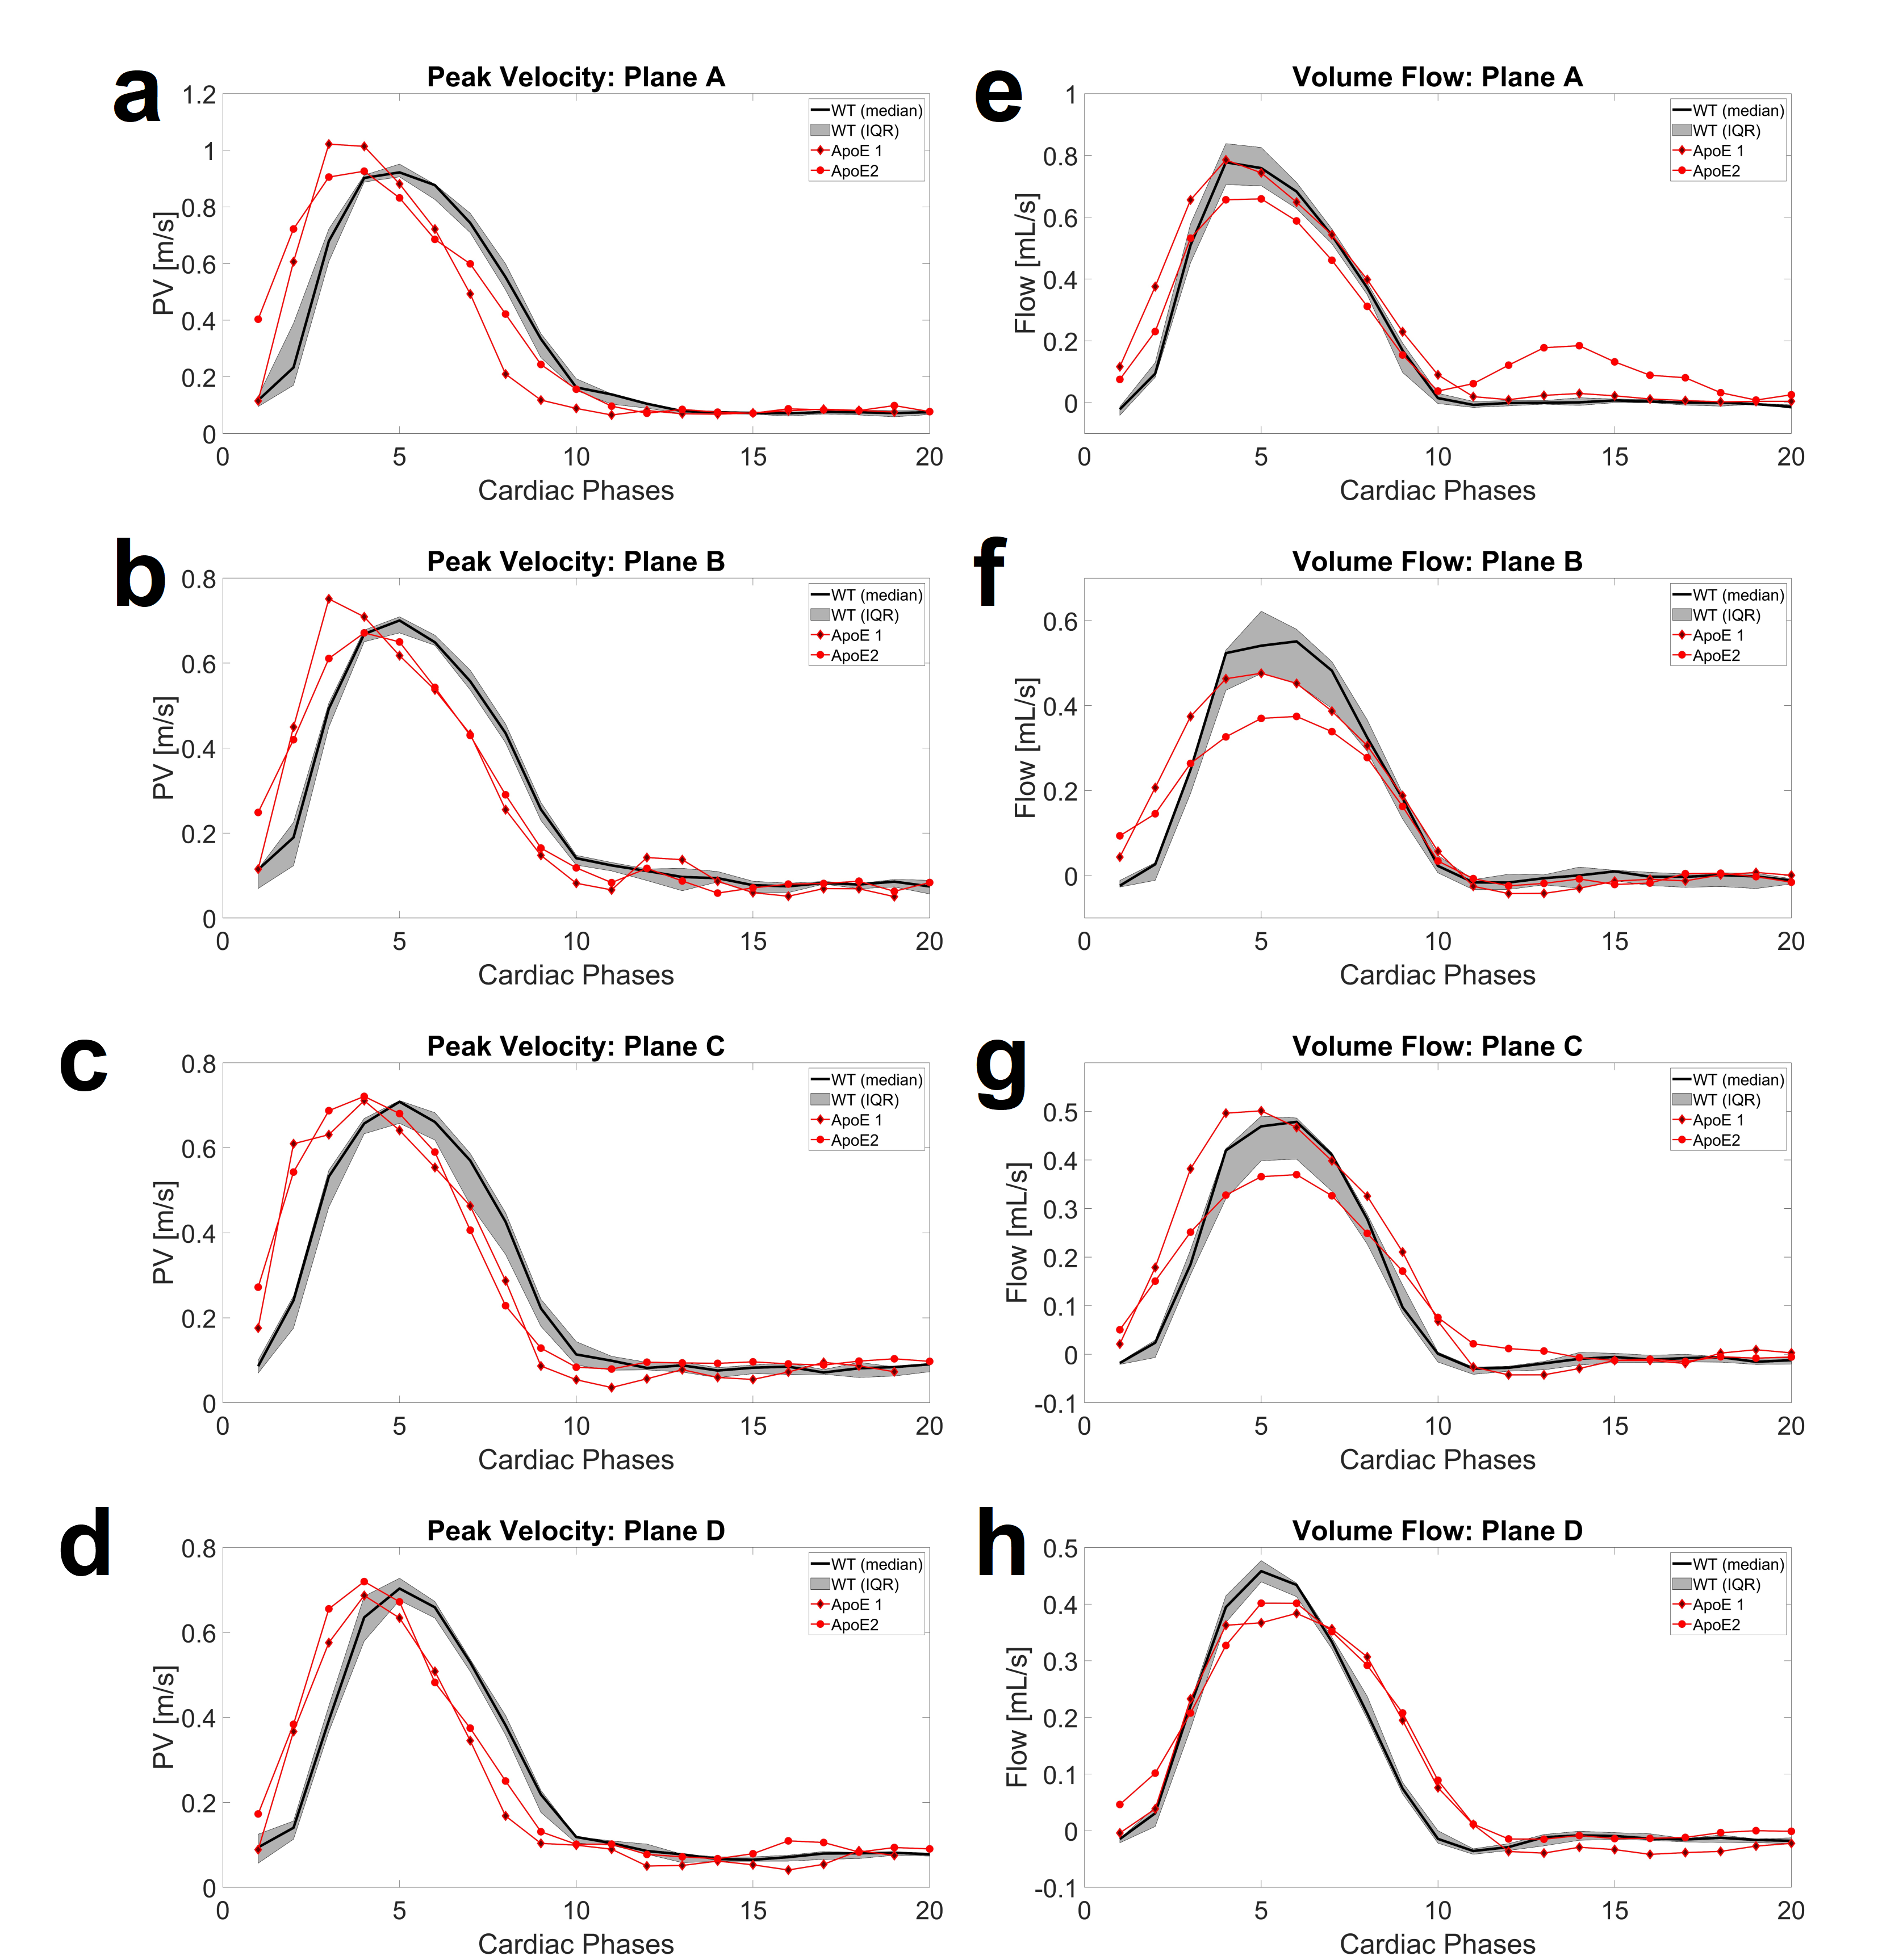
Figure 3: Time resolved peak velocity values (a-d) and volume flow rates (e-g) in all 4 analysis planes for the 10 WT mice (median and IQR) and 2 ApoE-/- mice.