3373
Quantitative Flow Visualization in a Patient-Specific Compliant Type B Aortic Dissection Phantom Using 0.55T MRI1Aerospace and Mechanical Engineering, University of Southern California, Los Angeles, CA, United States, 2Biomedical Engineering Department, Amirkabir University of Technology (Tehran Polytechnic), Tehran, Iran (Islamic Republic of), 3Ming Hsieh Department of Electrical and Computer Engineering, University of Southern California, Los Angeles, CA, United States, 4Division of Vascular Surgery and Endovascular Therapy, Department of Surgery, University of Southern California, Los Angeles, CA, United States, 5Division of Cardiovascular Medicine, University of Southern California, Los Angeles, CA, United States
Synopsis
Keywords: Flow, Velocity & Flow, Low-field
Motivation: PC-MRI allows for both in-vivo and in-vitro evaluation of complex flow patterns. The accuracy and consistency of these measurements needs to be re-evaluated at new low- and mid-field strengths such as 0.55T.
Goal(s): To evaluate flow and velocity patterns using 0.55T PC-MRI to assess the scanner’s suitability for complex flow quantification.
Approach: Using an in-vitro human circulatory setup with a patient-specific type-B aortic dissection phantom to measure complex velocity fields.
Results: Excellent agreement between MRI-obtained and measured flowrates were observed. Complex rotational flow patterns were captured. Results are consistent within slices and experimental conditions, demonstrating the efficacy of 0.55T MRI for flow evaluation.
Impact: This study establishes the viability of 0.55T MRI for phase contrast imaging for three-dimensional velocity field measurements. The findings validate the consistency of flow quantification, and open new avenues for further opportunities on complex flow visualization.
Introduction
Modern mid and low-field MRI scanners (<1 Tesla) have opened up new and promising opportunities for advanced imaging. Numerous studies have demonstrated their successful applications in areas such as lung parenchyma1, near metallic implants2, and cardiac imaging3. However, there is a notable void in the literature regarding the reliability and accuracy of phase contrast (PC) imaging applications. The major difference for PC MRI at low field may be the different noise distribution in the phase of MRI signal at low signal-to-noise ratio (SNR)4. In this study, an in-vitro human circulation system with an elastic patient-specific type B aortic dissection phantom was used in order to generate relatively challenging coherent flow structures (i.e., helical flow)5. The goal of this study was to investigate whether a 0.55T scanner can be used for three-dimensional quantitative visualization of the complex flow field in patient-specific compliant type B aortic dissection phantoms.Methods
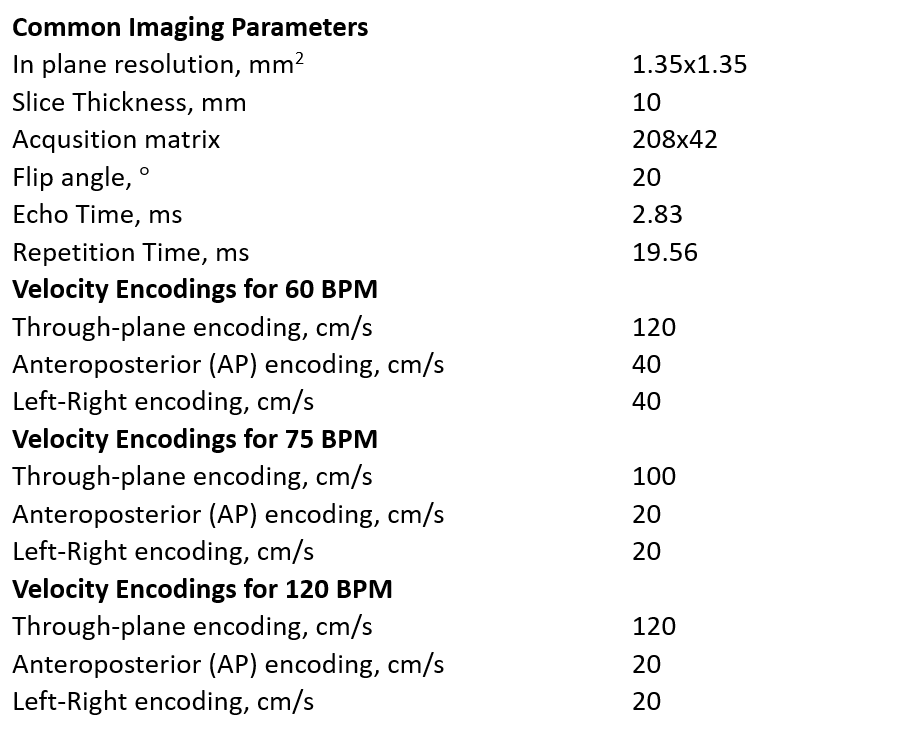
Experiments were conducted using an in-vitro physiologically accurate human circulatory setup6, that is connected to a patient-specific type B aortic dissection phantom5, 7 (Figure 1). This phantom is fabricated with an elastic material and features a descending aorta region composed of both the true and false lumens, separated by an approximately 2 mm thick intimal flap. The intimal flap replicates the aortic tears found in the patient's aorta7. The flow was generated using the Vivitro Super Pump system, which produces physiological flow waveforms similar to those of the human left ventricle. The volume flow rate measured by MRI was cross-verified with a Doppler-based flowmeter (T402, Transonic Systems Inc., Ithaca, NY).Imaging was performed using a whole body 0.55T MRI scanner (prototype MAGNETOM Aera; Siemens Healthineers, Erlangen, Germany) equipped with high-performance shielded gradients (45mT/m amplitude, 200T/m/s slew rate). Images were acquired using phase contrast (PC) sequences (Siemens BEAT_FQ) with velocity encoding in three different directions and retrospectively gated triggering matched to the pump frequency. All MRI sequences were performed with identical parameters, except for velocity encoding, which was tailored depending on the pump frequency (heart rate) and the velocity encoding direction (see Table 1 for imaging parameters). Experiments were conducted at three different heart rates (60, 75, and 120 bpm) while keeping the cardiac output at 3.5 L/min. Flow rates were measured in ascending aorta, true lumen, and false lumen by manual segmentation of the magnitude images in the axial slices. The volumetric flow waves were calculated from the through-plane velocity encoded images using Segment software (Medviso AB, Lund, Sweden). Three-dimensional velocity vectors were extracted from phase images using GTFlow software (Gyro Tools), and further analyses on the flow field were performed on Tecplot 360.
Results
PC measured flow rates at the aortic input were consistent at 3.51±0.15 L/min for all heart rates. Analysis of the descending aorta slices revealed a consistent and unidirectional oscillatory flow pattern in the true lumen, as expected. Flow in the false lumen was bidirectional and highly oscillatory, as shown in Figure 2. Net flow was calculated at five consecutive slices in the descending aorta. Flow rotations at the axial slices were quantified using the in-plane component of vorticity8. Tangential velocity vectors in these slices were also included for the qualitative analysis of the flow rotation in these slices (see Figure 3). The vorticity contours suggest that rotational flows are predominantly present in the false lumen. The flow vectors revealed that fluid particles move out of the imaging plane while rotating, forming a helical flow pattern. This helical flow behavior, as depicted by the streamlines in Figure 4, was consistently observed in the false lumen across all conditions.Discussion
This proof of concept study demonstrates the applicability of a 0.55T MRI for the visualization and quantification of complex flow fields. One notable observation was the excellent agreement between the volume flow rates measured by MRI and ultrasound-based flowmeter. Another interesting finding is the detailed visualization of flow rotations, especially within the false lumen. Helical flow structures that have been observed in previous studies using 1.5T or 3T MRI9, 10, were also captured in our study.Conclusions
This study demonstrates the potential of 0.55T MRI scanners for three-dimensional velocity field measurements, despite the limited SNR. It underlines the reliability of low-field scanners for detailed flow quantification and highlights their efficacy in capturing complex flow dynamics.Acknowledgements
We acknowledge grant support from National Science Foundation (Award #1828736), and research support from Siemens Healthineers. We thank Sophia Cui for helpful discussions and MRI protocol assistance.References
1. Azour L, Condos R, Keerthivasan MB, et al. Low-field 0.55 T MRI for assessment of pulmonary groundglass and fibrosis-like opacities: Inter-reader and inter-modality concordance. J European Journal of Radiology. 2022;156:110515.
2. Khodarahmi I, Brinkmann IM, Lin DJ, et al. New-generation low-field magnetic resonance imaging of hip arthroplasty implants using slice encoding for metal artifact correction: first in vitro experience at 0.55 T and comparison with 1.5 T. J Investigative radiology. 2022;57:517.
3. Campbell‐Washburn AE, Varghese J, Nayak KS, et al. Cardiac MRI at low field strengths. J Journal of Magnetic Resonance Imaging. 2023.
4. Gudbjartsson H and Patz S. The Rician distribution of noisy MRI data. Magn Reson Med. 1995;34:910-914.
5. Tsinober A and Levich E. On the helical nature of three-dimensional coherent structures in turbulent flows. Phys Lett A. 1983;99:321-324.
6. Pahlevan NM and Gharib M. A bio-inspired approach for the reduction of left ventricular workload. J PloS one. 2014;9:e87122.
7. Aghilinejad A, Wei H, Bilgi C, et al. Framework Development for Patient-Specific Compliant Aortic Dissection Phantom Model Fabrication: Magnetic Resonance Imaging Validation and Deep-Learning Segmentation. J Journal of Biomechanical Engineering. 2023;145:091010.
8. Shercliff J. Simple rotational flows. Journal of Fluid Mechanics. 1977;82:687-703.
9. Markl M, Frydrychowicz A, Kozerke S, et al. 4D flow MRI. J Magn Reson Imaging. 2012;36:1015-1036.
10. Ramaekers MJFG, Westenberg JJM, Venner MFGHM, et al. Evaluating a Phase-Specific Approach to Aortic Flow: A 4D Flow MRI Study. J Magn Reson Imaging. 2023.
Figures
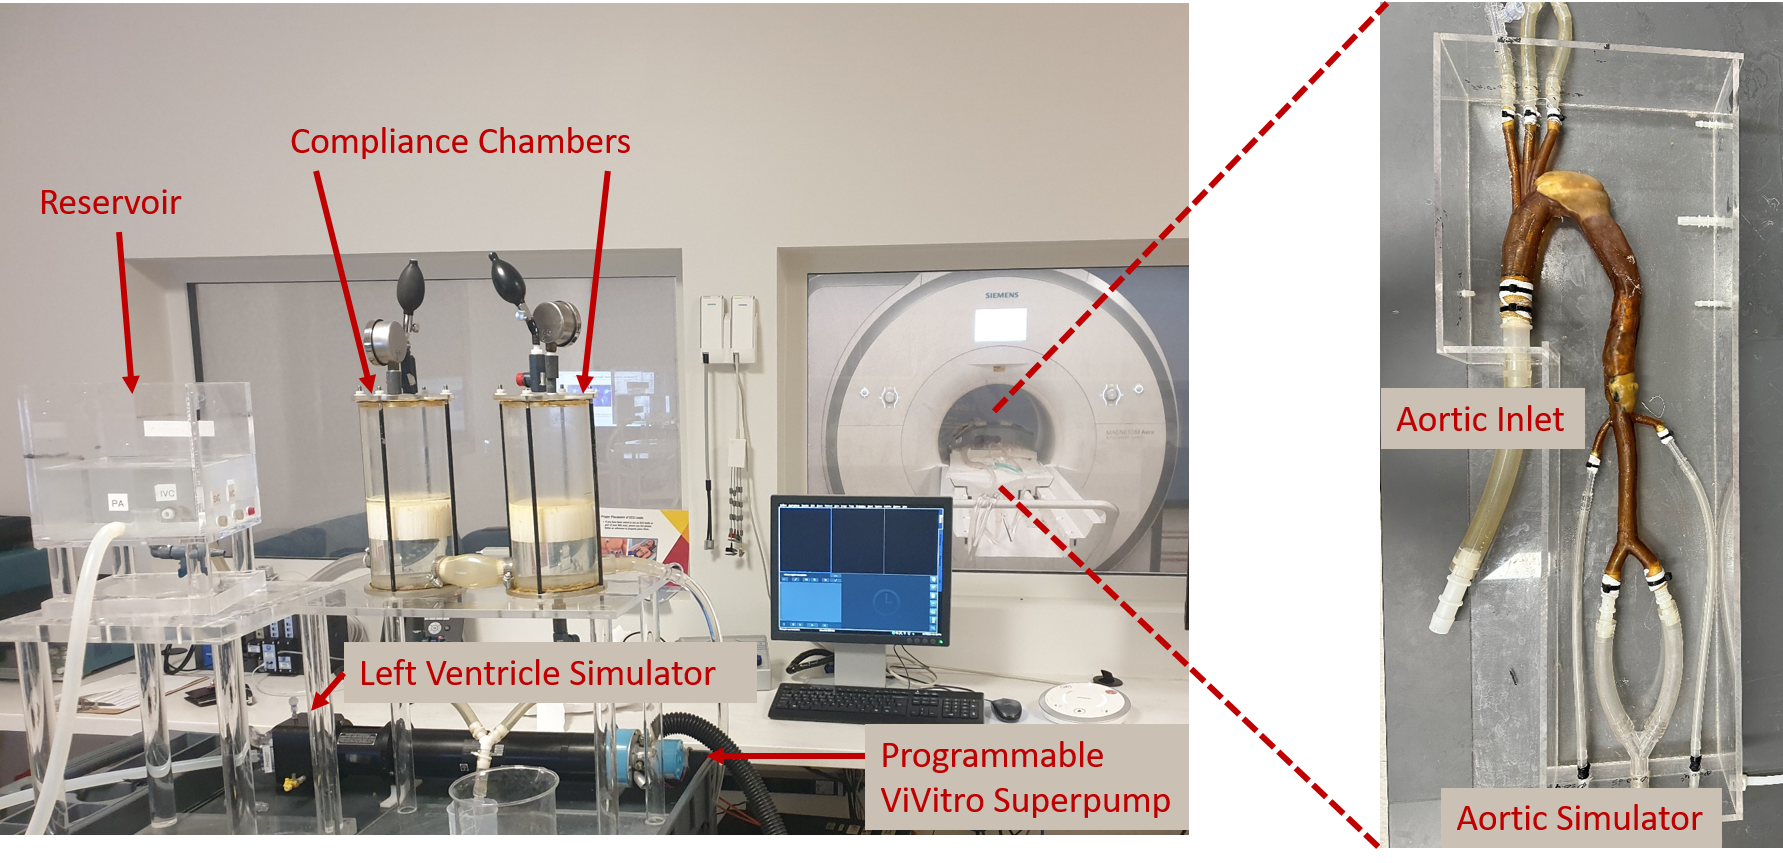
Figure 1: Experimental Setup. (Left) The in-vitro human circulatory system that includes a left ventricular simulator, a programmable pump, two compliance chambers, and a reservoir. (Right) a close-up image of the type B dissected aortic phantom that is placed into the experimental system.
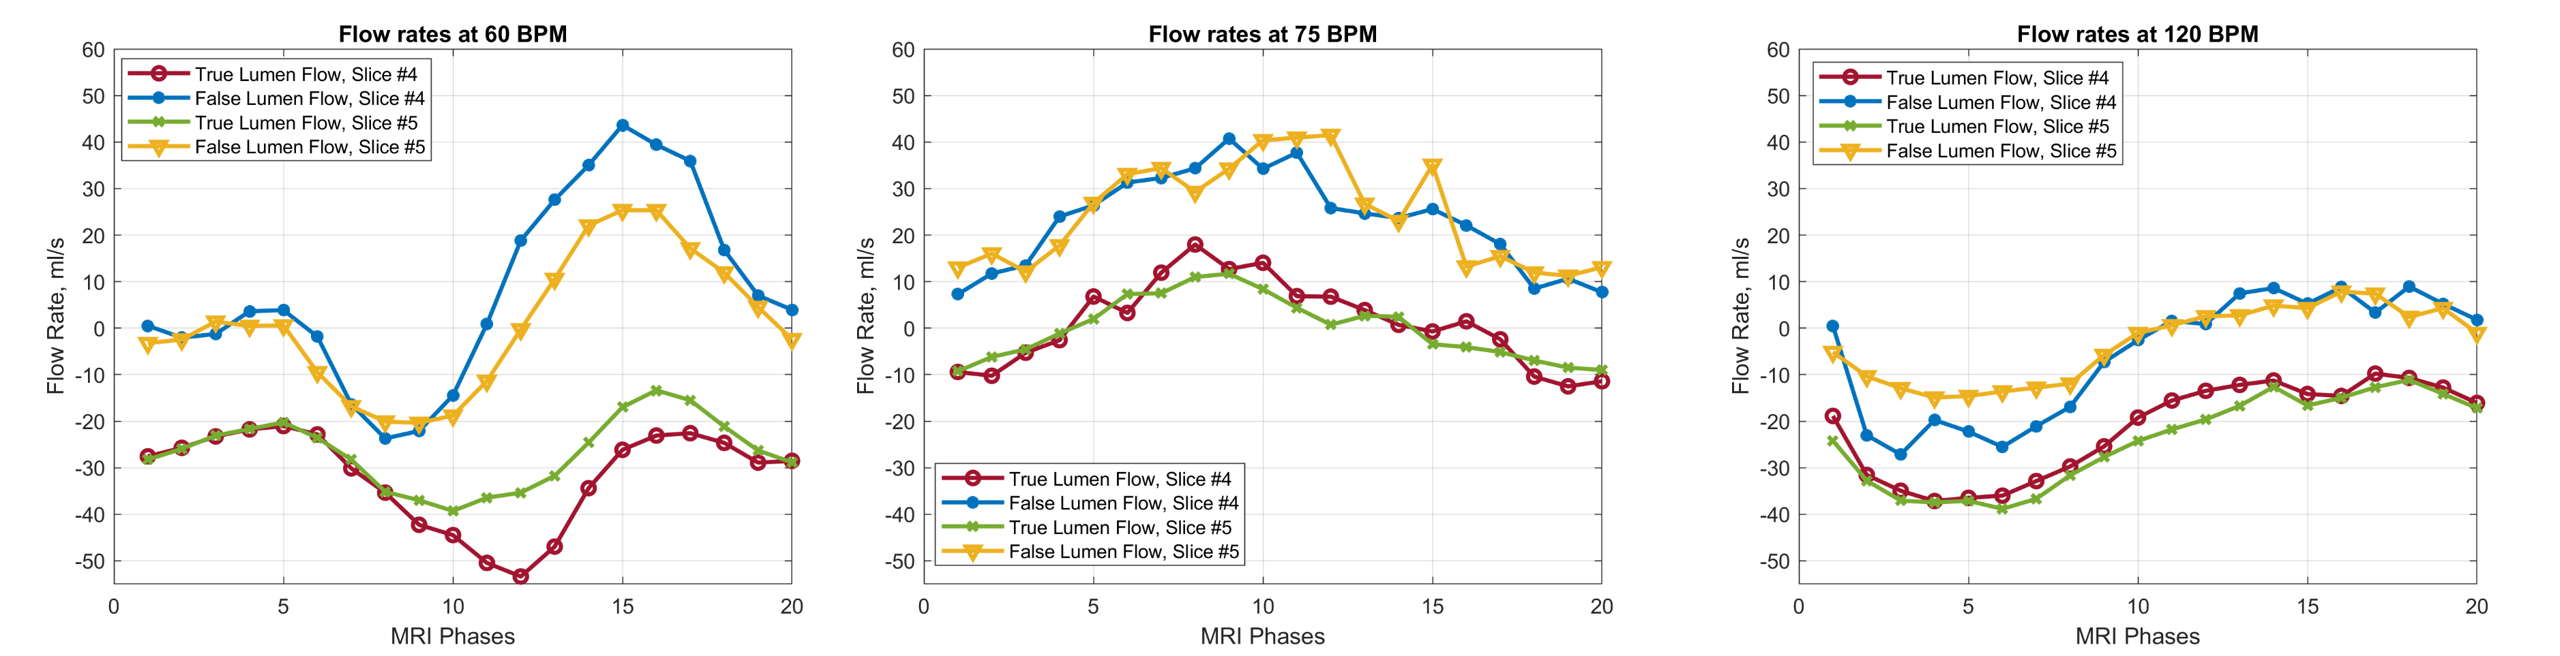
Figure 2: The flow rates passing through the true and false lumen slices at three different heart rates. Flowrates at different slices are observed to be at similar values for both true and false lumens for all heart rates. We observe MRI results satisfy the mass conservation within the slices, ostensibly the net flowrate passing through the descending aorta.
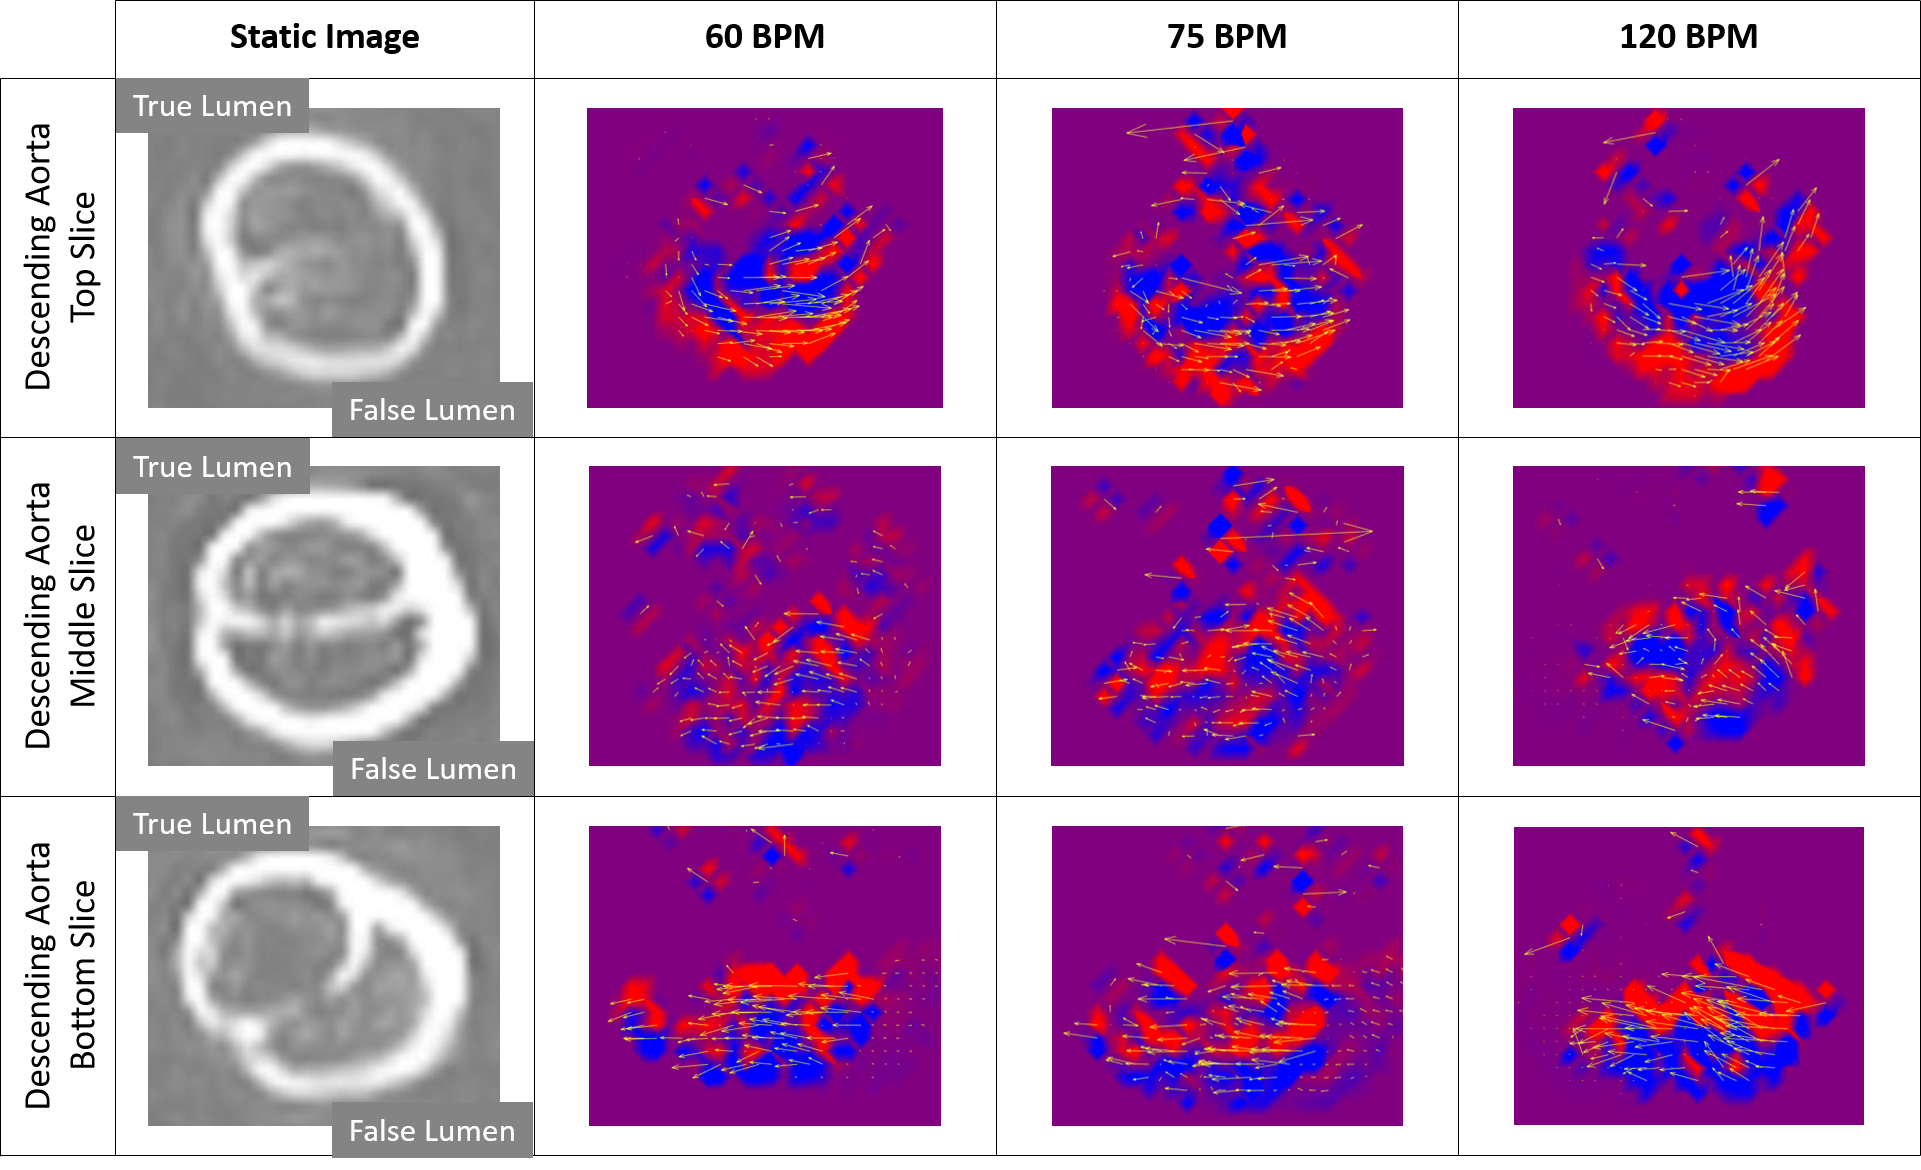
Figure 3: Axial rotation of the flow field. Visualization of the out-of-plane vorticity and the tangential flow vectors at three different slices of the descending aorta. The rotating vectors move out of the imaging plane and create a helical-type flow. (Left) The static images show the internal structures (intimal flap and aortic tears) of the aortic phantom; true and false lumens of the phantom are annotated for clarity.
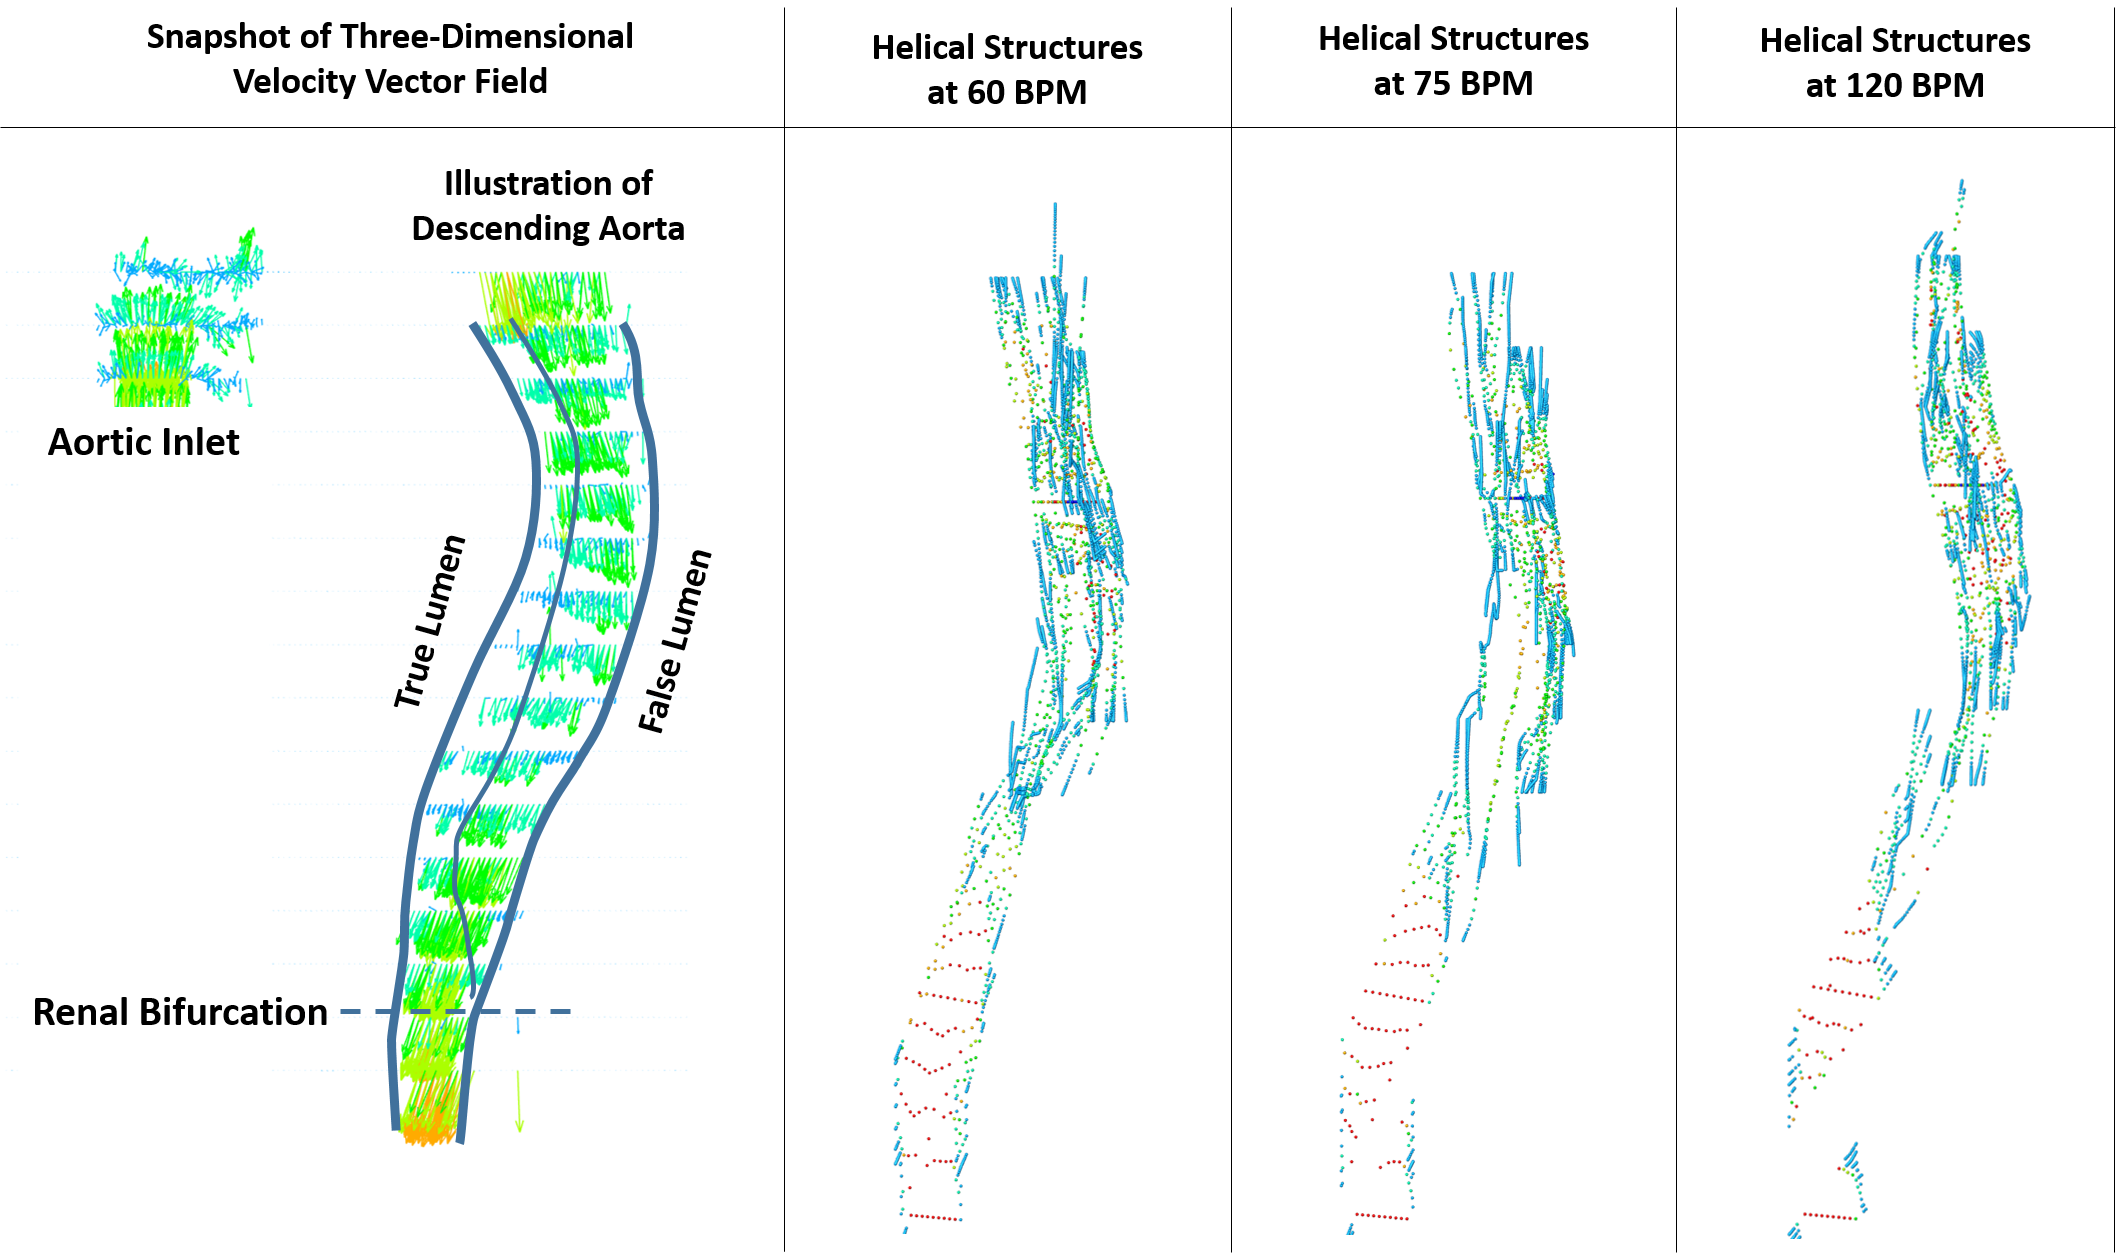
Figure 4: Visualization of the overall flow field and the distinct flow structures. (Left) Illustration of the type B dissected aortic phantom and visualization of the velocity vector field. (Right) Stream traces passing through the false lumen of the phantom that show helical coherent structures at the experimental conditions. Three-dimensional velocity vectors and stream traces are colored based on their local velocity magnitude.