3370
Optimizing Pulmonary Vascular Resistances in Single Ventricle Children at Glenn Physiology using Computational Fluid Dynamics1Department of Radiology, School of Medicine, University of Colorado, Aurora, CO, United States, 2Department of Cardiology, University of Colorado and Children's Hospital Colorado, Aurora, CO, United States, 3Department of Surgery, School of Medicine, University of Colorado, Aurora, CO, United States, 4Department of Surgery, University of Colorado and Children's Hospital Colorado, Aurora, CO, United States, 5Department of Critical Care, University of Colorado and Children's Hospital Colorado, Aurora, CO, United States, 6Department of Radiology, University of Colorado and Children's Hospital Colorado, Aurora, CO, United States
Synopsis
Keywords: Flow, Cardiovascular, Catheterization, Computational Fluid Dynamics, Lumped Parameter Model, Pulmonary Vascular Resistance, Glenn Physiology, Simulation of Fontan Surgery
Motivation: Individual pulmonary vascular resistances (PVR) of the left and right lung are needed to perform in-silico virtual cardiac surgery to improve Fontan conduit designs, yielding more balanced blood flow to the lungs.
Goal(s): Predict patient-specific PVR of both lungs using clinical flow and pressure data acquired from cardiovascular magnetic resonance exams and catheterizations.
Approach: Utilize computational fluid dynamics (CFD) and lumped parameter (LP) models to iteratively optimize the PVR of both lungs.
Results: There is excellent correlation between the PVR estimates of the CFD and LP models, and both models fit to clinical outlet flow and pressure with less than 10% error.
Impact: Accurate prediction of individual lung resistances is needed for patient-specific in-silico virtual cardiac surgery to optimize the design of the Fontan conduit. This design could then be implemented by surgeons to provide more balanced pulmonary blood flow in Fontan patients.
Introduction
Severe cases of congenital heart disease (CHD) involving single ventricle cardiac malformations are typically treated via staged surgical palliation that establishes a sequential arrangement of the systemic and pulmonary circulation via the single functional ventricle. Staged surgical palliation typically consists of three surgeries: (1) the Norwood procedure, (2) the Glenn procedure, and (3) the Fontan procedure. The Fontan operation completes a total cavopulmonary connection (TCPC), where the superior and inferior venae cavae are joined with the left and right pulmonary arteries (LPA, RPA)1,2. Despite this procedure, patients continue to experience long-term complications, some of which are associated with the hemodynamic performance of the Fontan conduit3. To address this, it is crucial to ensure an optimal Fontan conduit design that results in more balanced pulmonary blood flow. One approach to optimizing the conduit is to develop a patient-specific digital twin, which can be used to simulate various configurations of the conduit. This, in turn, requires an accurate and efficient estimate of the pulmonary vascular resistance (PVR) of each lung at the Glenn stage.Methods
For this study, 16 patients with Glenn physiology (10 M, ages 2-5 yrs) who underwent a Cardiovascular Magnetic Resonance (CMR) exam and catheterization (CATH) were retrospectively identified. For each patient, a 3D computational fluid dynamics (CFD) model of the Glenn pathway was created from the CMR images (Figure 1), prescribing the CMR-measured blood flow as the inlet boundary condition, along with a resistance boundary condition for each outlet. An optimization pipeline was then developed to iteratively optimize the PVR of each lung via successive CFD simulations, using the simplex method with a cost function minimizing the flow error at the outlets, relative to CMR measured flow, and the pressure error at the inlet, relative to CATH measured pressure. Additionally, a 0D lumped parameter (LP) model was created to perform the same optimization procedure with a significantly reduced computational overhead.Results
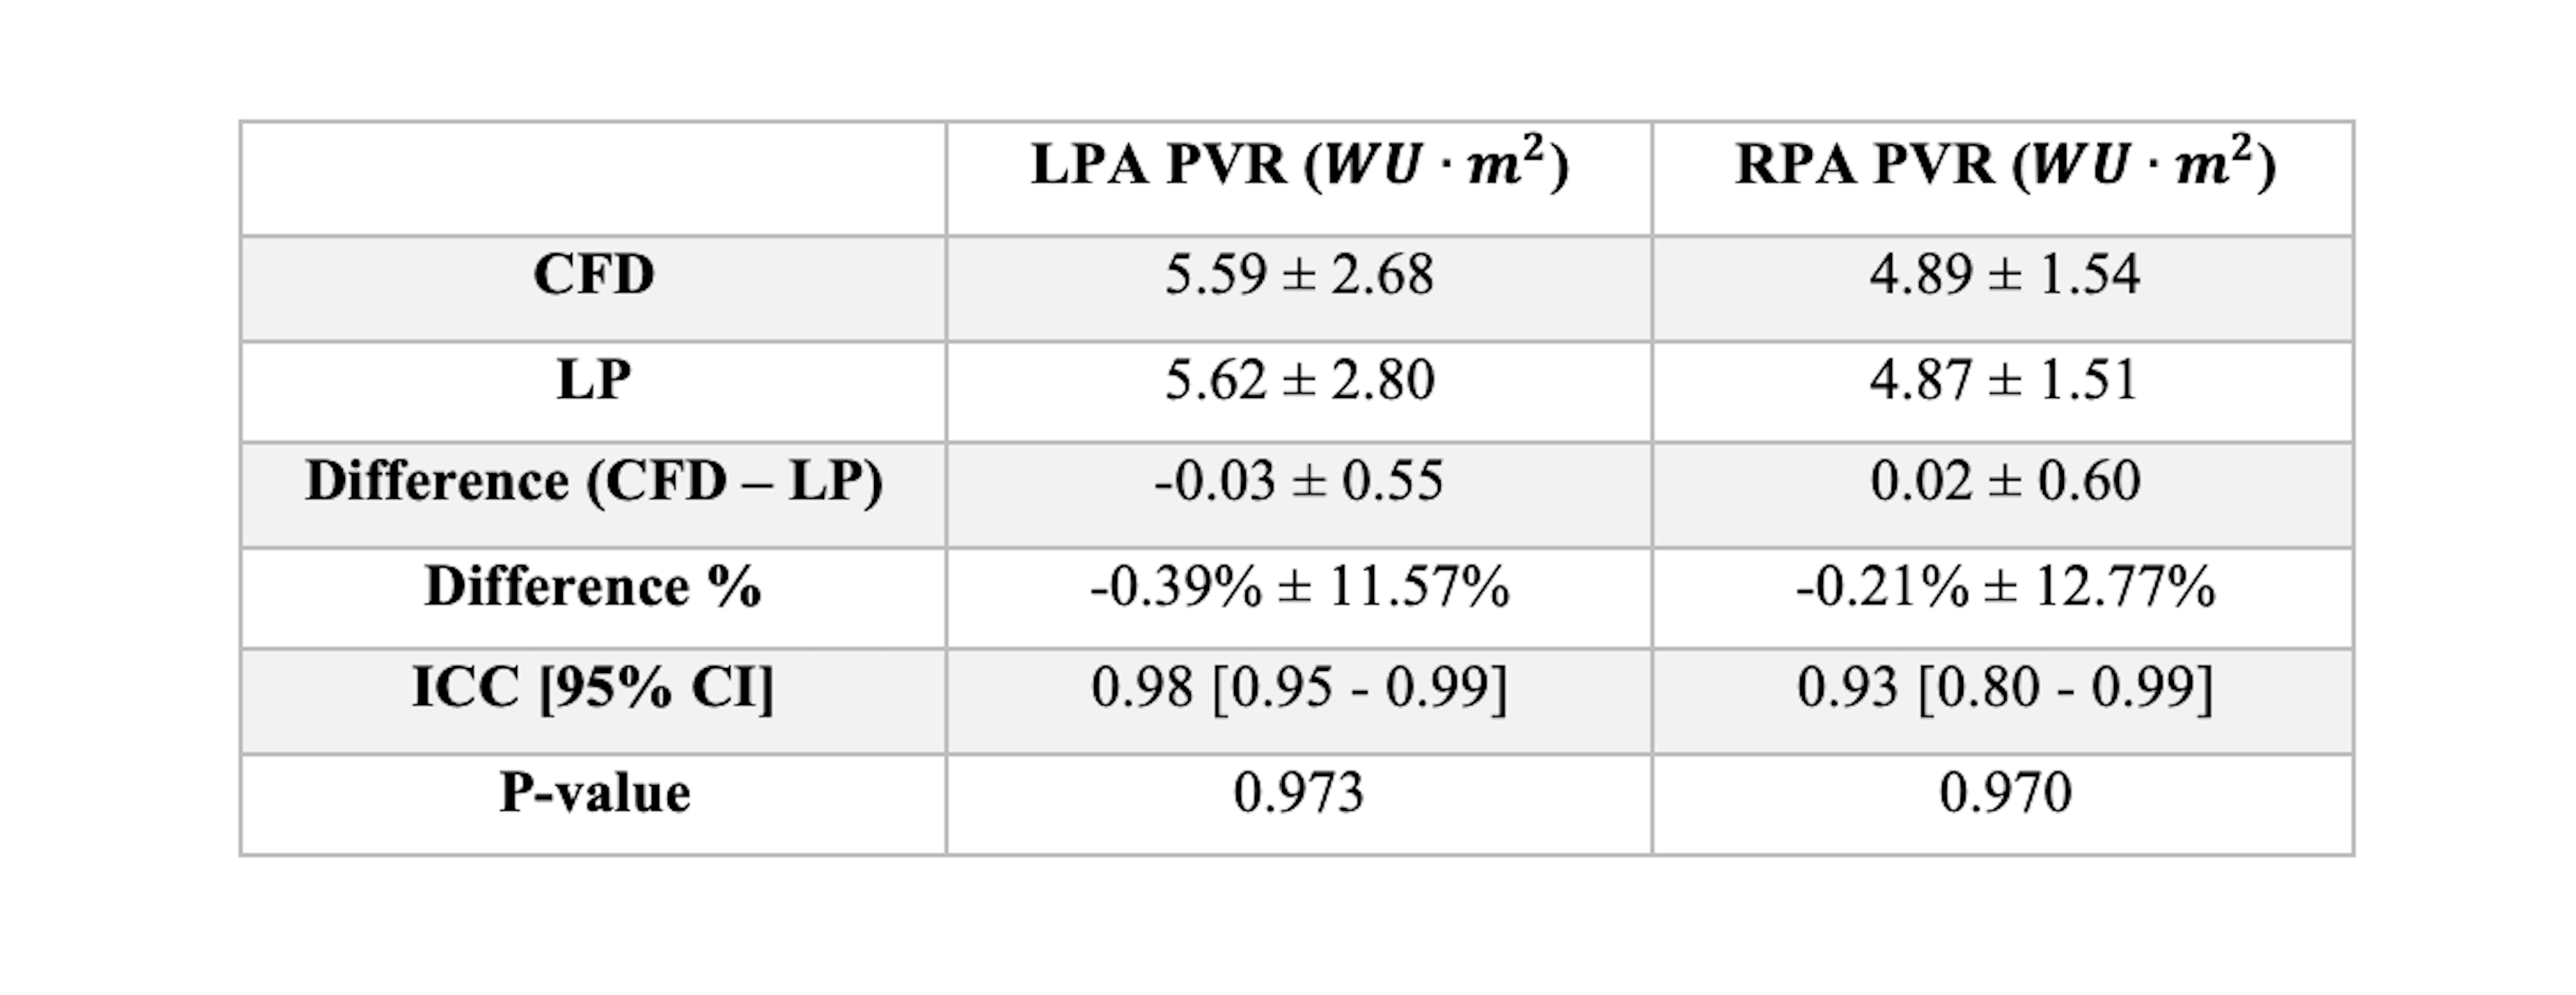
After running the optimization procedure on all 16 patients, the mean outlet flow difference between CMR and the CFD model was -1.67% ± 5.16% for the left lung and 1.02% ± 3.95% for the right lung, while the difference between CMR and the LP model was -1.50% ± 4.67% for the left lung and 0.64% ± 3.72% for the right lung. Mean outlet pressure differences between CATH and CFD were 4.02% ± 13.15% and 2.72% ± 6.58% for the left and right lung, respectively, while the pressure differences between CATH and LP were 6.61% ± 14.69% and 5.41% ± 7.15% (Table 1). The mean PVR estimates of the CFD model were 5.59 ± 2.68 WU·m2 for the left lung and 4.89 ± 1.54 WU·m2 for the right lung, with a mean total indexed PVR of 2.43 ± 0.69 WU·m2, while the mean LP model estimates were 5.62 ± 2.80 WU·m2 for the left lung and 4.89 ± 1.51 WU·m2 for the right lung, with a mean total indexed PVR of 2.44 ± 0.76 WU·m2 (Table 2, Figure 2). When comparing the estimated PVR ratios with the inverse CMR outlet flow ratios, we find excellent correlation for both models (ICC = 0.96 [0.88-0.98], p = 0.885 (CFD), 0.915 (LP)). However, neither model’s total PVR estimate correlates well with the CATH-based PVR using the Fick principle (CFD: ICC = 0.188 [-0.17-0.57], p = 0.019, LP: ICC = 0.341 [-0.09-0.69], p = 0.023).Discussion
Overall, the PVR estimation pipeline, using either the CFD and LP model, resulted in relatively accurate outlet flow and pressure when compared with CMR measured blood flow (Figure 3) and CATH measured pressure. The actual PVR estimates for the two models show excellent agreement as well, and the corresponding PVR ratios correlate well with CMR flow ratios. The CFD and LP models also show good agreement in simulated flow and pressure data and arrive at similar PVR estimates. This suggests the LP model can potentially be used as a good starting point for the optimization procedure, which can subsequently be refined via the CFD model. The total PVR estimates, however, showed poor agreement with the CATH-based PVR computed via the Fick principle, which is conjectured to be due to the difference in CMR and CATH pulmonary flow measurements4,5.Conclusion
Through this optimization pipeline, it is possible to quickly and accurately estimate the PVR of individual lungs, which provides the prerequisite step for performing virtual Fontan surgical planning. Further study is needed, however, to investigate the discrepancies between the estimated PVR and the CATH-based PVR.Acknowledgements
This project is funded and supported by a grant from the National Institute of Health-National Heart, Lung, and Blood Institute (R01HL149807).References
1. Fontan, F., Baudet, E., Surgical repair of tricuspid atresia. Thorax, 1971; 26(3): 240-2482. de Leval, M., et al., Total cavopulmonary connection: a logical alternative to atriopulmonary connection for complex Fontan operations. Experimental studies and early clinical experience. J Thorac Cardiovasc Surg, 1988. 96(5): p. 682-95.
3. Khiabani, R., et al., Exercise capacity in single-ventricle patients after Fontan correlates with haemodynamic energy loss in TCPC. Heart, 2015. 101(2): p. 139-43.
4. Arar, Y., et al., Fick versus flow: a real-time invasive cardiovascular magnetic resonance (iCMR) reproducibility study. J Cardiovasc Magn Reson, 2021. 23(1): p. 95.
5. Schramm, J., et al., Cardiac magnetic resonance haemodynamics in paediatric heart transplant patients: fick oximetry versus cardiac magnetic resonance phase contrast. Cardiol Young, 2023: p. 1-6.
Figures
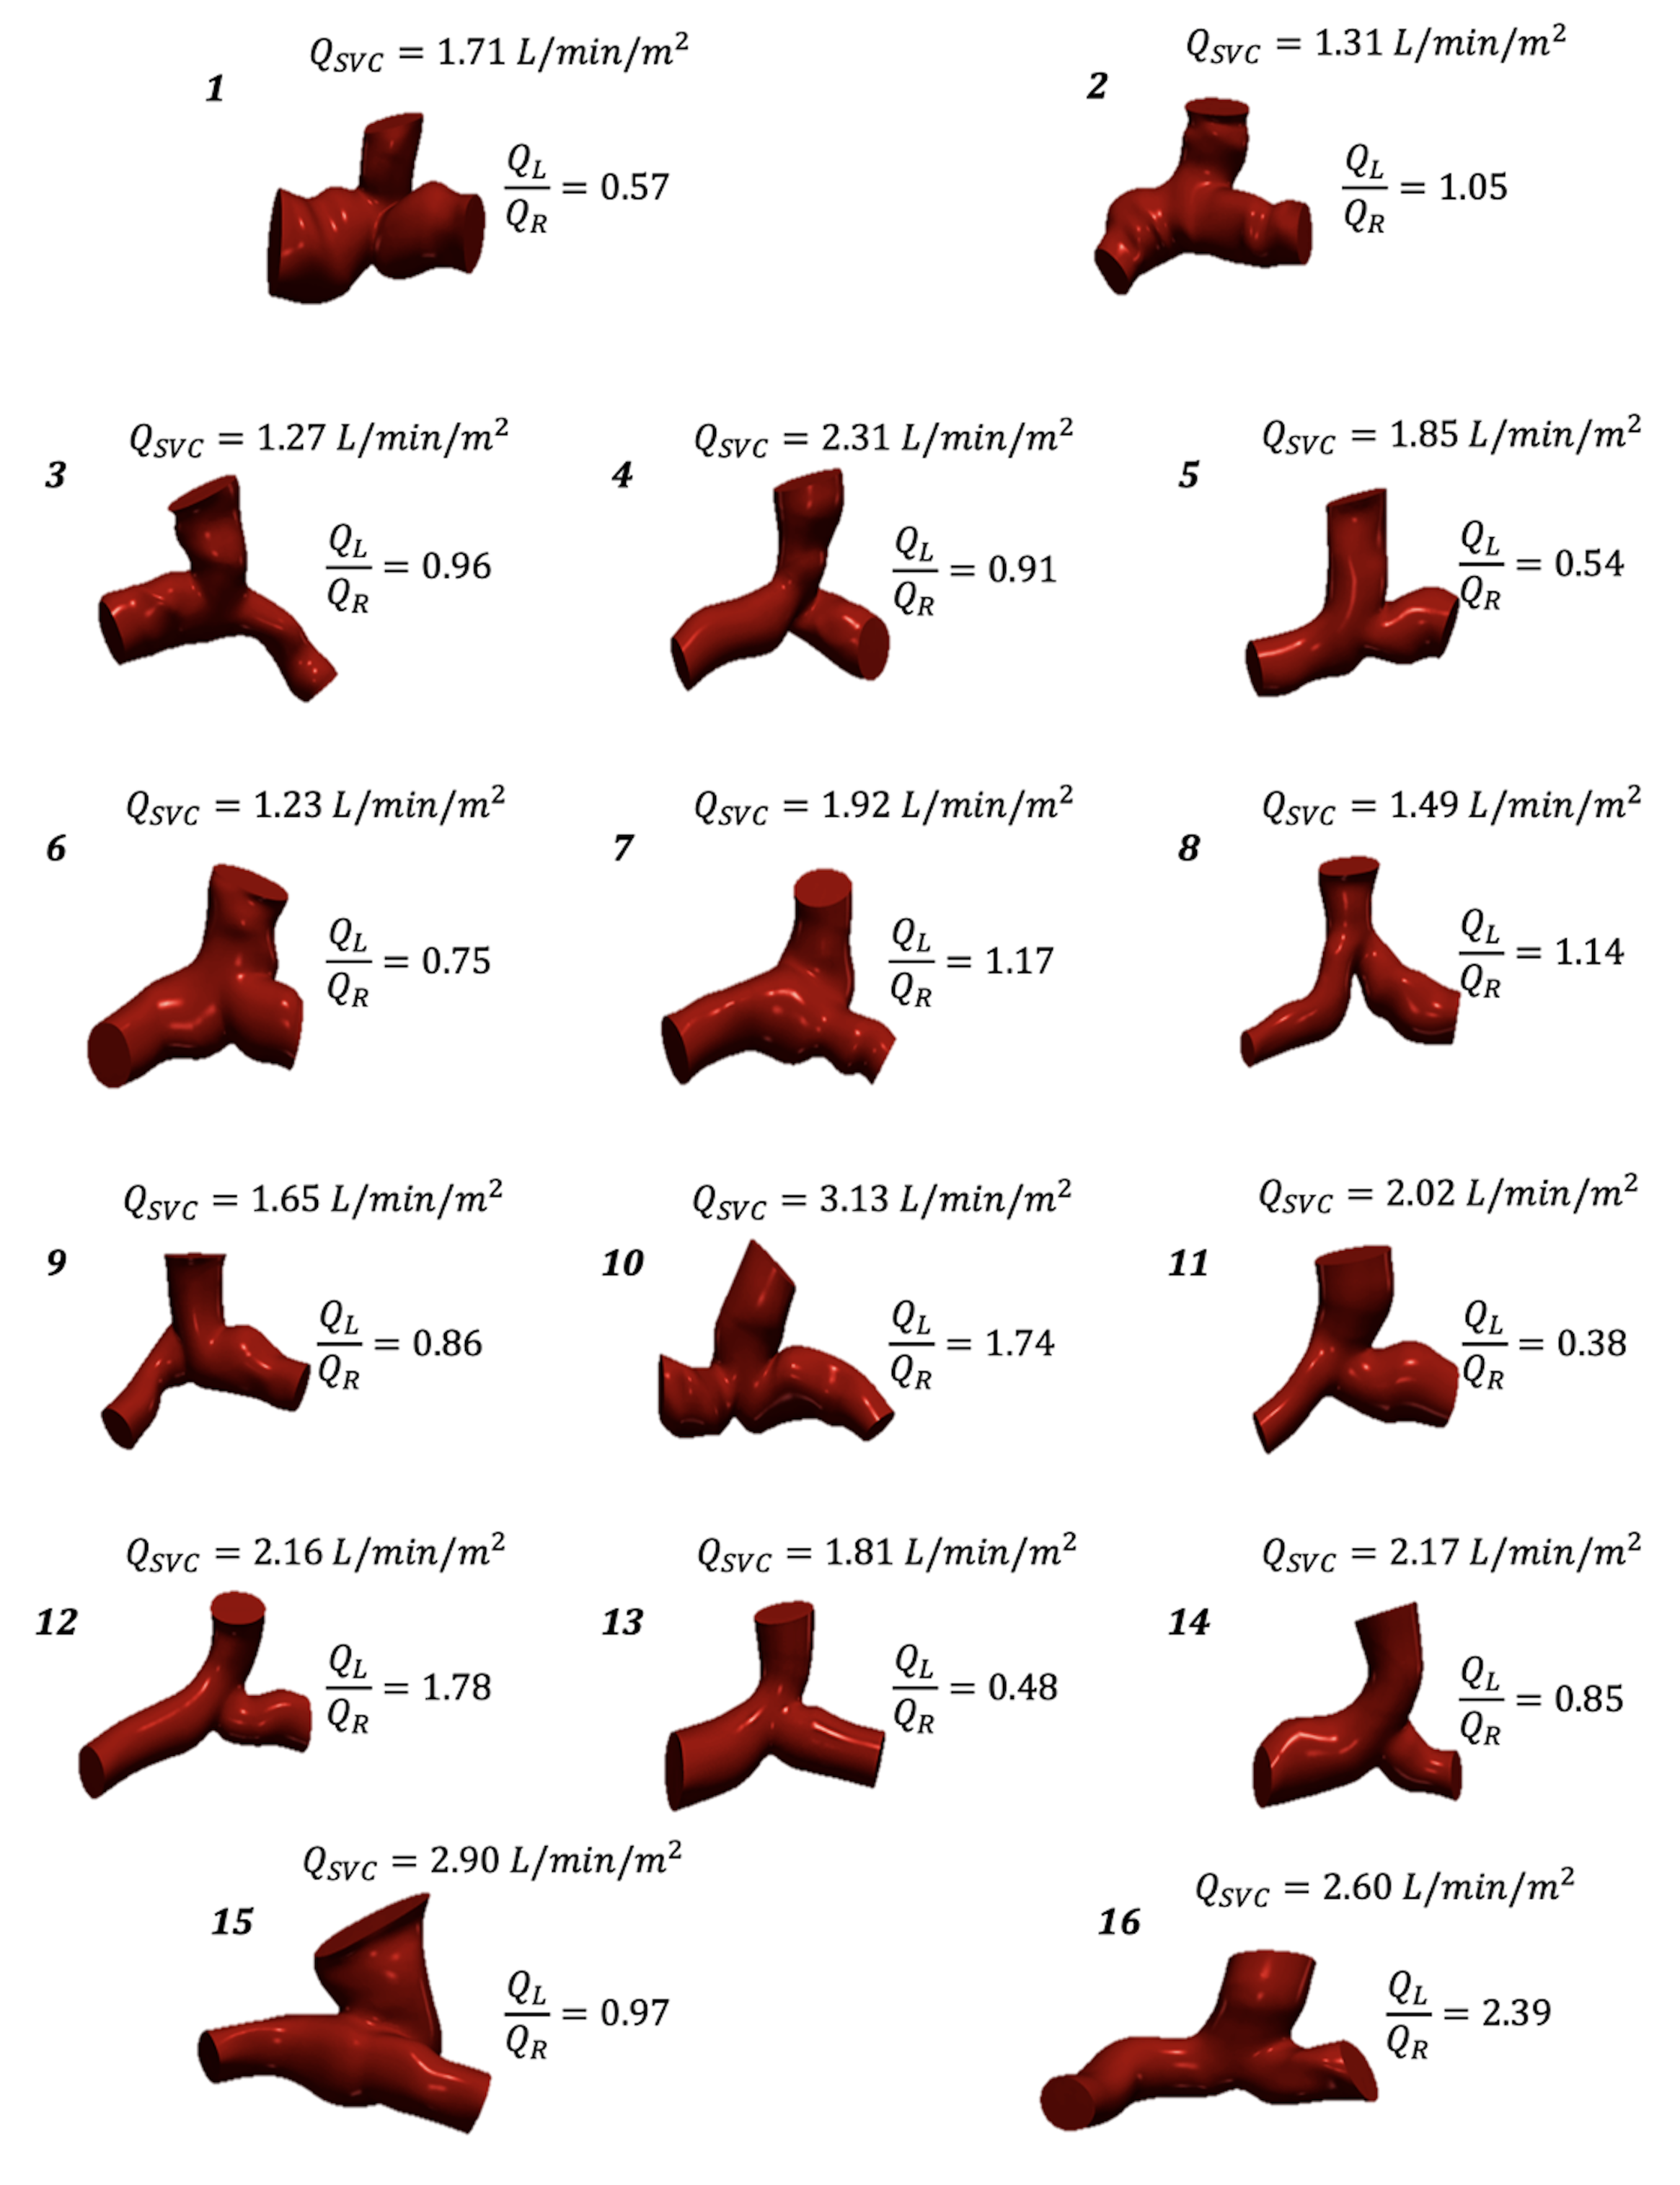
Figure 1: 3D models of the Glenn PA junction for all 16 patients, along with CMR measured inlet flow rates (QSVC) and the ratio of LPA flow rates (QL) and RPA flow rates (QR).
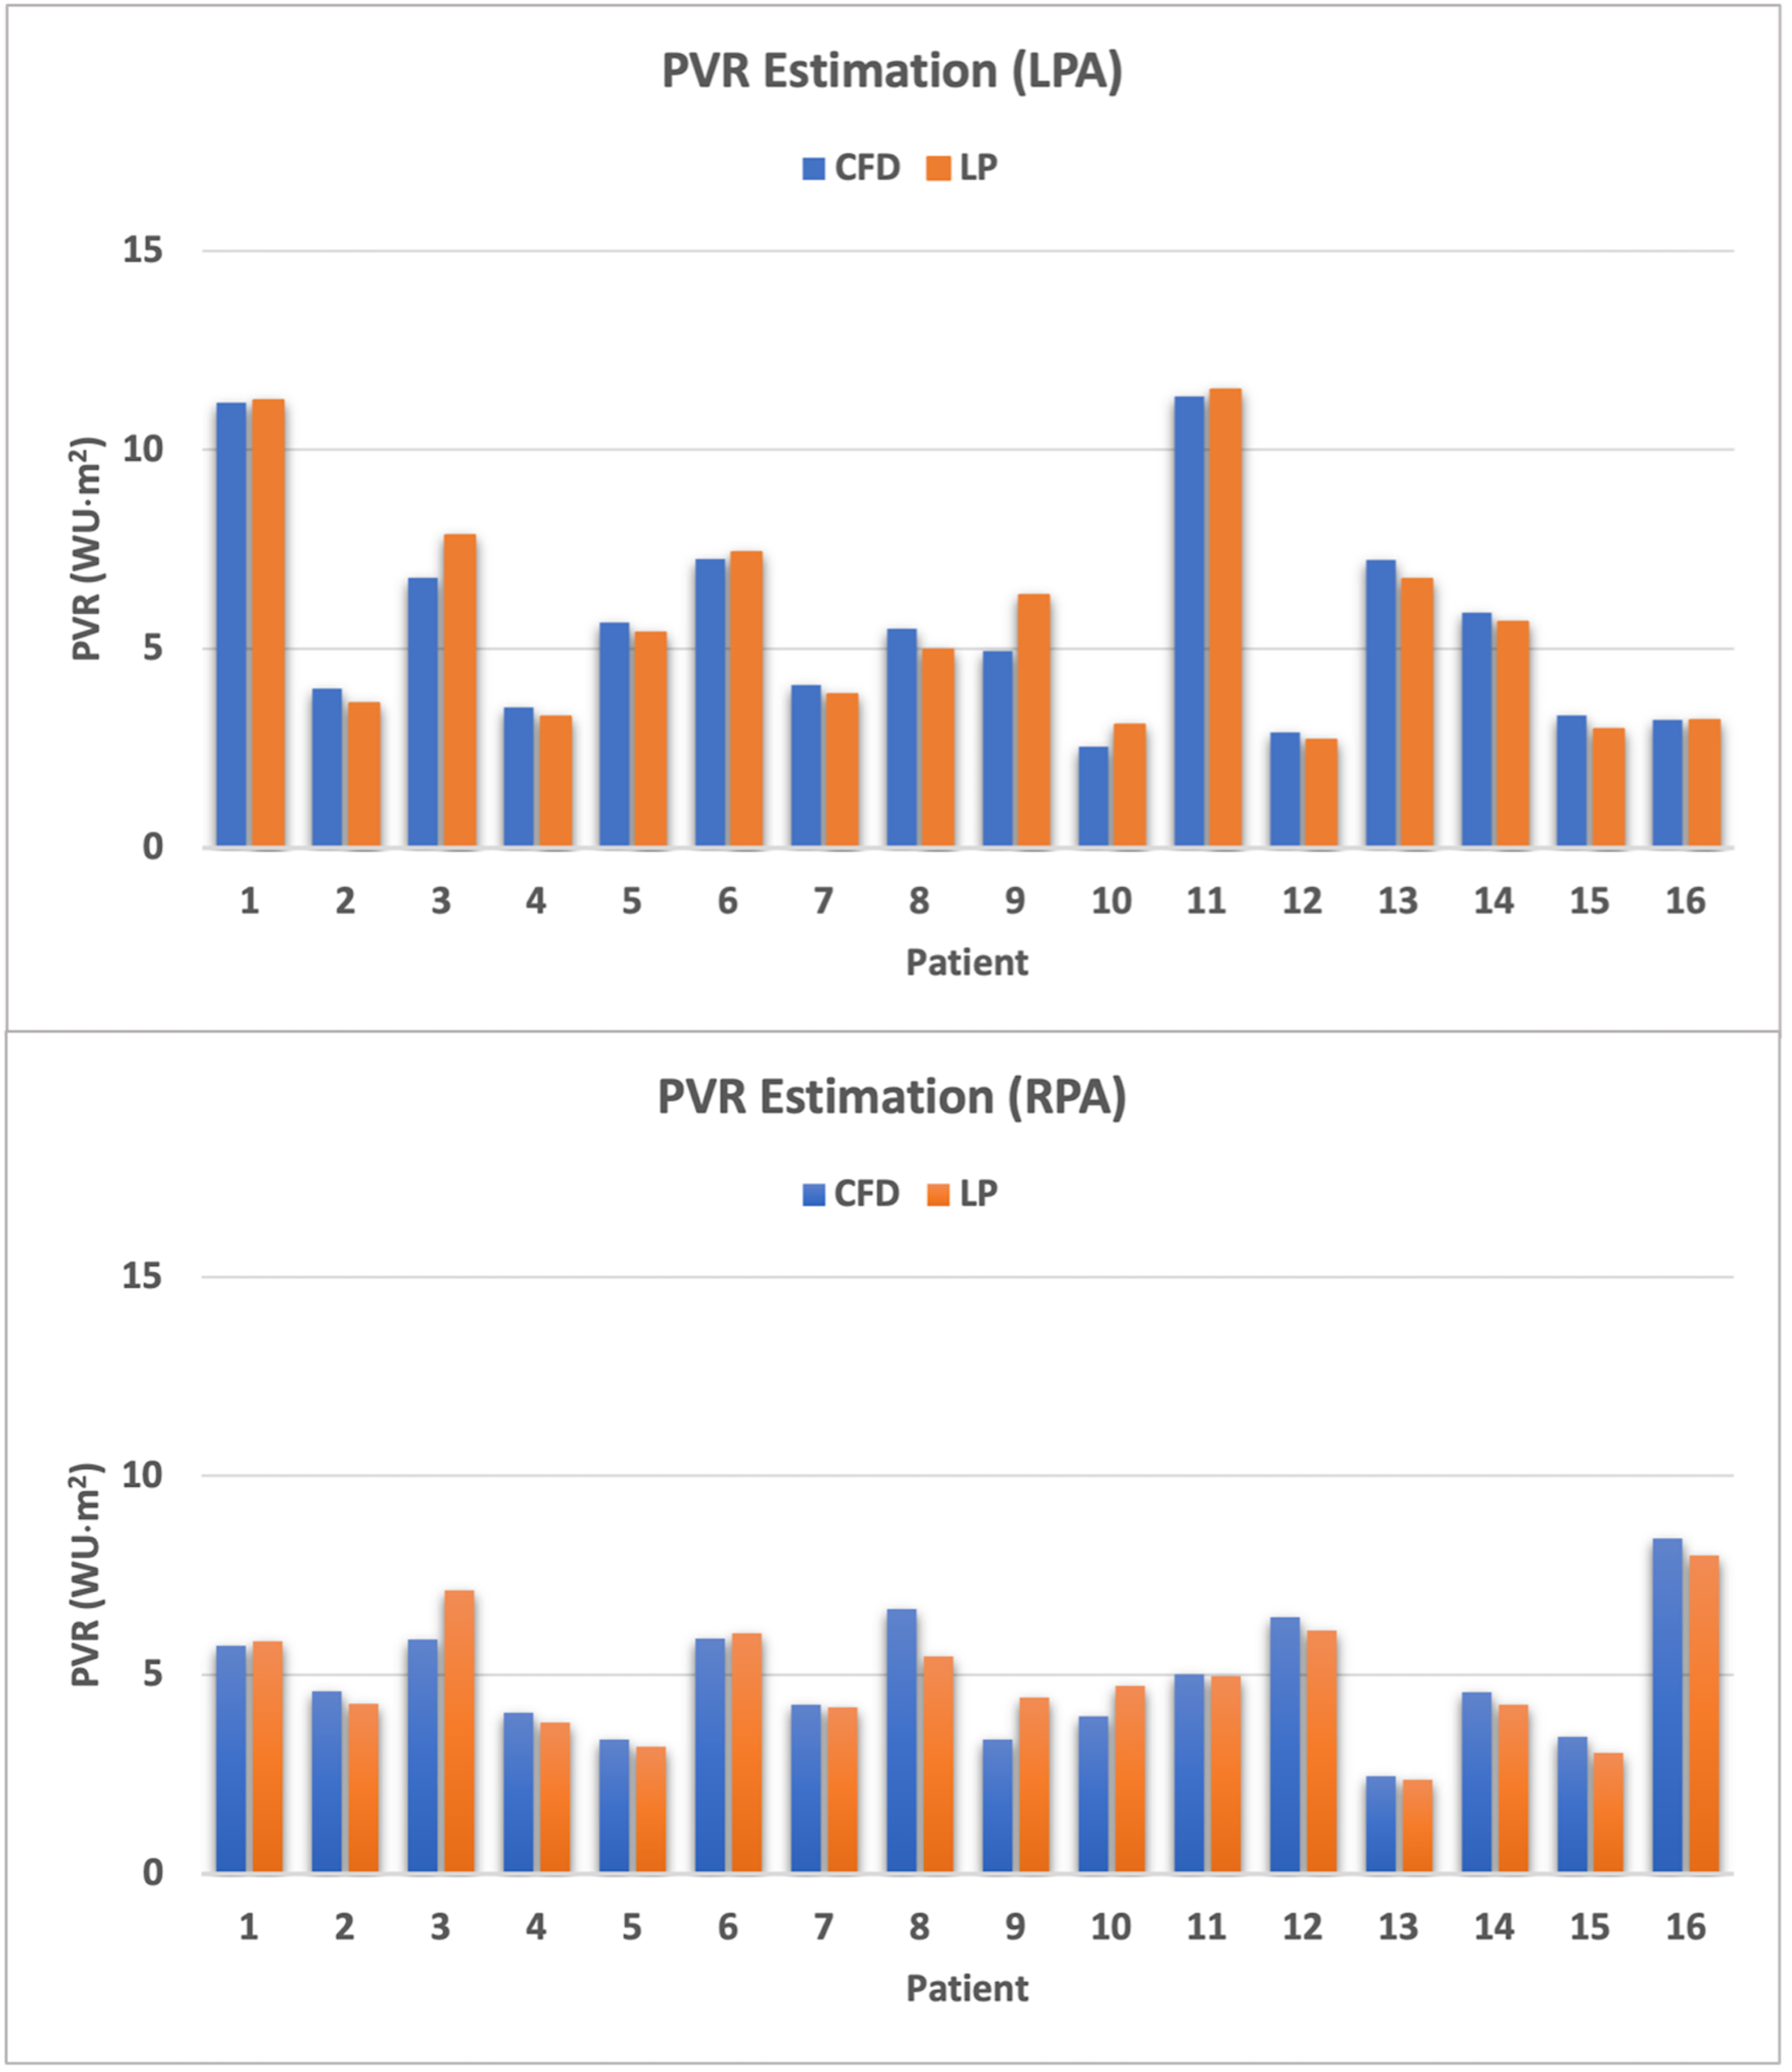
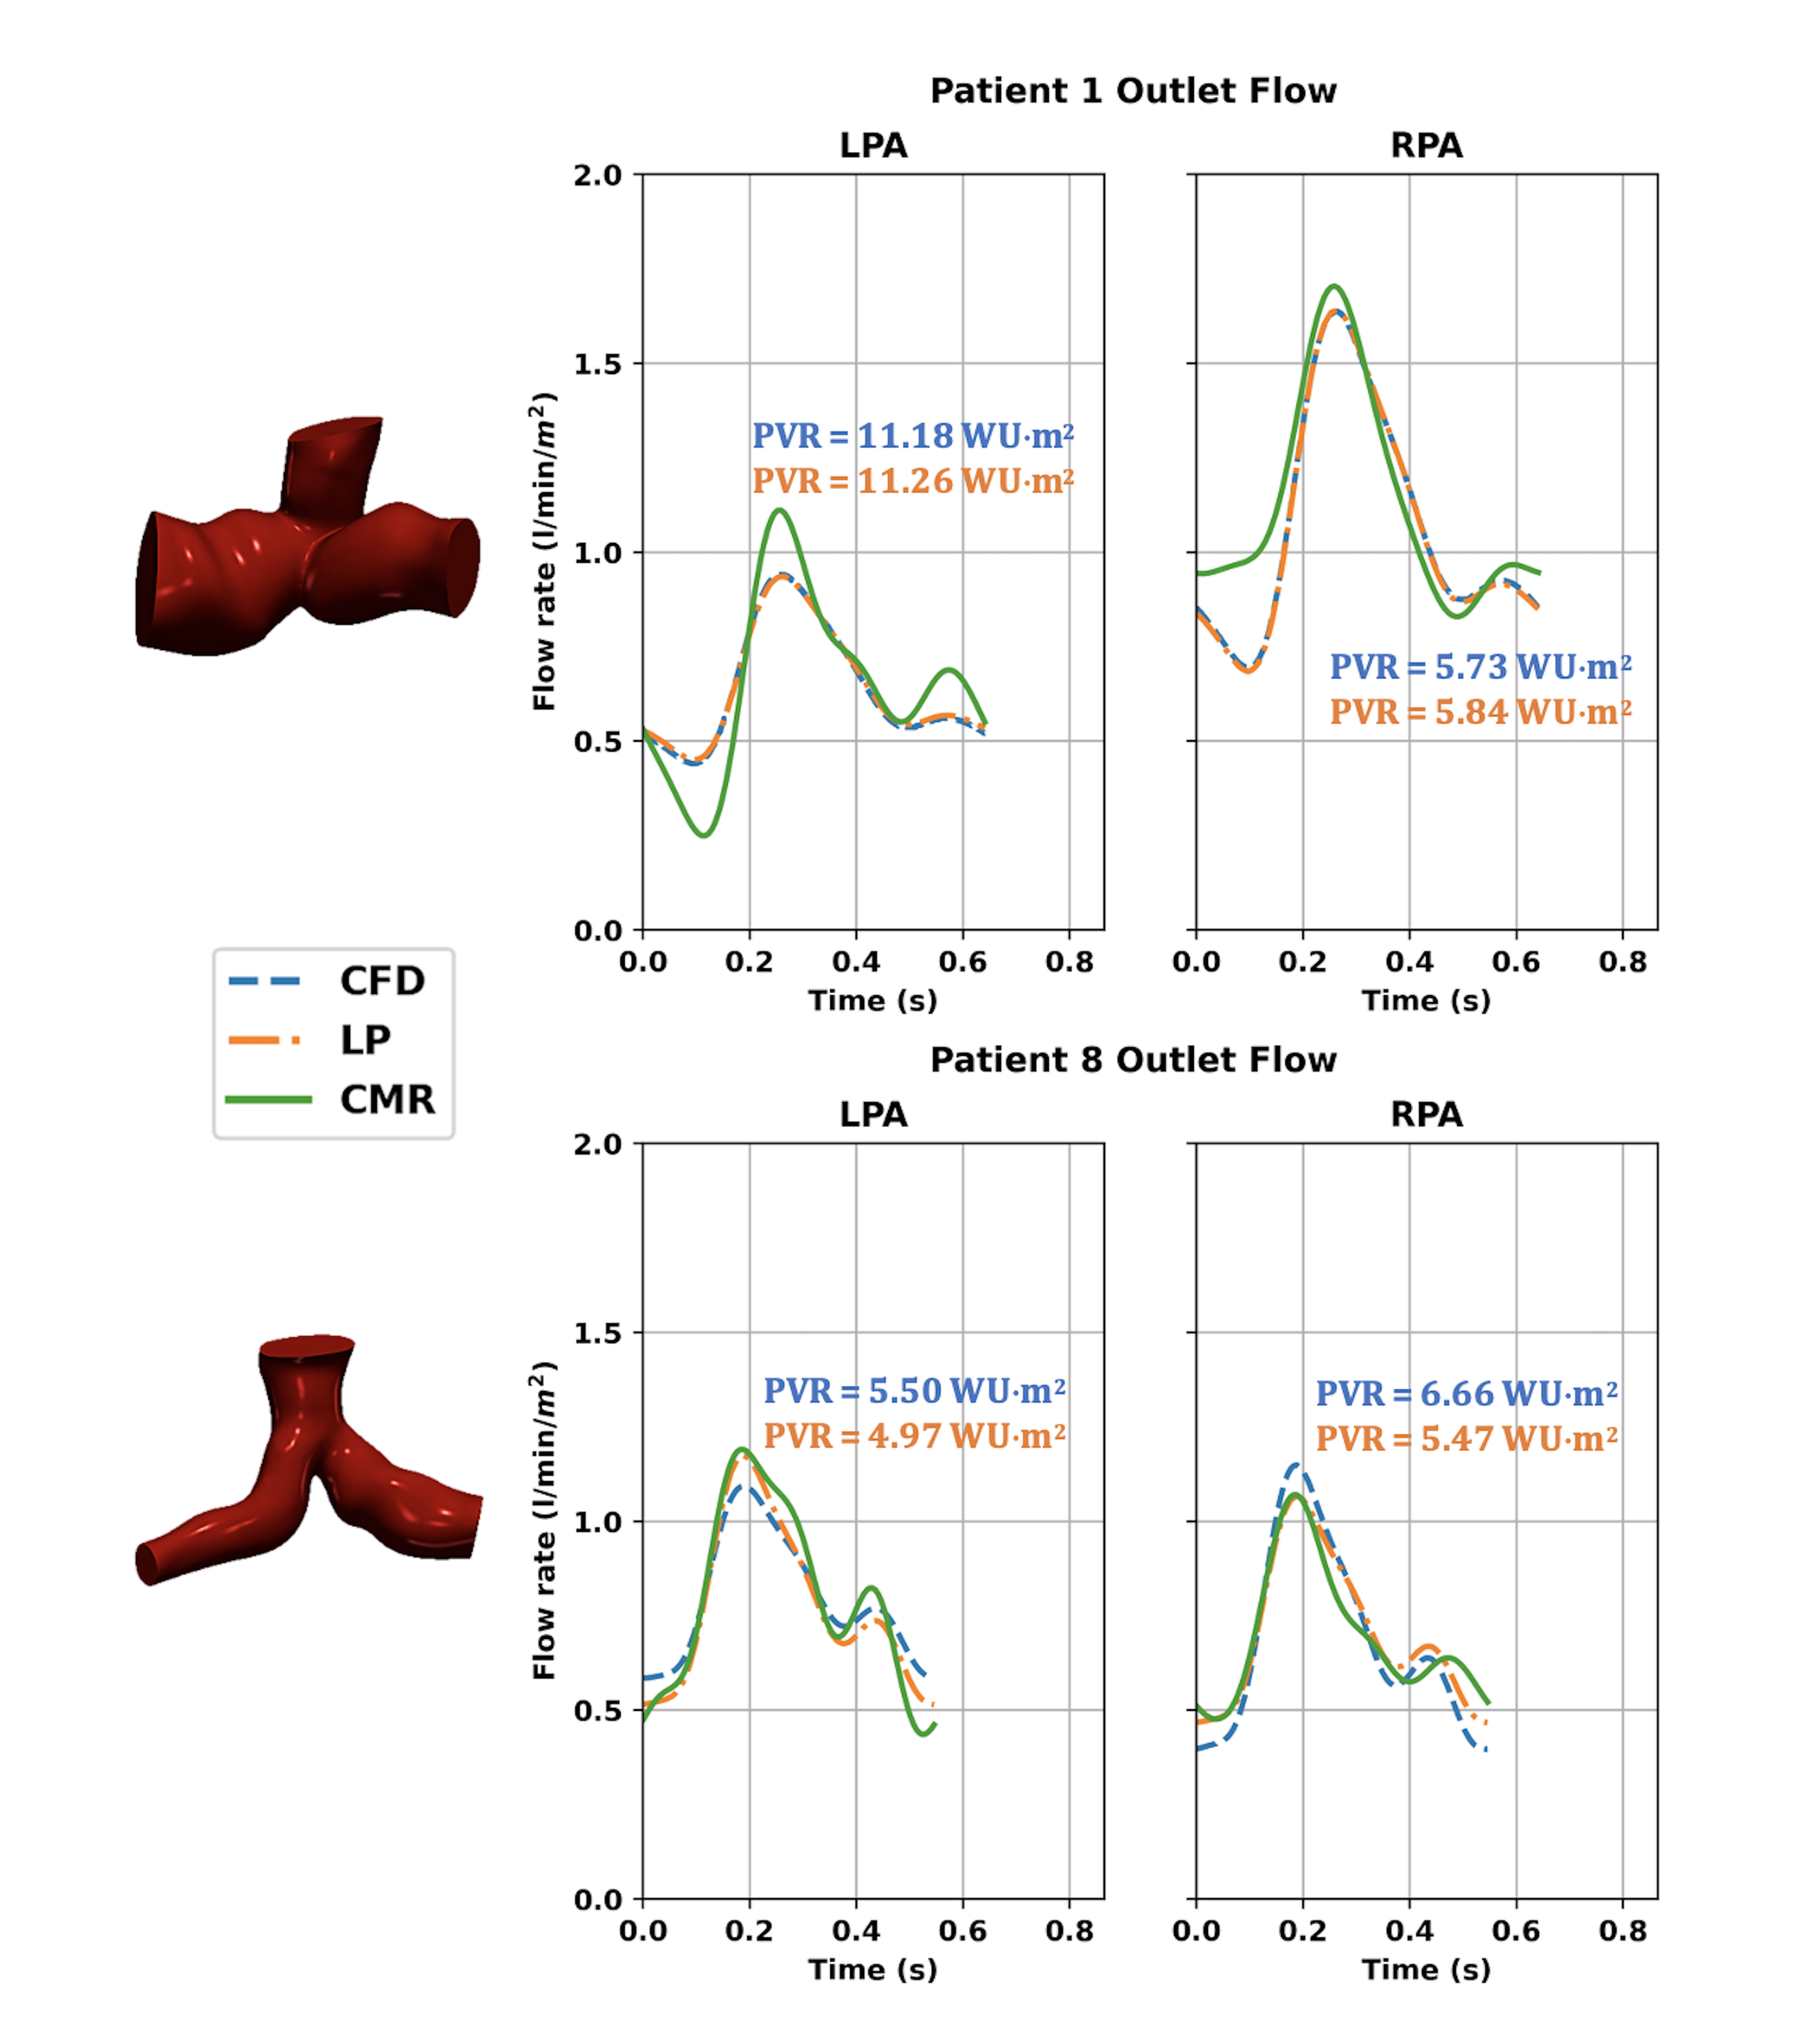
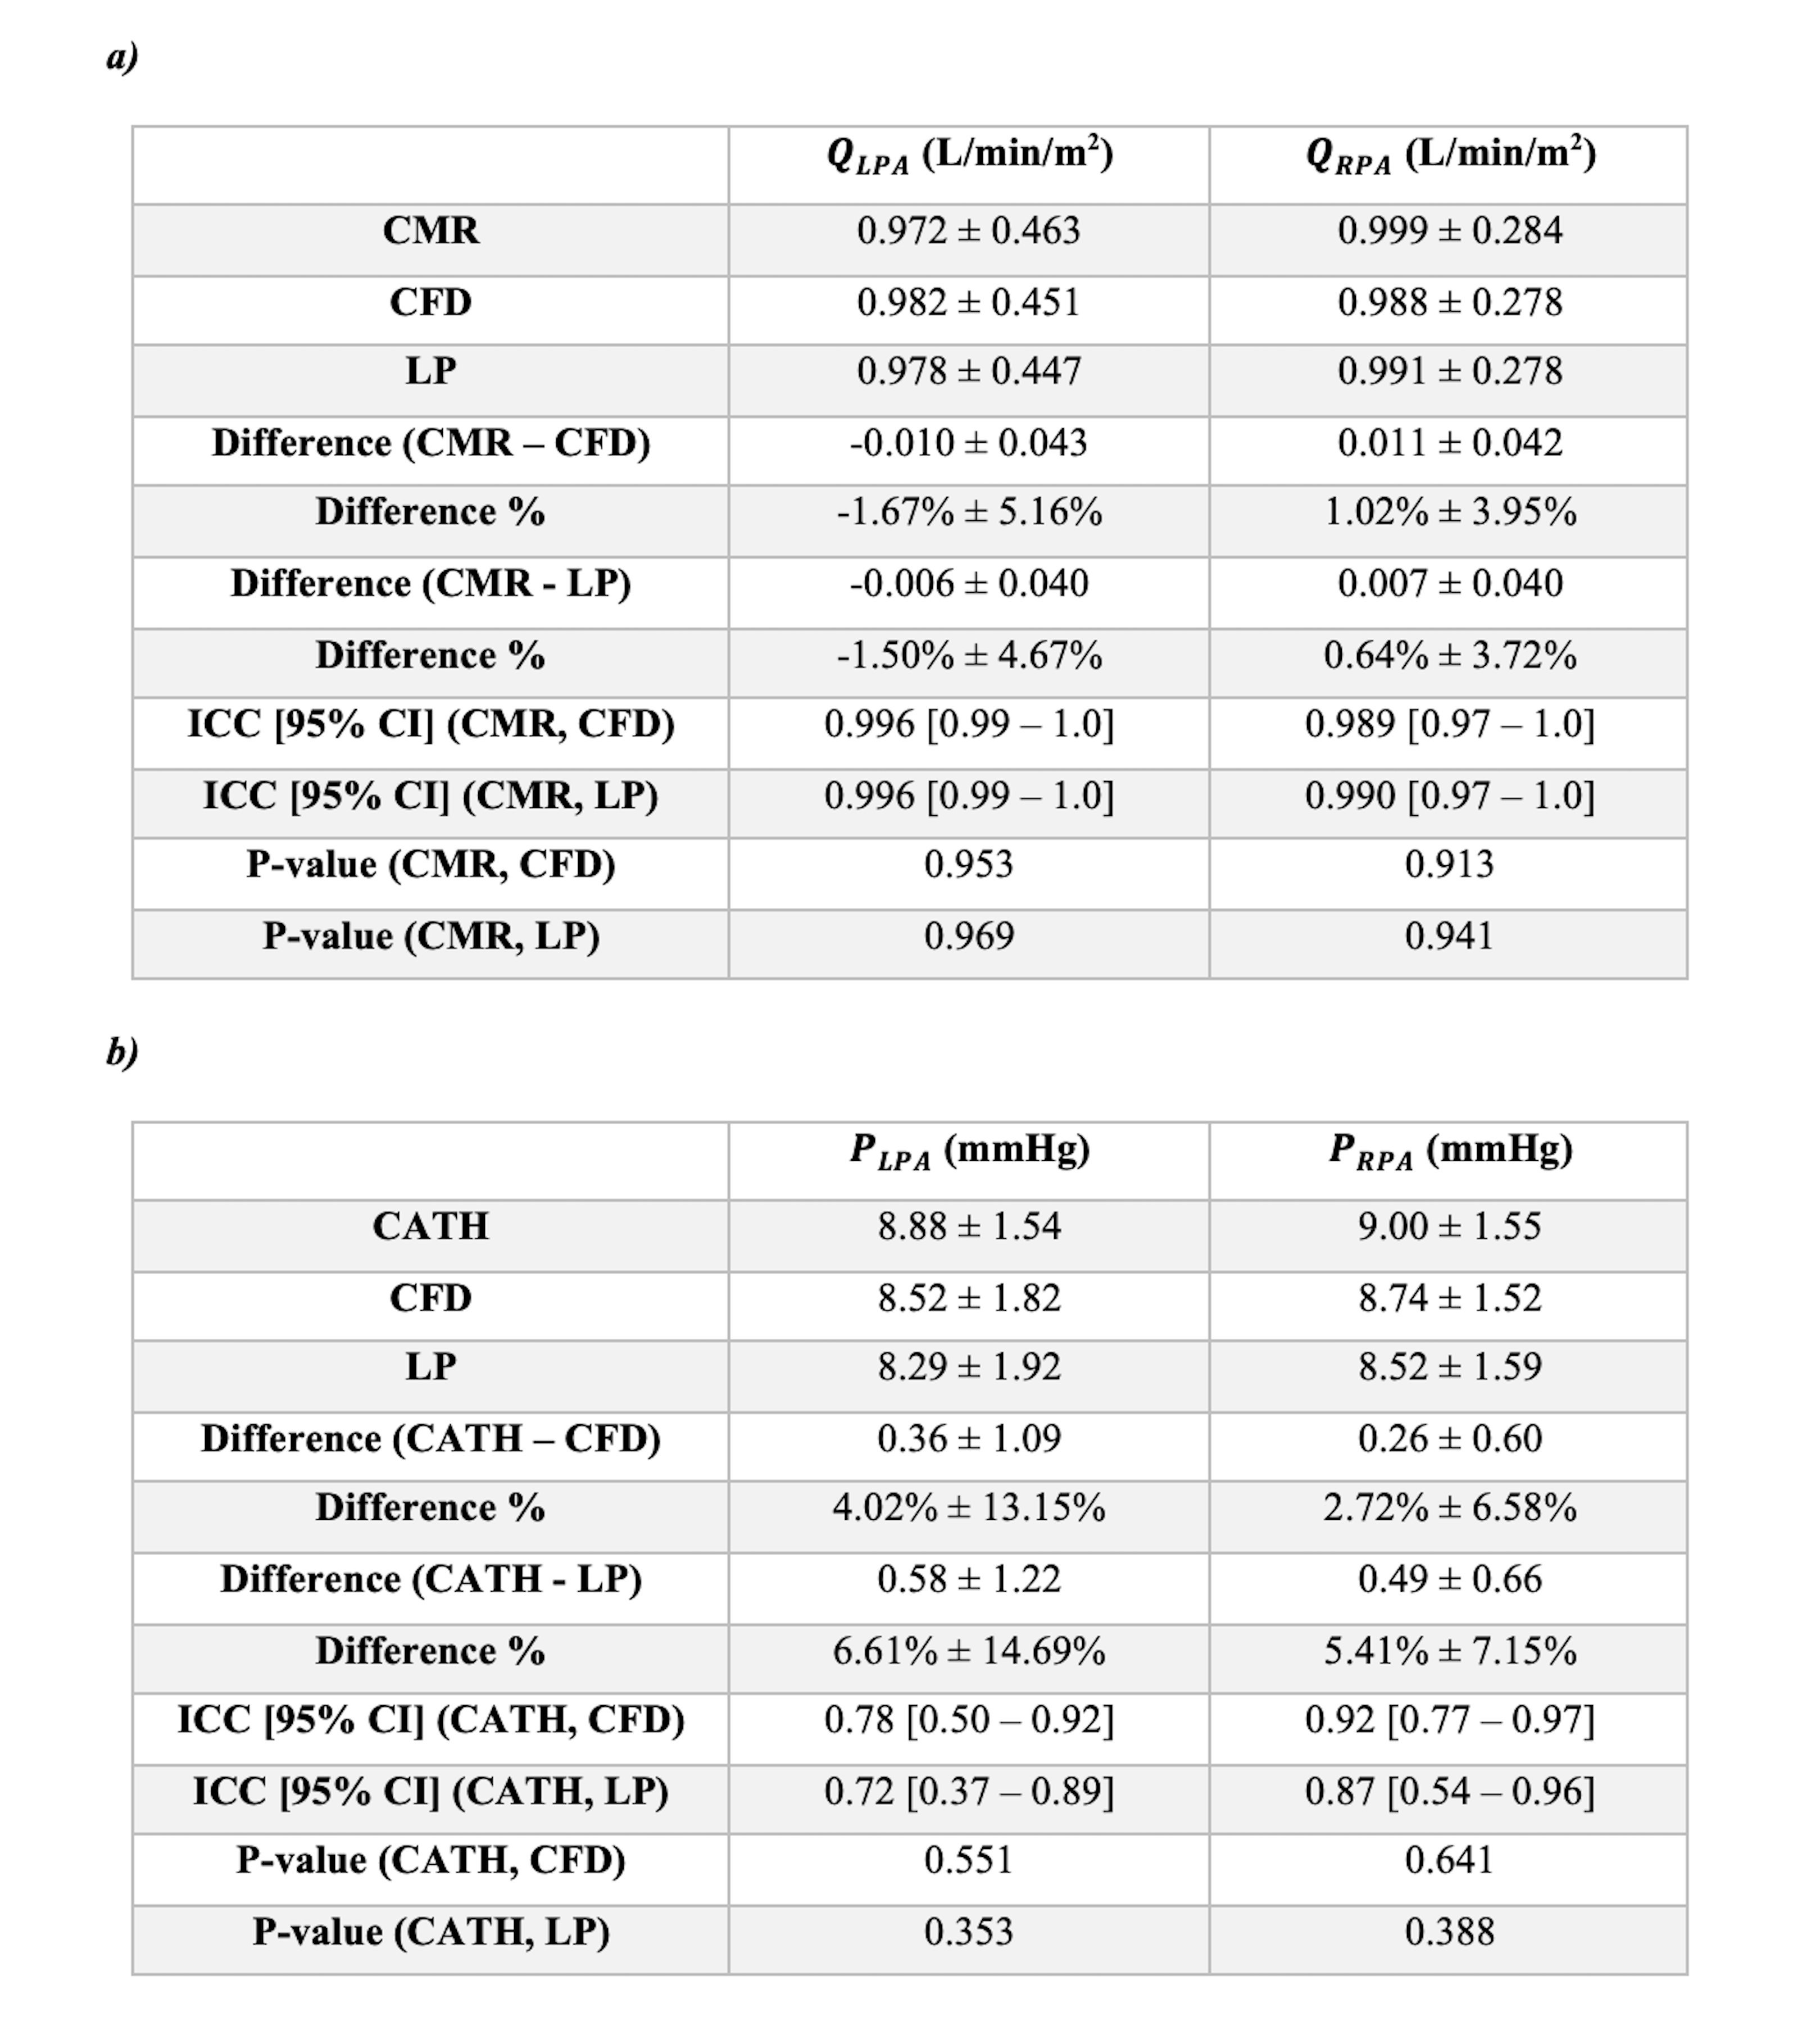
Table 1: CMR, CATH, CFD, and LP data for the left and right lungs, comparing (a) mean flow rates and (b) mean pressures.