3366
Comparison of MSG-EPI and 3D-BTFE sequences in non-enhanced coronary magnetic resonance imaging1Jiangsu Province Official Hospital, Nanjing, China, 2Jinling Hospital, Nanjing, China, 3Philips Healthcare, Shanghai, China
Synopsis
Keywords: Vascular, Cardiovascular
Motivation: Non-contrast enhanced coronary MRA is a non-invasive and non-ionizing radiation imaging technology. 3D-BTFE is the most commonly used coronary MRA sequence but is time-consuming.
Goal(s): We compared the MSG-EPI and 3D-BTFE sequences and evaluated the value of MSG-EPI.
Approach: The differences of image score, SNR and CNR between the two sequences were compared.
Results: We found that the image score, SNR, and CNR differ between MSG-EPI and 3D-BTFE. In lumen display of RCA and LAD, image scores of MSG-EPI were sufficient to attach diagnostic requirements and there was no significant difference in SNR. However, the CNR of 3D-BTFE was significantly higher than MSG-EPI.
Impact: This study
compared MSG-EPI and 3D-BTFE sequences and found that although MSG-EPI 's image
quality is slightly inferior to 3D-BTFE 's, its advantage of rapid imaging
makes it promising in clinical applications.
Introduction
Non-contrast enhanced coronary MRA (CMRA) [1], as a non-invasive and non-ionizing radiation imaging technology, has contributed significantly to our understanding of CAD pathophysiology [2,3]. Its usefulness in assessing CAD in different groups of patients has been demonstrated [4-7]. 3D Balanced turbo-field-echo (3D-BTFE) sequence is a commonly used gradient-echo technique, which produces bright blood images with high vessel-to-background contrast [8-9]. Its scanning time is about 9-10 minutes. While Multi-shot gradient (MSG)-EPI [10-14] is a hybrid technique that combines TFE and EPI scanning; its scanning speed and artifacts are intermediate. Previous studies have investigated the feasibility of CMRA using MSG-EPI on 3T scanners [13,15-16].This study aimed to compare the image quality of the MSG-EPI and 3D-BTFE sequences, and evaluate the clinical value of MSG-EPI.
Methods
Patient populationFrom June to September 2023, 156 patients underwent CMRA. The inclusion criteria are as follows: simultaneous collection of MSG-EPI and 3D-BTFE; no history of cardiac surgery; no claustrophobia. Finally, 36 patients (21 males, age range for 18-76 years old) were included in the study.
CMR protocol
The 3D-BTFE sequence was acquired on 3.0T MR scanner (Elition, Philips Healthcare, Best, the Netherlands) with an electrocardiogram-triggered, navigator-gated, fat-saturated, T2-prepared (TR/TE=3.1/1.56ms, flip angle = 70°, T2 preparation time = 40ms, FOV = 380 x 280 x 217 mm3, acquired voxel size =1.4 x1.4 x 1.4 mm3). Total scan time ranged from 6-10 minutes depending on respiratory gating efficiency. Typical scan parameters of MSG-EPI were: TR/TE = 13/6.0ms, flip angle = 20°, FOV=300 x 300mm2, acquired spatial resolution = 1.56x 1.95 x 3 mm3, TFE factor =18, EPI factor =9. The scan time was approximately 18 seconds.
Image quality evaluation
Eight coronary segments were evaluated in each case; the proximal, middle and distal segments of the left anterior descending (LAD) and the right coronary artery (RCA), the proximal and distal segments of the left circumflex (LCX). Two readers scored images separately for a blinded assessment of clinical information. The images' quality was evaluated using a 5-point scale [9,17]. The lumen signal values of each segment were measured three times, and the average value was calculated. The signal-to-noise ratio (SNR) and contrast-to-noise ratio (CNR) were calculated with the interventricular septum as the background noise.
Statistical analysis
SPSS statistics was used for data analysis. Independent sample t-test or Mann–Whitney U test was used to compare the differences in image quality parameters between the two sequences. Inter-observer consistency was assessed using Kappa statistics. P< 0. 05 was considered a significant difference.
Results
The Kappa values between the two readers ranged from 0.62-0.86, showing good consistency. The scores of each segment of coronary artery in 3D-BTFE sequence were significantly higher than those in the MSG-EPI sequence(P<0.05). The average scores of RCA, LAD and LCX of 3D-bTFE were higher than those of MSG-EPI (4.49±0.60vs3.81±0.83, 4.44±0.60vs3.57±0.73, 4.32±0.70vs3.45±0.72). The SNR of LAD middle section and the SNR of LCX proximal and distal sections were significantly higher in the 3D-BTFE sequence than in the MSG-EPI sequence ((p = 0.014, 0.009, 0.003, respectively)). In addition, the CNR of each segment in the two sequences was significantly different (P < 0.05). There was no significant difference between RCA's three segments and LAD's proximal and distal segments.Discussion
MSG-EPI acquires multiple echoes at one RF excitation; at the same repetition time, the image acquisition time is reduced by the number of EPI factors [13]. Previous studies have shown that MSG-EPI scanning times are much shorter than balanced steady-state free precession(b-SSFP) [18-19]. However, its sensitivity to flow and cardiac motion is an important disadvantage of MSG-EPI and the T2∗ decay can be expected to introduce some blurring in the images[20]. Our study indicated that although the image quality of 3D-BTFE was better than that of MSG-EPI, MSG-EPI can basically meet the needs of imaging diagnosis. Regarding SNR, there was no significant difference in the two sequences' RCA segments, LAD proximal and distal segments, which indicated that the SNR of MSG-EPI in RCA and LAD was not worse than 3D-BTFE. The significant difference in the midsection of LAD may be because there were six patients with myocardial bridge, in which the myocardium affected the lumen signals. Similarly, LCX's SNR significantly differed between the two groups because it traveled between the myocardium. The difference in CNR between the two sequences could be expected.Conclusion
In conclusion, the MSG-EPI sequence is a promising method to reduce the acquisition time of 3D unenhanced whole-heart coronary MRA images.Acknowledgements
Thanks to Professor Lu and all colleagues for their guidance and help in this study. Thanks to the Philips staff for providing technical guidance to the research.References
1. Kato Y, Ambale-Venkatesh B, Kassai Y, et al. Non-contrast coronary magnetic resonance angiography: current frontiers and future horizons. MAGMA. 2020;33(5):591-612.
2. Kelle S, Hays AG, Hirsch GA, et al. Coronary artery distensibility assessed by 3.0 Tesla coronary magnetic resonance imaging in subjects with and without coronary artery disease. Am J Cardiol. 2011;108(4):491-497.
3. Nguyen PK, Meyer C, Engvall J, Yang P, McConnell MV. Noninvasive assessment of coronary vasodilation using cardiovascular magnetic resonance in patients at high risk for coronary artery disease. J Cardiovasc Magn Reson. 2008;10(1):28. Published 2008 May 30.
4. Sakuma H, Ichikawa Y, Suzawa N, et al. Assessment of coronary arteries with total study time of less than 30 minutes by using whole-heart coronary MR angiography. Radiology. 2005;237(1):316-321.
5. Hamdan A, Asbach P, Wellnhofer E, et al. A prospective study for comparison of MR and CT imaging for detection of coronary artery stenosis. JACC Cardiovasc Imaging. 2011;4(1):50-61.
6. Kim WY, Danias PG, Stuber M, et al. Coronary magnetic resonance angiography for the detection of coronary stenoses. N Engl J Med. 2001;345(26):1863-1869.
7. Kato S, Kitagawa K, Ishida N, et al. Assessment of coronary artery disease using magnetic resonance coronary angiography: a national multicenter trial. J Am Coll Cardiol. 2010;56(12):983-991. 8. Panda A, Francois CJ, Bookwalter CA, et al. Non-Contrast Magnetic Resonance Angiography: Techniques, Principles, and Applications. Magn Reson Imaging Clin N Am. 2023;31(3):337-360.
9. Kim YJ, Seo JS, Choi BW, Choe KO, Jang Y, Ko YG. Feasibility and diagnostic accuracy of whole heart coronary MR angiography using free-breathing 3D balanced turbo-field-echo with SENSE and the half-fourier acquisition technique. Korean J Radiol. 2006;7(4):235-242.
10. Stehling MK, Turner R, Mansfield P. Echo-planar imaging: magnetic resonance imaging in a fraction of a second. Science. 1991;254(5028):43-50.
11. McKinnon GC. Ultrafast interleaved gradient-echo-planar imaging on a standard scanner. Magn Reson Med. 1993;30(5):609-616.
12. Deshpande VS, Wielopolski PA, Shea SM, Carr J, Zheng J, Li D. Coronary artery imaging using contrast-enhanced 3D segmented EPI. J Magn Reson Imaging. 2001;13(5):676-681.
13. Iyama Y, Nakaura T, Nagayama Y, et al. Single-Breath-Hold Whole-heart Unenhanced Coronary MRA Using Multi-shot Gradient Echo EPI at 3T: Comparison with Free-breathing Turbo-field-echo Coronary MRA on Healthy Volunteers. Magn Reson Med Sci. 2018;17(2):161-167.
14. Morita K, Nakaura T, Yoneyama M, et al. Non-contrast renal MRA using multi-shot gradient echo EPI at 3-T MRI. Eur Radiol. 2021;31(8):5959-5966.
15. Botnar RM, Stuber M, Danias PG, Kissinger KV, Manning WJ. A fast 3D approach for coronary MRA. J Magn Reson Imaging. 1999;10(5):821-825.
16. Börnert P, Jensen D. Coronary artery imaging at 0.5 T using segmented 3D echo planar imaging. Magn Reson Med. 1995;34(6):779-785.
17. Nagata M, Kato S, Kitagawa K, et al. Diagnostic accuracy of 1.5-T unenhanced whole-heart coronary MR angiography performed with 32-channel cardiac coils: initial single-center experience. Radiology. 2011;259(2):384-392.
18. Iyama Y, Nakaura T, Nagayama Y, et al. Comparison between multi-shot gradient echo EPI and balanced SSFP in unenhanced 3T MRA of thoracic aorta in healthy volunteers. Eur J Radiol. 2017;96:85-90.
19. Morita K, Nakaura T, Yoneyama M, et al. Non-contrast renal MRA using multi-shot gradient echo EPI at 3-T MRI. Eur Radiol. 2021;31(8):5959-5966.
20. Duerk JL, Simonetti OP. Theoretical aspects of motion sensitivity and compensation in echo-planar imaging. J Magn Reson Imaging. 1991;1(6):643-650.
Figures
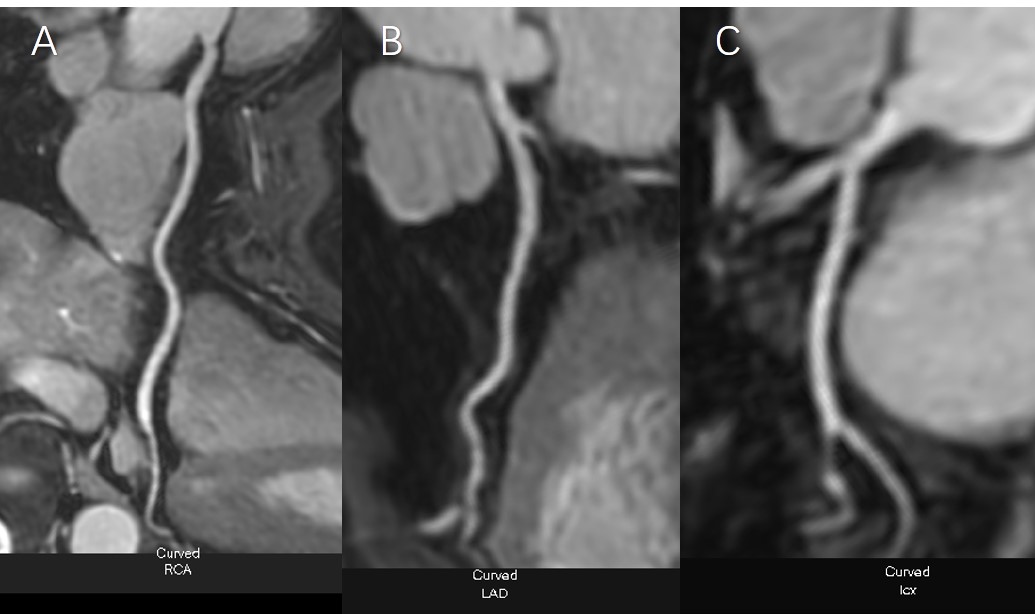
Female, 69 Y
The distribution of coronary arteries was right-sided dominant, and the origin of the left and right coronary arteries was normal. A-C: the RCA, LAD, LCX shown in 3D-BTFE sequence; D-F: the RCA, LAD, LCX shown in MSG-EPI sequence; G-I: the RCA, LAD, LCX shown in coronary artery CTA.
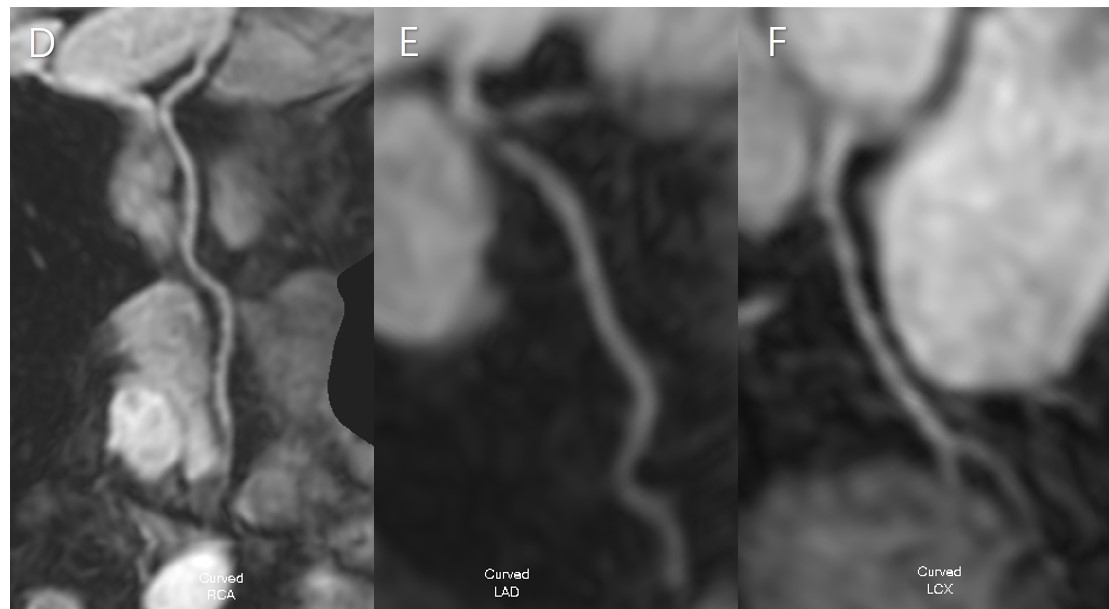
Female, 69 Y
The distribution of coronary arteries was right-sided dominant, and the origin of the left and right coronary arteries was normal. A-C: the RCA, LAD, LCX shown in 3D-BTFE sequence; D-F: the RCA, LAD, LCX shown in MSG-EPI sequence; G-I: the RCA, LAD, LCX shown in coronary artery CTA.
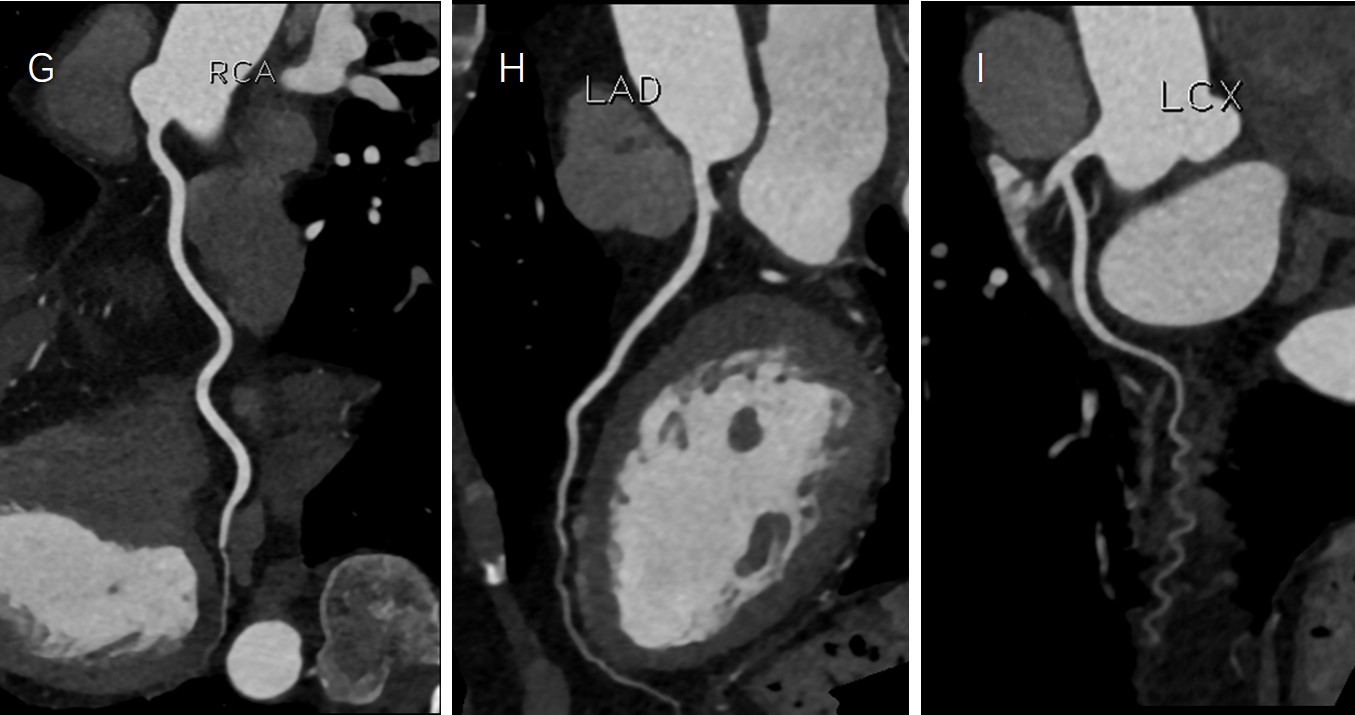
Female, 69 Y
The distribution of coronary arteries was right-sided dominant, and the origin of the left and right coronary arteries was normal. A-C: the RCA, LAD, LCX shown in 3D-BTFE sequence; D-F: the RCA, LAD, LCX shown in MSG-EPI sequence; G-I: the RCA, LAD, LCX shown in coronary artery CTA.