3363
3D phase contrast MRI of the coronary arteries – Improvements and adaptations at 3T1Friedrich-Alexander-University Erlangen-Nürnberg, Erlangen, Germany, 2Siemens Healthineers AG, Erlangen, Germany, 3Diagnostikum Berlin, Berlin, Germany
Synopsis
Keywords: Flow, Motion Correction
Motivation: 3D Phase contrast MRI of the coronary arteries remains challenging due to low SNR and motion.
Goal(s): Develop a 3D PC sequence for flow quantification in the coronary arteries at 3T with improved SNR and reduced motion artefacts compared to 1.5T.
Approach: The sequence was optimized by acquiring datasets separately, enabling inter-scan motion compensation while circumventing SAR limitations. Coronary flow was quantified in 5 subjects at 3T.
Results: Phantom measurements showed reduced image artefacts using the proposed sequence. In-vivo mean peak velocities per slice along the left and right coronary arteries were 15.9±5.0cm/s and 14.1±4.9cm/s respectively.
Impact: High SNR 3D flow measurements in the proximal coronary arteries are now possible, as SAR restrictions at 3T have been overcome. This may enable the non-invasive hemodynamic assessment of coronary arteries in patients with CAD.
Introduction
Phase contrast (PC) MRI can be used for non-invasive acquisitions of blood flow velocities1. 3D PC-MRI in the coronary arteries is limited by the need for high spatial resolution due to small vessel sizes, leading to low SNR, long scan durations, and therefore, increased susceptibility to motion. Higher field strengths lead to improved SNR, however, SAR restrictions limit their applicability due to the required preparation pulses. We propose a sequence to address these challenges and evaluate 3D blood flow velocities in the left (LCA) and right (RCA) coronary arteries in healthy volunteers and patients at 3T.Methods
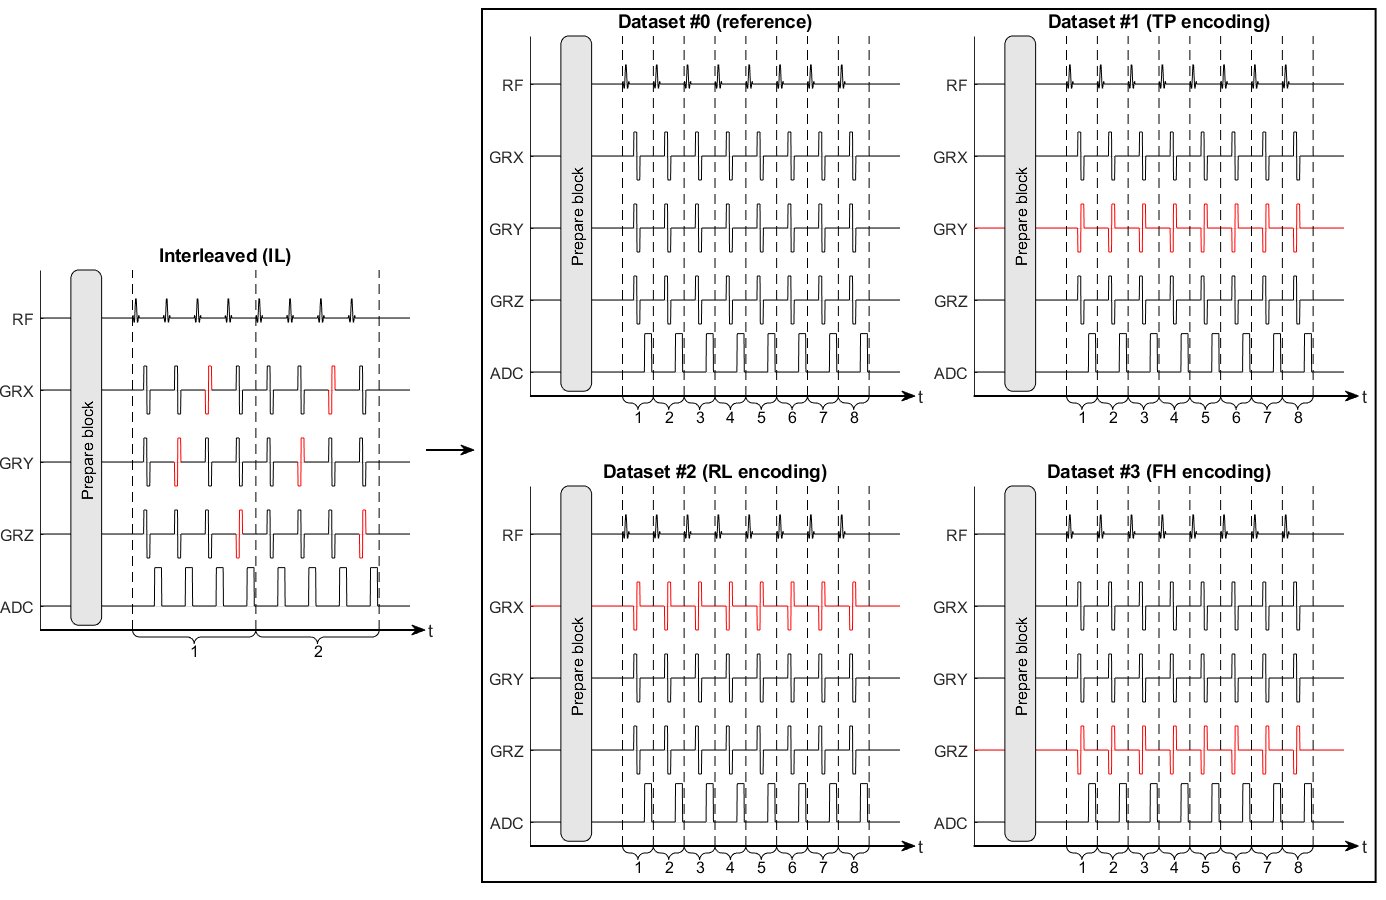
3D PC-MRI (VENC=50 cm/s, undersampling factor = 14, (Δx)3 = (1.2mm)3, adiabatic T2 prep, SPAIR, ECG-triggering, respiratory gating) was performed in diastole on a 3T MRI system (MAGNETOM Skyra, Siemens Healthineers AG, Erlangen, Germany) using a research sequence. Measurements were performed twice within one scan session on 3 healthy volunteers (2 females, 61.5±17.8 years) and were repeated on a different day for volunteer 1 to analyze inter-session variability. Further data were acquired on 2 patients (f, 84y and f, 26y) with suspected CAD and suspected myocarditis, respectively. Since neither suspicion was confirmed by clinical CMR acquisitions, data were included in the flow analysis across normal subjects. Additional data were obtained on 1 volunteer (male, 60 years) using non-adiabatic T2 preparation and fat saturation at 3T (MAGNETOM Vida, Siemens Healthineers AG, Erlangen, Germany). Due to protocol deviations, this measurement was not considered in the comprehensive flow analysis. Data in a static phantom were obtained on a 1.5T MRI system (MAGNETOM Sola, Siemens Healthineers AG, Erlangen, Germany).As opposed to conventional PC-MRI, the flow encoded/compensated datasets were acquired in individual scans (Fig. 1). The resulting decrease in scan time per scan alleviated SAR limitations at 3T. Inter-scan motion was compensated through co-registration of edge-filtered magnitude images (Matlab R2021b, The MathWorks, Natick, Massachusetts, USA). For edge-filtering, the approximate Canny algorithm was used. The obtained transformations were applied to the corresponding magnitude and phase images. Furthermore, spin displacement in between flow and spatial encoding was corrected2,3. The averaged magnitude images were used for manual segmentation.
Results and Discussion
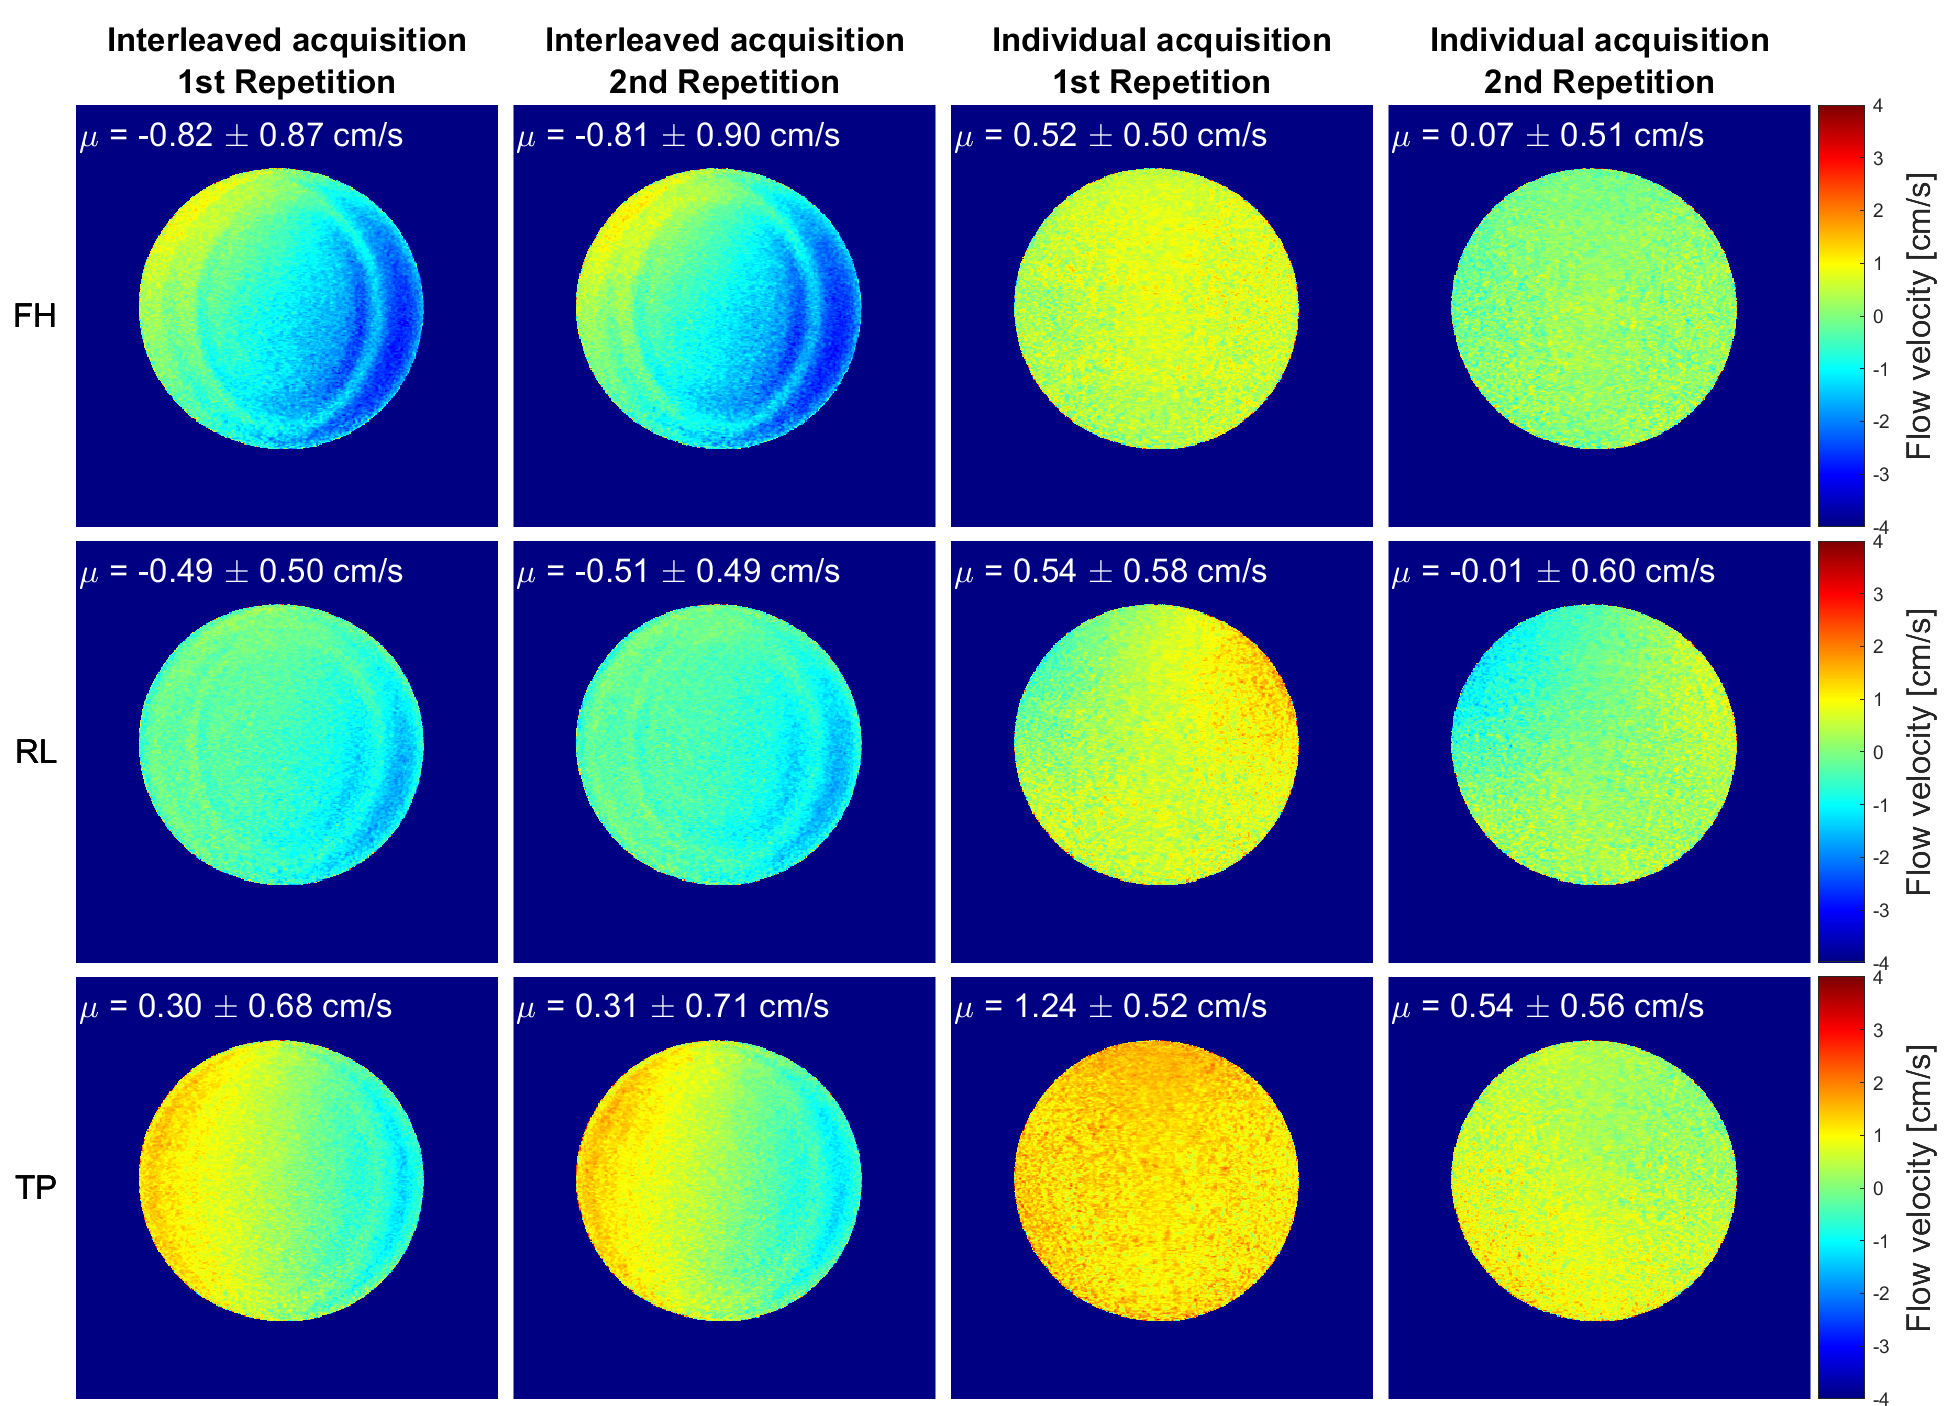
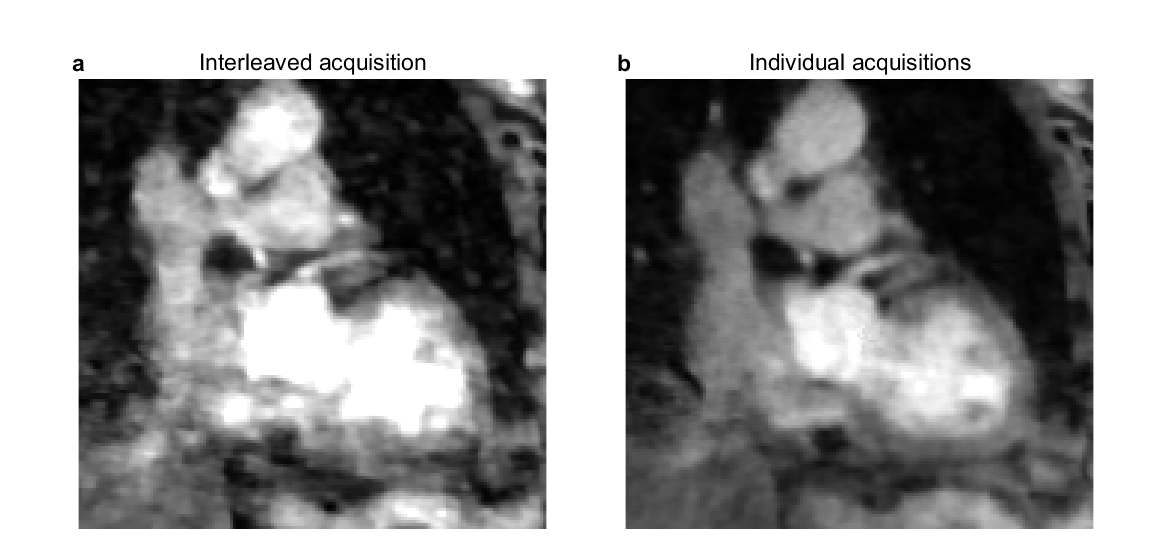
Figure 2 shows phase difference images of a static phantom acquired with an interleaved scan compared to phase difference images obtained from four individual scans. Interleaved acquisitions show less variations in mean velocities across repetitions. However, using individual scans, artefacts and phase gradients across the image are reduced, resulting in improved image homogeneity. This could be due to steady state disruptions in case of interleaved acquisitions, as this requires alternating between different types of gradient waveforms (flow compensating vs. flow encoding) for each TR.Figure 3 compares in-vivo images obtained at 3T using an interleaved acquisition to individual acquisitions in a volunteer with poor navigator efficiency. Although overall limited image quality, improved delineation of the coronaries is observed using the proposed acquisition.
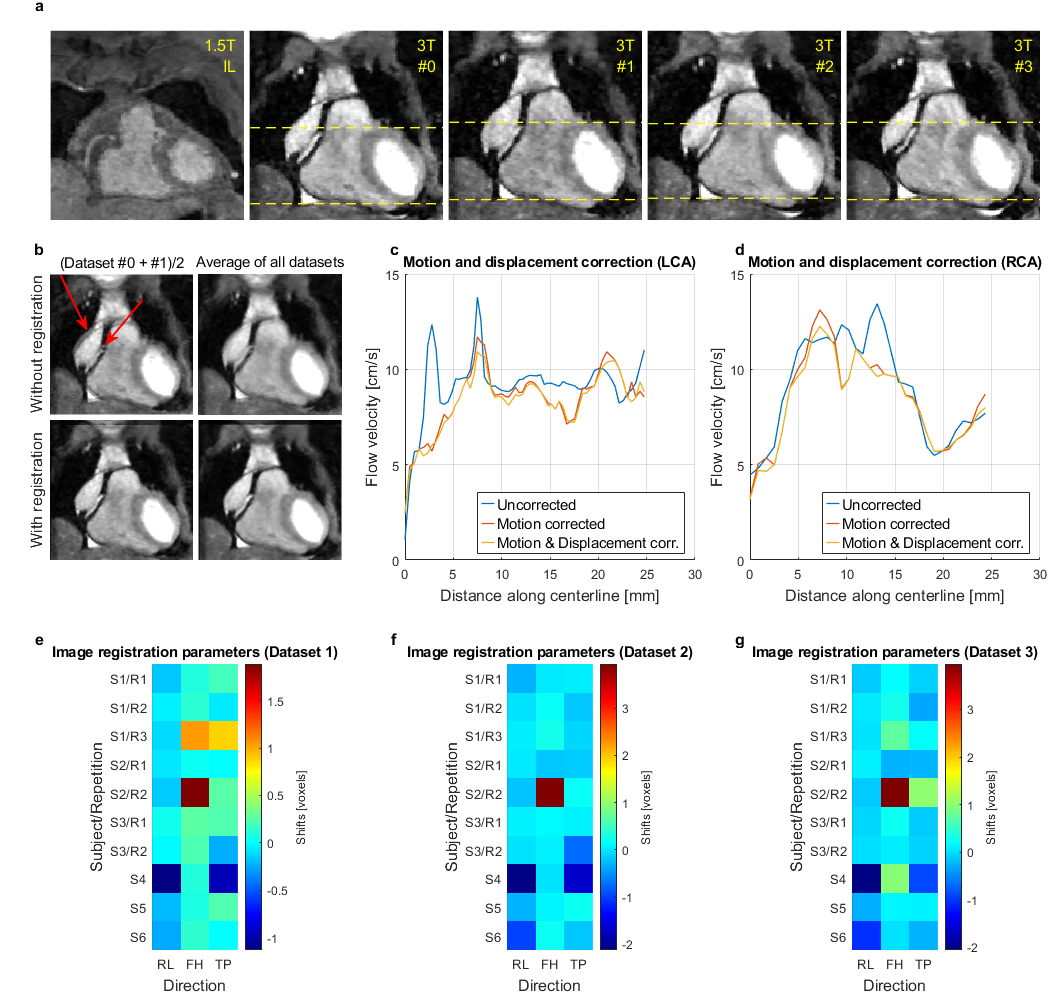
In-vivo acquisitions at 3T show increased SNR compared to 1.5T (Figure 4a) and improved sharpness after motion correction (Figure 4b), enabling better delineation of the arteries. Peak velocities per slice (PVPS) along the vessel centerlines for the LCA and RCA are shown in Figures 4c and d respectively for an exemplary volunteer, comparing correction strategies. Motion and displacement correction eliminate outliers and reduce overestimated peak values caused by surrounding noisy voxels. Correction shifts in pixels along the RL, FH and TP directions are shown in Figures 4e-g. Mean shifts are -0.3±0.6 voxels, 0.5±1.0 voxels and -0.1±0.5 voxels in the respective directions.
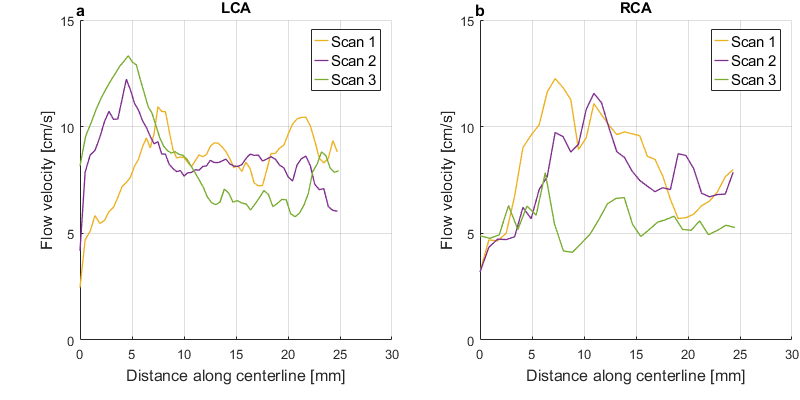
Figure 5 shows good intra-session agreement with visually shifted velocity curves for the LCA which could be due to a mismatch of the selected starting points. Larger inter-session deviations are potentially due to physiological variations.
Across all subjects and repetitions, the mean values of average PVPS in the proximal (<25mm along the centerline) arteries are 11.7±3.5cm/s for the LCA and 9.4±3.6cm/s for the RCA. The mean peak PVPS are 15.9±5.0cm/s and 14.1±4.9cm/s respectively. The mean PVPS are in line with previous results obtained at 1.5T4, therefore, results remain consistent at higher field strengths.
Conclusion
This study demonstrates the feasibility of 3D PC-MRI of the coronary arteries at 3T. Results agree with previous studies at 1.5T while benefitting from higher SNR and increased sharpness after motion correction. The method not only circumvents SAR restrictions at 3T, but also reduces intra-scan motion effects due to shorter scan times. In case of severe artefacts, single datasets may therewith be reacquired at a lower expense in scan time. Future works will evaluate the method in patients with confirmed CAD.Acknowledgements
No acknowledgement found.References
1. Pelc, Norbert J., et al. "Encoding strategies for three‐direction phase‐contrast MR imaging of flow." Journal of Magnetic Resonance Imaging 1.4 (1991): 405-413.
2. Steinman, David A., et al. “Combined analysis of spatial and velocity displacement artifacts in phase contrast measurements of complex flows.” Journal of Magnetic Resonance Imaging 7.2 (1997): 339-346.
3. Roberts, Grant S., et al. "Virtual injections using 4D flow MRI with displacement corrections and constrained probabilistic streamlines." Magnetic resonance in medicine 87.5 (2022): 2495-2511.
4. Lichthardt, Denise, et al. "3D phase contrast blood flow measurements in the coronary arteries." Proc. Intl. Soc. Mag. Reson. Med. 32: 3820 (2023).
Figures