3343
Automated prostate segmentation model to assess prostate zonal growth pattern in patients with benign prostate hyperplasia1Peking Union Medical College Hospital, Beijing, China
Synopsis
Keywords: Prostate, Prostate
Motivation: Prostate growth rate analysis helps to reveal the development of benign prostate hyperplasia.
Goal(s): To analyze the growth rates in different prostate zones using a previously developed segmentation model.
Approach: The prostate zonal volume and morphology features (zonal width, thickness, height, and sphericity) were computed from the automatic segmentation results to calculate the annual growth rate.
Results: The prostate whole gland volume and transition zone volume increased with age, while the peripheral zone volume decreased with age. Besides, prostate zonal volume growth rate varied between ages, and different locations of the prostate exhibited verified growth rates.
Impact: Prostate growth rate analysis could be done efficiently with the assistance of a deep-learning-based segmentation model. Our study facilitated a detailed investigation of prostate growth patterns and found that different zones and locations of the prostate exhibited different growth rates.
Introduction
Benign prostatic hyperplasia (BPH) refers to the nonmalignant hyperplasia of the prostate gland with increased prevalence with age (1). The dynamic evaluation of prostate volume growth rate is of clinical significance, which helps to reveal the biological behavior and development of the BPH (2). However, calculating the prostate zonal volume by the prolate ellipsoid formula using manual measurements would be time-consuming and showed bias compared with the segmentation method (3).In recent decades, deep learning-based automatic segmentation models have been well-developed, which greatly improved the efficiency of segmentation with satisfactory performance (4, 5). Besides, more morphology features can be computed easily based on the whole volume segmentation (6). Therefore, in this study, we aimed to analyze the growth rate and growth pattern of different zones of the prostate with the assistance of a previously developed prostate zonal segmentation model for MRI images.Methods
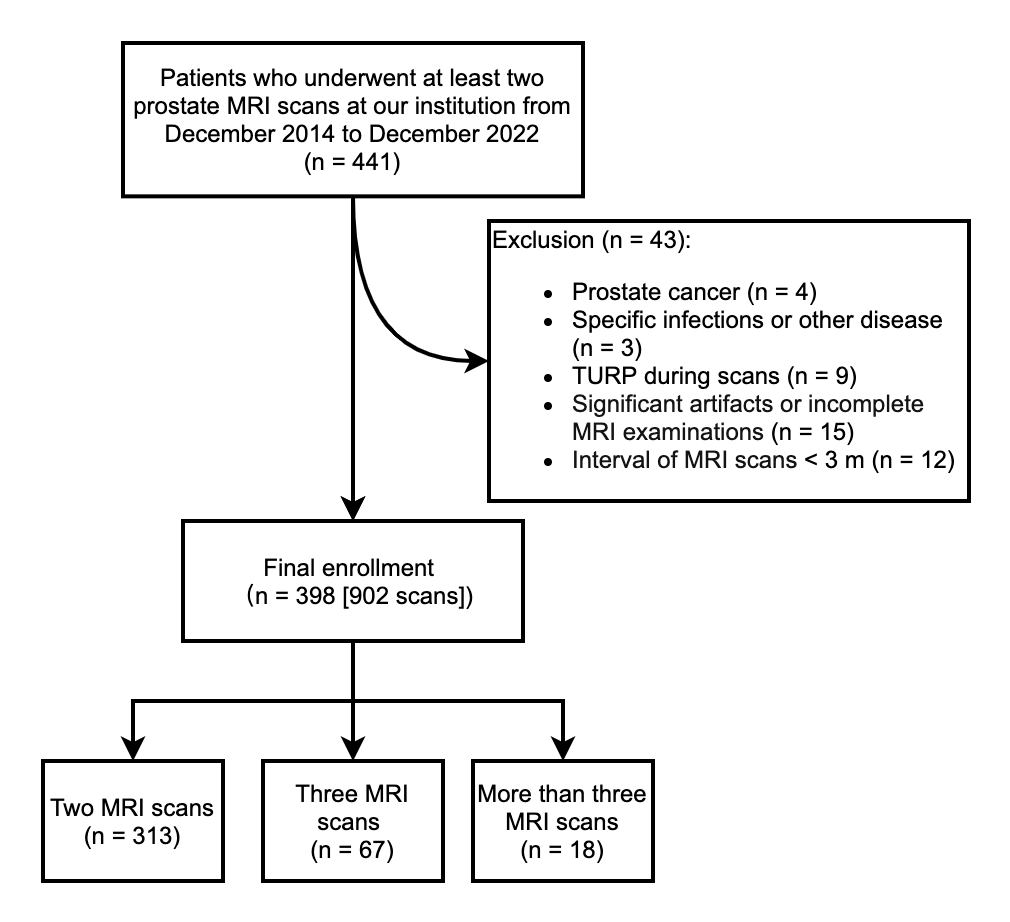
This retrospective study was IRB-approved. Consecutive patients who had undergone at least two prostate MRI scans at our institution between December 2014 and December 2022 were identified. Figure 1 shows the flow diagram of patient recruitment in this study. In total, 398 patients with 902 MRI scans were included in our study. Four 3.0T MRI scanners (GE750 [GE], Ingenia Elition [Philips], MAGNETOM Vida, and Skyra [Siemens]) were used to perform prostate MRI. Patients’ axial T2WI images were collected for automatic segmentation. The deep learning model used in this study can segment the prostate transition zone (TZ) and peripheral zone (PZ) simultaneously. One experienced radiologist reviewed and scored the results according to a five-point evaluation criteria (7), and revised the incorrect segmentation results. The following variables for prostate whole gland (WG), TZ, and PZ were calculated: (1) the volume of zonal glands; (2) the volume of the apex, midgland, and base; (3) the thickness, width, and height; (4) the sphericity; and (5) the TZ index (TZI). In this study, we calculate the absolute growth rate (AGR) and relative growth rate (RGR) of zonal volumes and morphology features. The Mann–Whitney U test was used to compare differences between the groups and adjusted using the Bonferroni method. The locally weighted scatterplot smoothing (LOESS) curves were used to fit the variation trend between 2 continuous variables, and their correlation was calculated using the Spearman method. A two-sided p-value <0.05 was considered to be statistically significant. All of the statistical analyses were performed in R software (version 4.2.1).Results
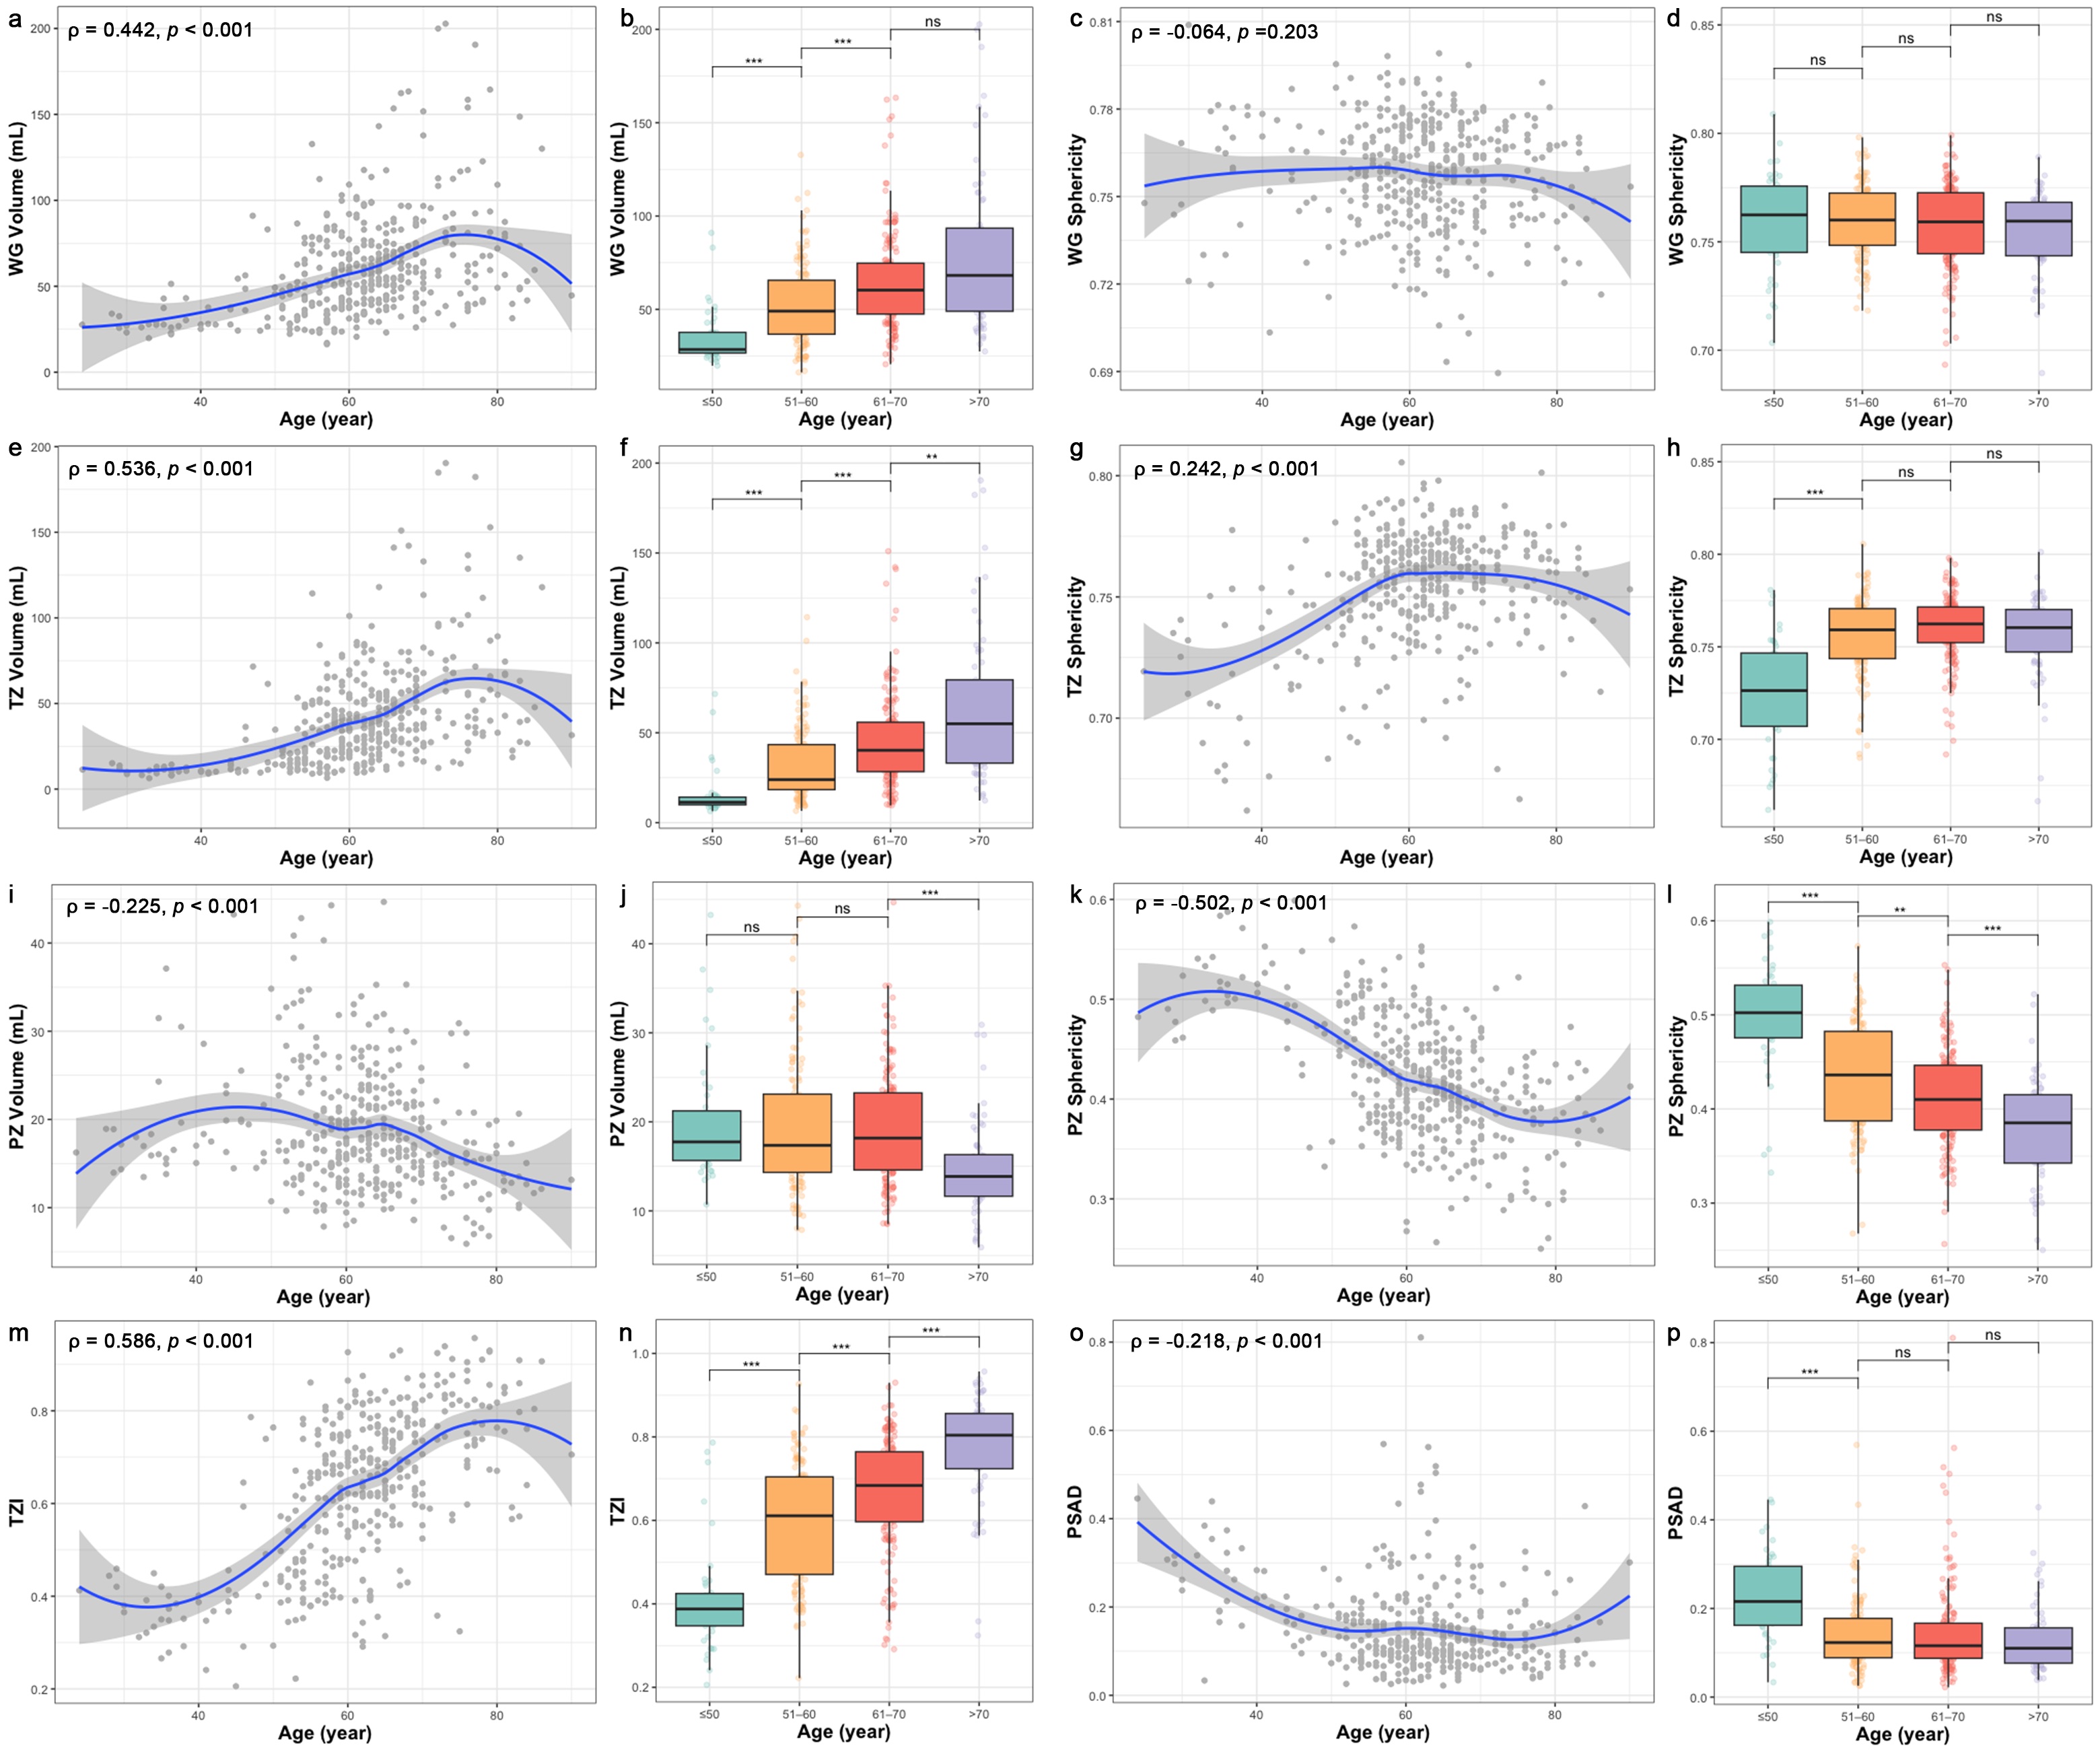
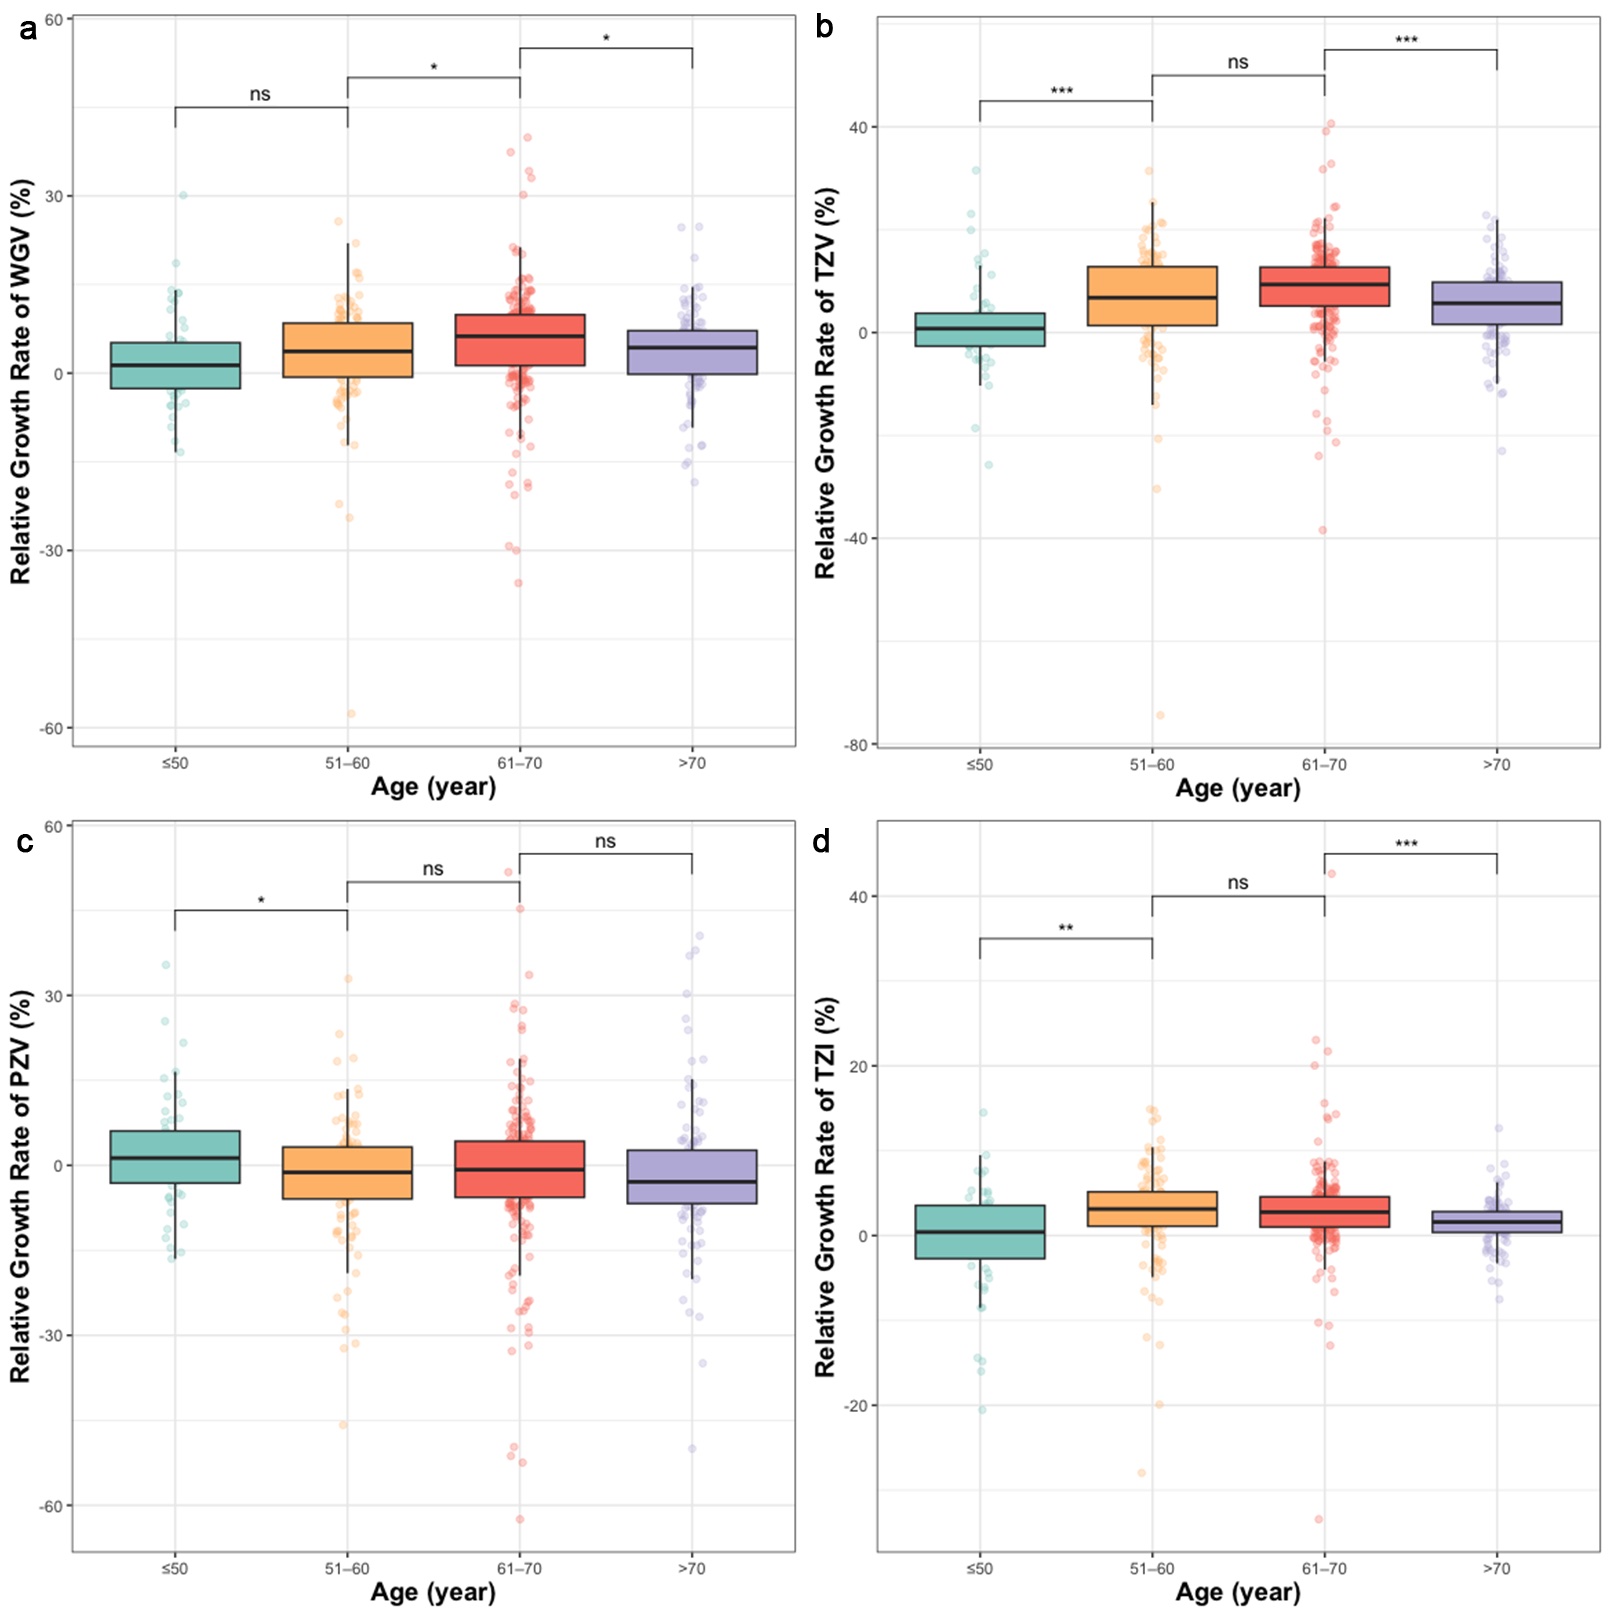
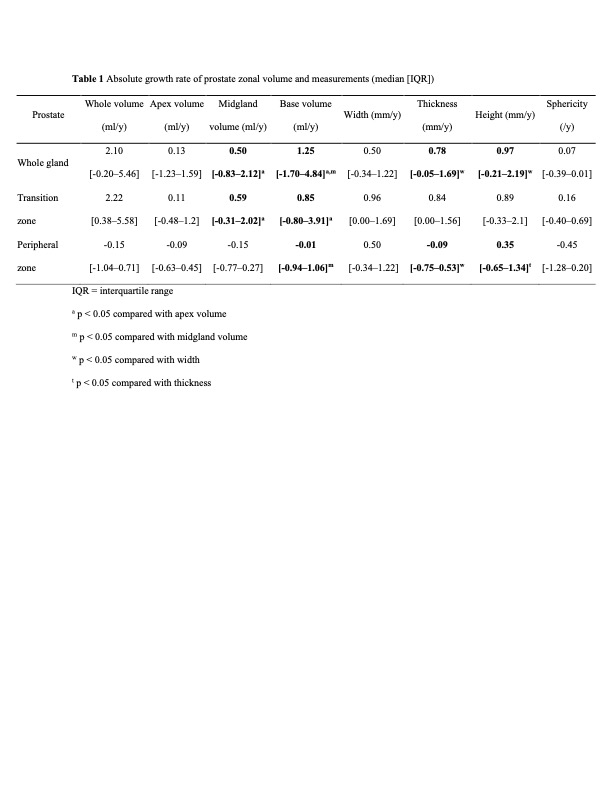
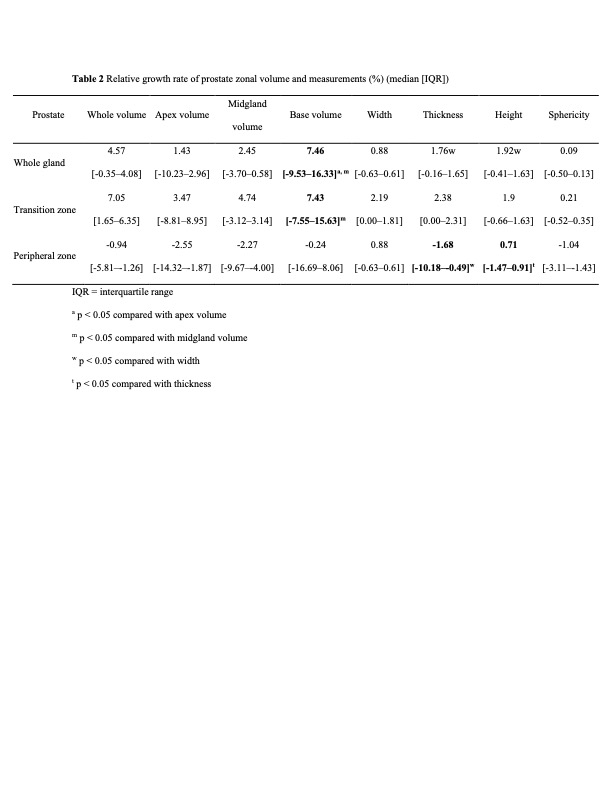
The median age of included patients was 62.0 [interquartile range (IQR]), 57.0–68.0] years old. Most of the model’s segmentation results met clinical satisfaction with a subjective score of 5 (94.6% [853/902]) and 4 (4.66% [42/902]). The correlation analysis showed that the prostate WG and TZ volume and TZ sphericity increased with age (ρ=0.442, 0.536, and ρ=0.242, respectively), while the PZ volume and sphericity decreased with age (ρ=-0.225 and -0.502, respectively) (Figure 2). The median AGR of TZ volume was 2.22 [0.38–5.58] mL/y, and the volume of the base and midgland showed significantly higher AGR than the apex (all p<0.05) (Table 1). The median AGR of PZv was -0.15 [-1.04–0.71] mL/y. The PZ showed an increase in width and height, but a decrease in thickness. The RGR of TZ volume was 7.05 [1.65–6.35] %/y, and the value for the TZ base was significantly higher than that of the midgland (p=0.003) (Table 2). Patients aged 51–60 years showed significantly higher RGR than patients aged < 50 years, while patients aged >70 years showed significantly lower RGR than patients aged 61–70 years (Figure 3). As for PZ, the value was -0.94 [-5.81–-1.26] %/y, and no statistical significance was found between different locations (all p>0.05). While the RGR of PZ in 51–60 age years was significantly lower than that in the ≤50 age group (p<0.05).Discussion
In this study, we revealed the development of prostate zonal volume in detail with the assistance of the deep learning-based segmentation model. By analysis, we demonstrated that the prostate zonal volume and morphology features changed with age. In addition, the growth rate of the prostate zonal volume and morphology measurements varied between ages and zones. More importantly, by whole volume segmentation, our study demonstrated that different locations of the prostate, the apex, midgland, and base, would show different growth rates, which contributed to the heterogenous growth pattern of prostate zones.Conclusion
In conclusion, we found that prostate zonal volume and its growth rate varied between ages. Besides, our study facilitated a detailed investigation of prostate growth patterns and found that different locations of the prostate exhibited different growth rates.Acknowledgements
Not applicable.References
1. Berry SJ, Coffey DS, Walsh PC, Ewing LL. The development of human benign prostatic hyperplasia with age. The Journal of urology 1984;132(3):474-9.
2. Marks LS, Roehrborn CG, Wolford E, Wilson TH. The effect of dutasteride on the peripheral and transition zones of the prostate and the value of the transition zone index in predicting treatment response. The Journal of urology 2007;177(4):1408-13.
3. Thimansson E, Bengtsson J, Baubeta E, et al. Deep learning algorithm performs similarly to radiologists in the assessment of prostate volume on MRI. European radiology 2022.
4. Xu L, Zhang G, Zhang D, et al. Development and clinical utility analysis of a prostate zonal segmentation model on T2-weighted imaging: a multicenter study. Insights Imaging 2023;14(1):44.
5. Soerensen SJC, Fan RE, Seetharaman A, et al. Deep Learning Improves Speed and Accuracy of Prostate Gland Segmentations on Magnetic Resonance Imaging for Targeted Biopsy. The Journal of urology 2021;206(3):604-12.
6. Perez AA, Noe-Kim V, Lubner MG, et al. Deep Learning CT-based Quantitative Visualization Tool for Liver Volume Estimation: Defining Normal and Hepatomegaly. Radiology 2022;302(2):336-42.
7. Xu L, Zhang G, Zhang D, et al. Development and acceptability validation of a deep learning-based tool for whole-prostate segmentation on multiparametric MRI: a multicenter study. Quantitative imaging in medicine and surgery 2023;13(5):3255-65.
Figures