3342
Prostate Specific Antigen Density Normalized by Volume Fractions from Hybrid Multi-dimensional MRI Can Improve Prostate Cancer Diagnosis1Department of Radiology, University of Chicago, Chicago, IL, United States, 2Sanford J. Grossman Center of Excellence in Prostate Imaging and Image Guided Therapy, Chicago, IL, United States, 3Department of Pathology, University of Chicago, Chicago, IL, United States
Synopsis
Keywords: Prostate, Prostate
Motivation: Prostate specific antigen(PSA) and PSA density (PSAD) are inadequate for PCa screening.
Goal(s): Our goal was to combine PSA and MRI measures from Hybrid Multi-dimensional MRI (HM-MRI) to improved PCa diagnosis.
Approach: Blood PSA level, prostate volume from mpMRI and tissue volumes (epithelium, lumen) from HM-MRI were used to measure PSAD and PSAD normalized by tissue type (nPSAD).
Results: nPSADepithelium is significantly lower and nPSADlumen is significantly higher in cancer patients compared to benign subjects. The diagnostic accuracy of nPSAD to detect subjects with PCa, was significantly higher than conventional PSAD, and further improved by combining nPSAD with tissue composition measures from HM-MRI.
Impact: We introduce a new cancer biomarker that combines PSA (blood-based biomarker) with tissue composition from HM-MRI. nPSADlumen and nPSADepithelium improve PCa diagnosis. These new biomarkers may signal effects of PCa on normal prostate and may indicate cancer aggressiveness.
Introduction
Prostate specific antigen (PSA) and PSA density (PSAD) have played a part in prostate cancer (PCa) diagnosis. An elevated PSA level may be caused by PCa but can also be caused by other conditions, including an enlarged prostate (benign prostatic hyperplasia) and inflammation (prostatitis) and therefore PSA has low specificity and low positive predictive value for PCa diagnosis (1). Even correcting for prostate size, PSAD is inadequate for PCa screening (2). As a result, MRI is increasing being used for PCa diagnosis.PSA is produced in prostate epithelial cells and stored in in lumen (prostatic fluid) which has the highest concentration of PSA. We have developed a way of measuring volume fractions of epithelium, stroma, and lumen non-invasively using Hybrid Multidimensional MRI (HM-MRI) (3,4). Thus, we can specifically measure the volumes of tissue components that produce, secrete and store PSA and combine PSA and MRI measures for improved PCa diagnosis. The purpose of this study is to determine whether PSA density normalized by epithelial, stromal, and luminal fractional volume (nPSAD) from HM-MRI provides a useful independent biomarker that improves prostate cancer (PCa) diagnosis in comparison to conventional PSAD.
Materials and Methods
In this study, patients with suspected PCa underwent 3T multi-parametric MRI (mpMRI) along with HM-MRI (TE= 57, 75, 150, 200ms, b-values= 0, 150, 750, 1500s/mm2) followed by biopsy. Clinical information: PSA level and prostate volume from mpMRI were used to measure PSAD. Prostate tissue composition (fractional volumes of stroma, epithelium, and lumen) was calculated using a three-compartment model fit to HM-MRI data similar to the previous studies (3, 4). Average fractional volumes over the entire prostate including cancers (if any) were measured with HM-MRI for each subject to calculate nPSAD (Figure 1) using the formula.$$$nPSAD_{tissue}=PSA/(prostate\;volume\times\;average\;fractional\;volume\;of\;tissue\;type)$$$
PSAD and nPSAD results were compared for subjects with benign conditions vs. clinically significant cancers using t-test and diagnostic performance was determined by ROC analysis.
Results
20 benign and 19 cancer (10 Gleason 3+4, 3 Gleason 4+3, 4 Gleason 4+4, 2 Gleason 4+5) subjects were included.PSAD was only nominally (p=0.14) higher in men with cancer (0.19±0.11 ng/ml2) compared to benign subjects (0.15±0.08 ng/ml2).
PCa subjects had significantly higher epithelium (31.6±7.2 vs 17.9±5.2%, p<0.001) and reduced lumen (27.4±9.0 vs 40.4±9.8%, p<0.001) than benign subjects.
nPSADepithelium (PSA produced per unit volume of cells producing them) in men with PCa (0.60±0.27 ng/ml2) is significantly (p=0.03) lower than benign subjects (0.92±0.57 ng/ml2). nPSADlumen (PSA per unit volume of ductal space) in men with PCa (0.81±0.66 ng/ml2) is significantly (p=0.01) higher than benign subjects (0.38±0.22 ng/ml2).
The diagnostic accuracy (AUC) of nPSAD to detect subjects with PCa, was significantly higher than conventional PSAD (0.61), with nPSADlumen showing the best performance (0.76) followed by nPSADepithelium (0.64). Combining tissue composition with nPSAD measures from HM-MRI further improves performance (AUC=0.97).
Discussion
Even though PSA is produced by both benign epithelial and cancer cells, the level of expression on a per cell basis in PCa is known to be significantly lower by previous immunohistochemical studies(5-7), which is evidenced by lower nPSADepitheliumin subjects with PCa than subjects with no PCa. A decrease in the average luminal space in the prostate is correlated with an increase PSA in the blood.Normalizing PSAD with tissue measures allowed us to detect the effect of PCa on secretion of PSA by the entire prostate. The effect of the cancer on nPSADlumen and nPSADepithelium is too large to be explained by the change in the overall volume in the prostate of lumen and epithelium caused by the cancer. The volumes of the cancers studied and the differences between volume fractions of lumen and epithelium in cancer vs. benign tissue cannot produce a doubling (in the case of nPSADlumen) or even a 50% increase (in the case of nPSADepithelium) measured in this study. This suggests that changes in the secretion of PSA in men with cancer cannot be explained by a linear combination of epithelium or lumen in cancer plus benign tissue. Rather the results suggest that the change in epithelium and lumen in the cancer has a systemic effect on the entire prostate. This is likely due to secretion of factors by the cancer. Based on this – we hypothesize that the new biomarker presented here provides independent information regarding cancer aggressiveness. This information can be combined with measures of tissue composition from HM-MRI to improve diagnostic accuracy, as demonstrated by the large increase in AUC achieved by combining nPSAD with tissue composition from HM-MRI.
Conclusion
This study demonstrates that nPSAD combined with non-invasive tissue composition measures from HM-MRI can improve PCa diagnosis.Acknowledgements
This research was funded by NIH (R01 CA227036, 1R41CA244056-01A1, R01 CA17280, 1S10OD018448-01), and Sanford J. Grossman Charitable Trust.References
1. Catalona WJ, Southwick PC, Slawin KM, et al. Comparison of percent free PSA, PSA density, and age-specific PSA cutoffs for prostate cancer detection and staging. Urology. 2000; 56(2):255-60.
2. Feyisetan O, Ezenwa V, Ramadhan M, et al. The Predictive Value of Prostate-Specific Antigen Density: A Retrospective Analysis of Likert 3 Multiparametric MRI of the Prostate. Cureus. 2023; 15(9):e45782.
3. Chatterjee A, Bourne R, Wang S, et al. Diagnosis of Prostate Cancer with Noninvasive Estimation of Prostate Tissue Composition by Using Hybrid Multidimensional MR Imaging: A Feasibility Study. Radiology. 2018; 287(3):864-72.
4. Chatterjee A, Mercado C, Bourne RM, et al. Validation of prostate tissue composition measurement using Hybrid Multidimensional MRI: Correlation with quantitative histology. Proc Intl Soc Mag Reson Med (ISMRM). Montreal, Canada 2019; 0986.
5. Magklara A, Scorilas A, Stephan C, et al. Decreased concentrations of prostate-specific antigen and human glandular kallikrein 2 in malignant versus nonmalignant prostatic tissue. Urology. 2000; 56(3):527-32.
6. Pretlow TG, Pretlow TP, Yang B, et al. Tissue concentrations of prostate-specific antigen in prostatic carcinoma and benign prostatic hyperplasia. Int J Cancer. 1991; 49(5):645-9.
7. Balk SP, Ko Y-J, Bubley GJ. Biology of Prostate-Specific Antigen. Journal of Clinical Oncology. 2003; 21(2):383-91.
Figures
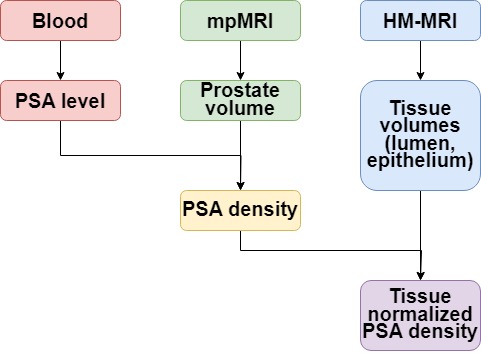
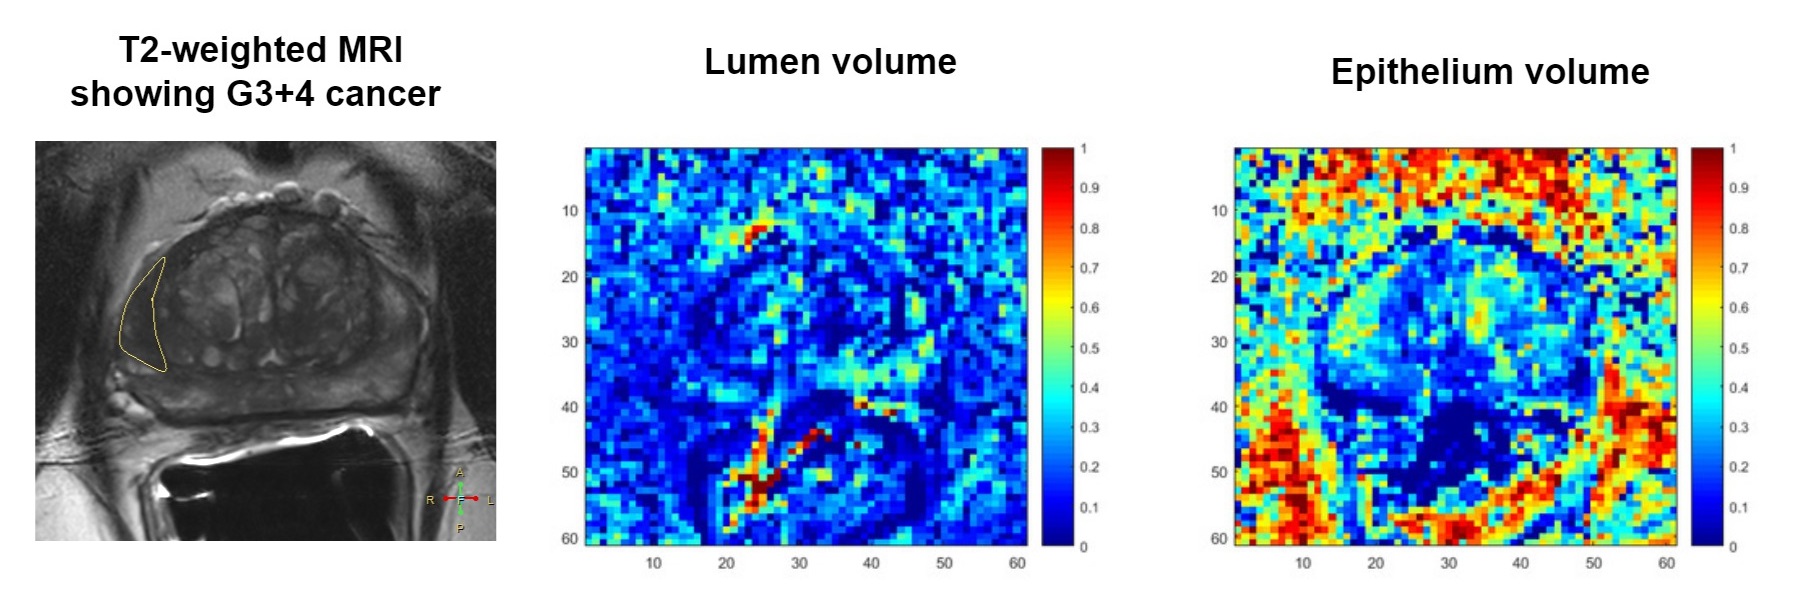
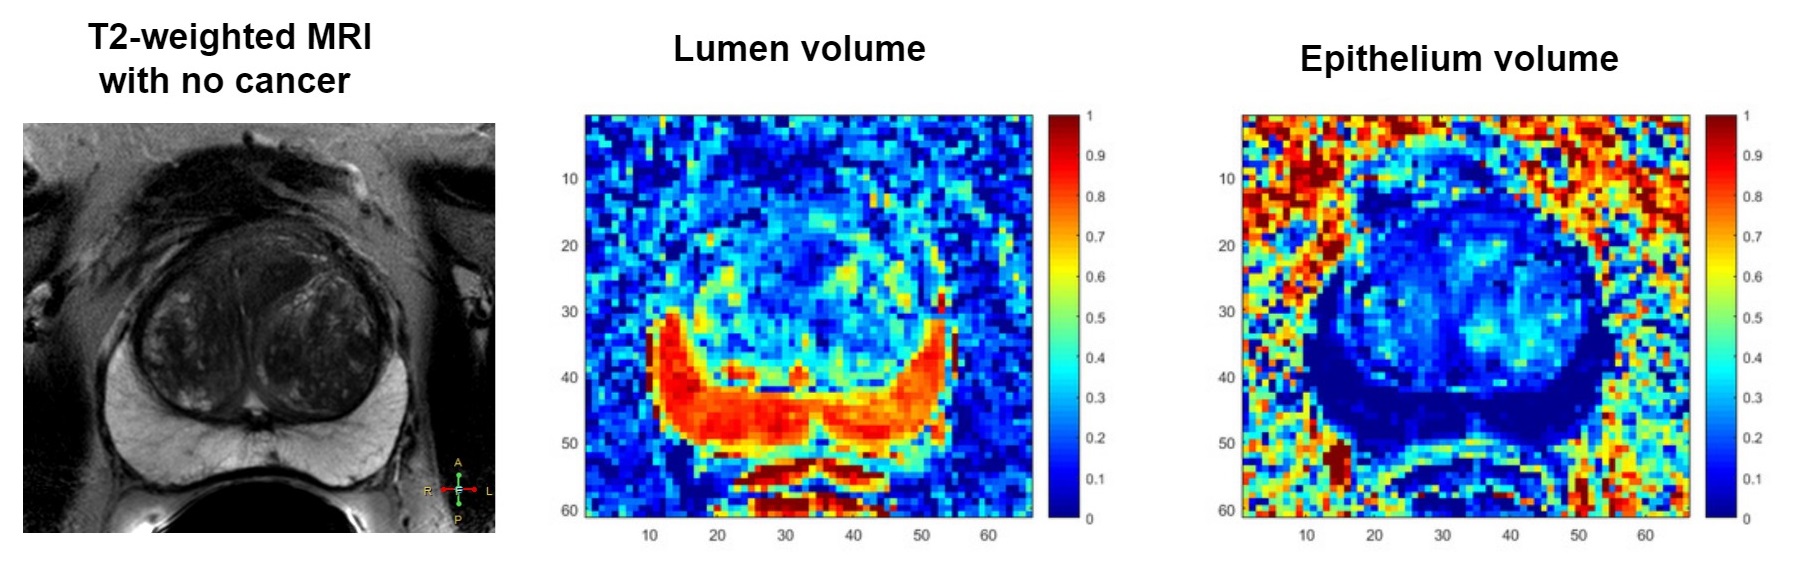
Figure 3: Patient with PSA of 11.1 ng/ml and prostate volume of 96.8 cc with no cancer. PSAD was 0.11 ng/ml2 and normalized PSAD: nPSADepithelium was 0.81 ng/ml2 and nPSADlumen was 0.25 ng/ml2.