3341
MRI-based Radiomics Analysis for Clinically Significant Prostate Cancer Diagnosis using a Standardized Prostate Segmentation Model1Radiology, University of California, Los Angeles, Los Angeles, CA, United States
Synopsis
Keywords: Prostate, Prostate, Prostate Cancer, Radiomics Analysis
Motivation: Despite the growing use of multiparametric MRI (mpMRI), there remains an unmet need for additional quantitative methods to improve prostate cancer (PCa) localization by prostate anatomic zones.
Goal(s): To extract radiomics features that determine differences in detection rates (DRs) and positive predictive values (PPV) for clinically significant PCa (csPCa).
Approach: We extracted shape- and first-order based features from 543 csPCa lesions across 468 male subjects and used the Mann-Whitney U test to assess differences in key features.
Results: csPCa lesions located at anterior and TZ prostate regions had significantly larger shape-based features and significantly smaller first-order features than posterior and PZ regions, respectively.
Impact: For patients with csPCa, significant radiomics features extracted from mpMRI lesions in the anterior and transition zone prostate regions show significantly larger shape-based features and significantly smaller first-order features than csPCa lesions in the posterior and peripheral zone regions, respectively.
Introduction
Multiparametric MRI (mpMRI) has been considered the best imaging modality for non-invasive prostate cancer (PCa) and clinically significant PCa (csPCa) diagnosis to localize PCa lesions by prostate anatomic zones. Considering how PCa currently accounts for more than 10% of cancer-related deaths in males and is the most common non-cutaneous malignancy in males, it is important to address the performance of mpMRI findings to detect csPCa early on to improve patient prognosis [1]. The region-based performance of csPCa diagnosis has been compared to whole-mount histopathology (WMHP) as the reference standard to highlight areas within the prostate requiring further clinical attention. These areas are defined as sectors by the Prostate Imaging Reporting and Data System (PI-RADS) version 2.1 [1]. Despite its growing use, PI-RADS can be further improved for csPCa lesion localization through quantitative imaging features extracted from medical images, which machine learning (ML) techniques have introduced as radiomics features [2]. This study aims to evaluate the sector-based performance of mpMRI for accurate csPCa lesion detection through spatial characterization across prostate-gland regions. These regions are described by the standardized prostate sector model which consists of forty-one distinct sectors used to localize csPCa lesions [3]. We then extracted radiomics features for region-specific tumors by combining T2w images acquired from 3T mpMRI with manually countered csPCa lesions. Both image and lesion mask files are used to extract shape- and first-order-based features to differentiate region-specific tumor characteristics [4].Methods
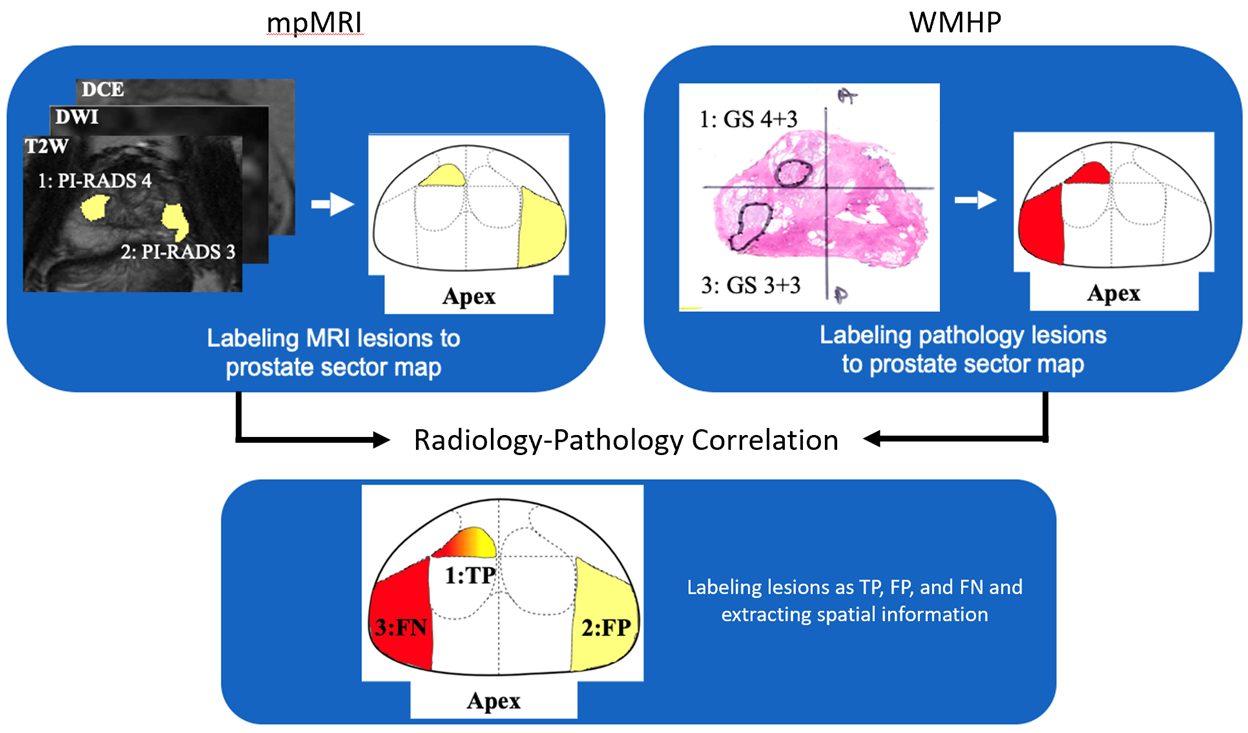
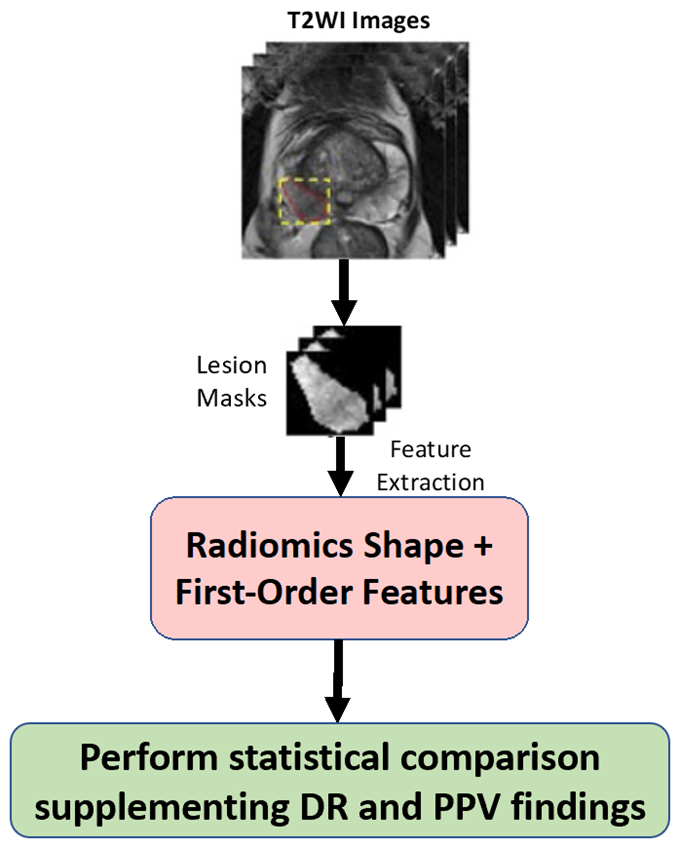
In this IRB-approved study group, we reviewed 1,153 consecutive men that underwent mpMRI prior to radical prostatectomy. Across these men were 2,152 PCa lesions of which 1,060 were csPCa lesions. Genitourinary (GU) radiologists and GU pathologists performed a matching workflow to identify true positive (TP), false positive (FP), and false negative (FN) lesions across all subjects, the workflow of which is summarized in Figure 1. These components were combined to determine relative cancer prevalence (rCP), detection rates (DRs), and positive predictive values (PPVs) across the prostate-gland and individual sectors of the prostate sector map. We used a weighted chi-square test to correlate statistical differences for DR and PPV for sectors established across different prostate regions. We secondly implemented our radiomic feature extraction using pyradiomics for regions that demonstrate significant differences for DR or PPV on a subset of 543 csPCa lesions across 468 men. The workflow of this radiomic analysis is summarized in Figure 2. A total of 14 shape- and 18 first-order-based features were extracted, and using nonparametric statistical testing in the form of the Mann-Whitney U test we determined significant differences for features between regions.Results
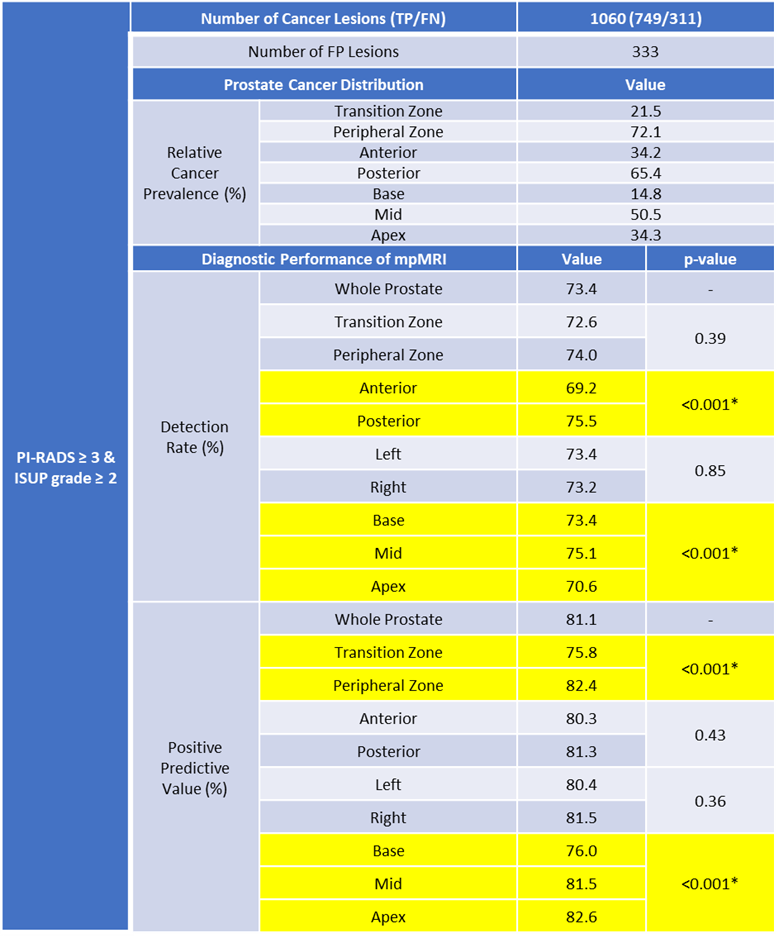
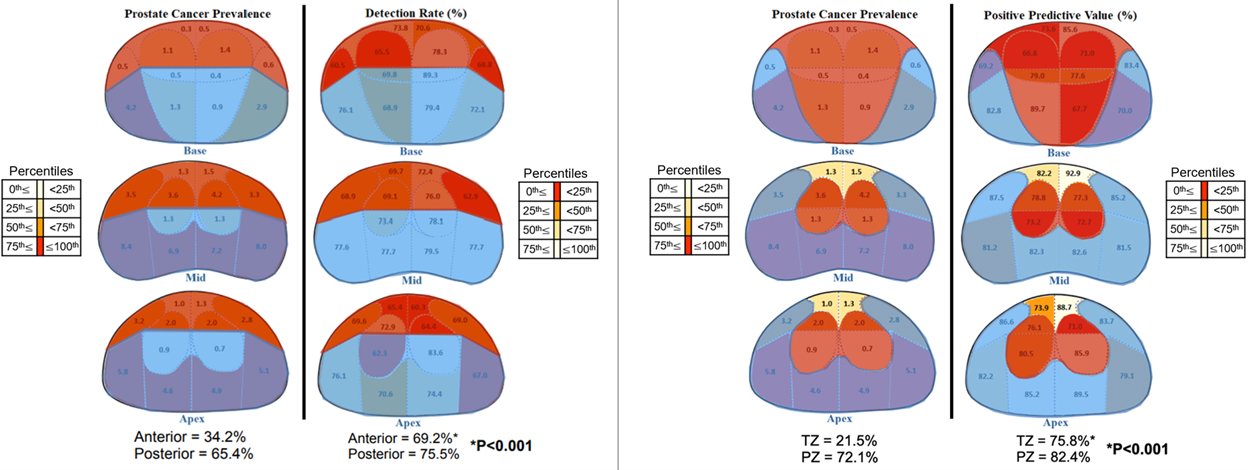
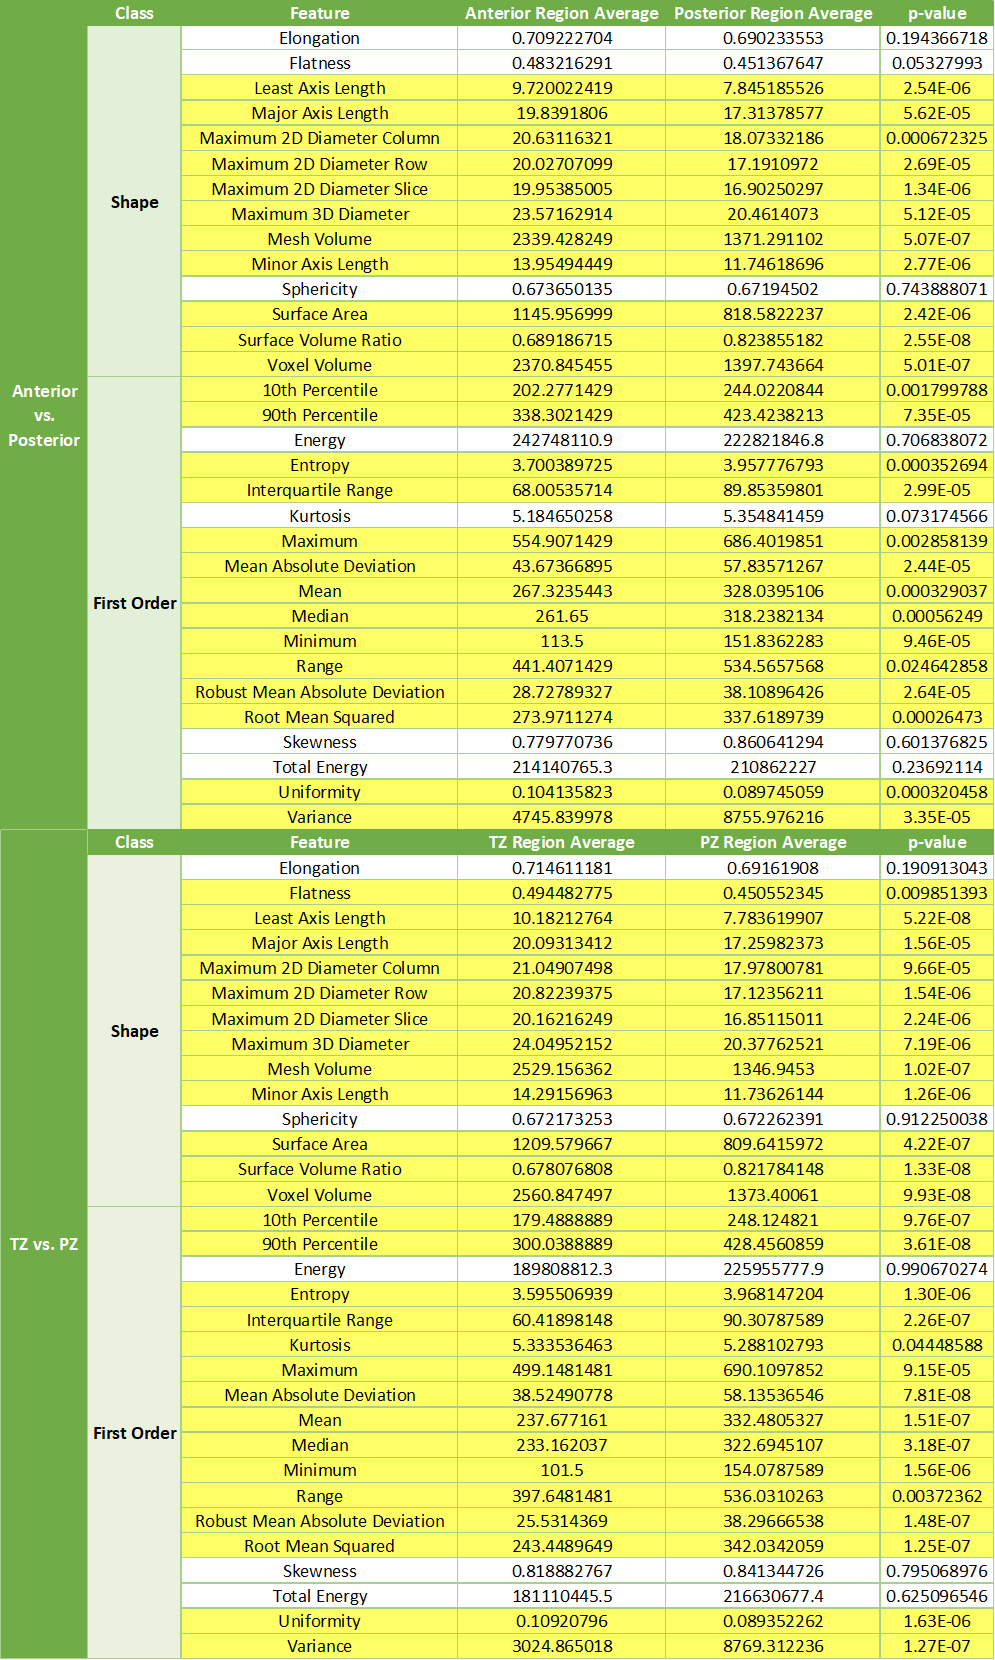
Table 1 summarizes the csPCa characteristics for rCP, DR, and PPV on mpMRI and WMHP. The results from our weighted chi-square test show significant differences in DR for anterior vs. posterior regions and PPV for TZ vs. PZ regions. Both DR and PPV were significantly difference for base vs. mid vs. apex prostate regions. The spatial-heatmaps which illustrate the findings for our sector-based analysis can be seen in Figure 3. Not only do we find higher rCP in posterior and PZ prostate regions, but we have a significantly higher DR and PPV for csPCa lesions located in the posterior (75.5%) vs. anterior (69.2%) regions and PZ (82.4%) vs. TZ (75.8%) regions, respectively. The summarized findings for our radiomic feature extraction can be seen in Table 2. For anterior vs. posterior csPCa lesions, 11 shape- (p<0.001) and 14 first-order-based (p<0.05) features were significantly different. For TZ vs posterior csPCa lesions, 12 shape- (p<0.01) and 15 first-order-based (p<0.05) features were significantly different.Discussion
The key differences shown for DR and PPV for csPCa lesions in our region-based comparison provide interesting findings reflected in the extracted radiomics features. Shape-based features that were significantly different for both posterior and PZ regions were all smaller on average compared to anterior and TZ regions, respectively. On the other hand, first-order-based features that were significantly different for both posterior and PZ regions were nearly all larger on average compared to anterior and TZ regions, respectively. For our future work we will continue improving our workflow by incorporating more mpMRI and texture features as well as an integrative feature selection to filter radiomics features of highest relevance.Conclusion
We have identified prostate anatomical regions that are significantly different for DR and PPV using the standardized prostate sector model and showed several radiomics features that are significantly different between the corresponding anatomical regions. These findings indicate that further attention to csPCa lesions in these regions could assist in clinical decision making and provide more personalized treatment planning across PCa study groups.Acknowledgements
This work was supported by the National Institutes of Health (NIH) R01-CA248506 and R01-CA272702, and funds from the Integrated Diagnostics Program, Departments of Radiological Sciences & Pathology, David Geffen School of Medicine at UCLA.References
[1] Yilmaz, E. C., Shih, J. H., Belue, M. J., Harmon, S. A., Phelps, T. E., Garcia, C., ... & Turkbey, B. (2023). Prospective Evaluation of PI-RADS Version 2.1 for Prostate Cancer Detection and Investigation of Multiparametric MRI–derived Markers. Radiology, 221309.
[2] Schwier, M., Van Griethuysen, J., Vangel, M. G., Pieper, S., Peled, S., Tempany, C., ... & Fedorov, A. (2019). Repeatability of multiparametric prostate MRI radiomics features. Scientific reports, 9(1), 1-16.
[3] Wibulpolprasert, P., Raman, S. S., Hsu, W., Margolis, D. J., Asvadi, N. H., Khoshnoodi, P., ... & Reiter, R. E. (2020). Influence of the location and zone of tumor in prostate cancer detection and localization on 3-T multiparametric MRI based on PI-RADS version 2. American Journal of Roentgenology, 214(5), 1101-1111.
[4] Chen, T., Zhang, Z., Tan, S., Zhang, Y., Wei, C., Wang, S., ... & Hu, J. (2022). MRI Based Radiomics Compared With the PI-RADS V2. 1 in the Prediction of Clinically Significant Prostate Cancer: Biparametric vs Multiparametric MRI. Frontiers in Oncology, 11, 792456.
Figures