3340
Retrospectively quantified T2 detects prostate cancer progression in patients undergoing active surveillance1Biomedical Imaging Research Institute, Cedars-Sinai Medical Center, Los Angeles, CA, United States, 2Bioengineering, University of California, Los Angeles, Los Angeles, CA, United States, 3Minimal Invasive Urology, Cedars-Sinai Medical Center, Los Angeles, CA, United States, 4Imaging/Nuclear Medicine, Cedars-Sinai Medical Center, Los Angeles, CA, United States, 5Imaging, Cedars-Sinai Medical Center, Los Angeles, CA, United States, 6Urology, Cedars-Sinai Medical Center, Los Angeles, CA, United States
Synopsis
Keywords: Prostate, Quantitative Imaging, Active Surveillance, Prostate Cancer, T2 Mapping
Motivation: Multiparametric MRI as a widespread tool for AS management has limitations of diagnostic dilemma and inconsistency in identifying pathologic reclassification.
Goal(s): To further investigate the added value of estimated T2 maps generated by deep learning network on AS.
Approach: Retrospectively estimated T2 maps from T1WI and T2WI using a trained deep learning network. Quantitative analysis was performed on the same lesion ROIs of the estimated T2 maps on baseline and follow-up for progression differentiations.
Results: The estimated T2 is consistent with the intensity level of the prostate tumor. T-test results verified the significant difference of the mean T2 values between processor and non-progressor.
Impact: The estimated T2 information derived from standard clinical MRI has the potential for more accurate PCa progression detection.
1. INTRODUCTION:
Prostate cancer (PCa) is one of the most common types of cancer in men1. Most men with low-intermediate risk PCa will be monitored with active surveillance (AS)2. Multiparametric MRI as a noninvasive imaging tool is widely used to improve the management of AS3,4. However, diagnostic dilemmas5,6 and the consistency of identifying pathologic reclassification exist3.Recently, T2 relaxometry showed a high diagnostic accuracy in diagnosing and characterizing PCa aggressiveness7–9. Previous work from our group using a deep learning-based method to estimated T2 maps from weighted images addressed the availability problem10 since the T2 map was not been included in the clinical imaging routine.
In this study, we further assessed the value of retrospectively estimated T2 mapping on detecting histopathological PCa progression on AS patients.
2. METHODS:
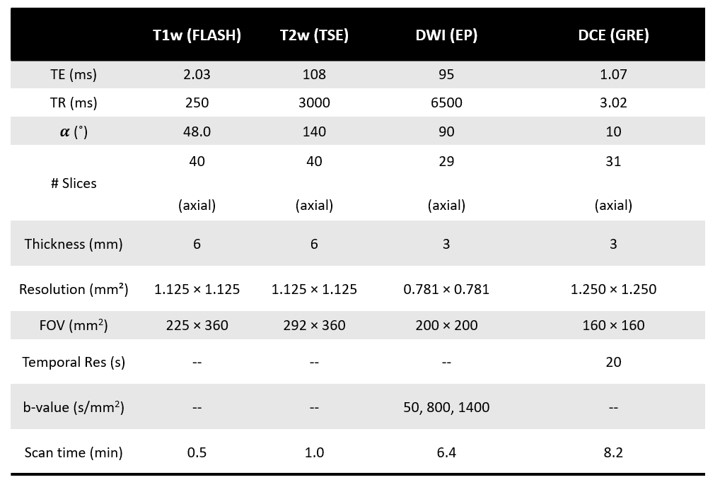
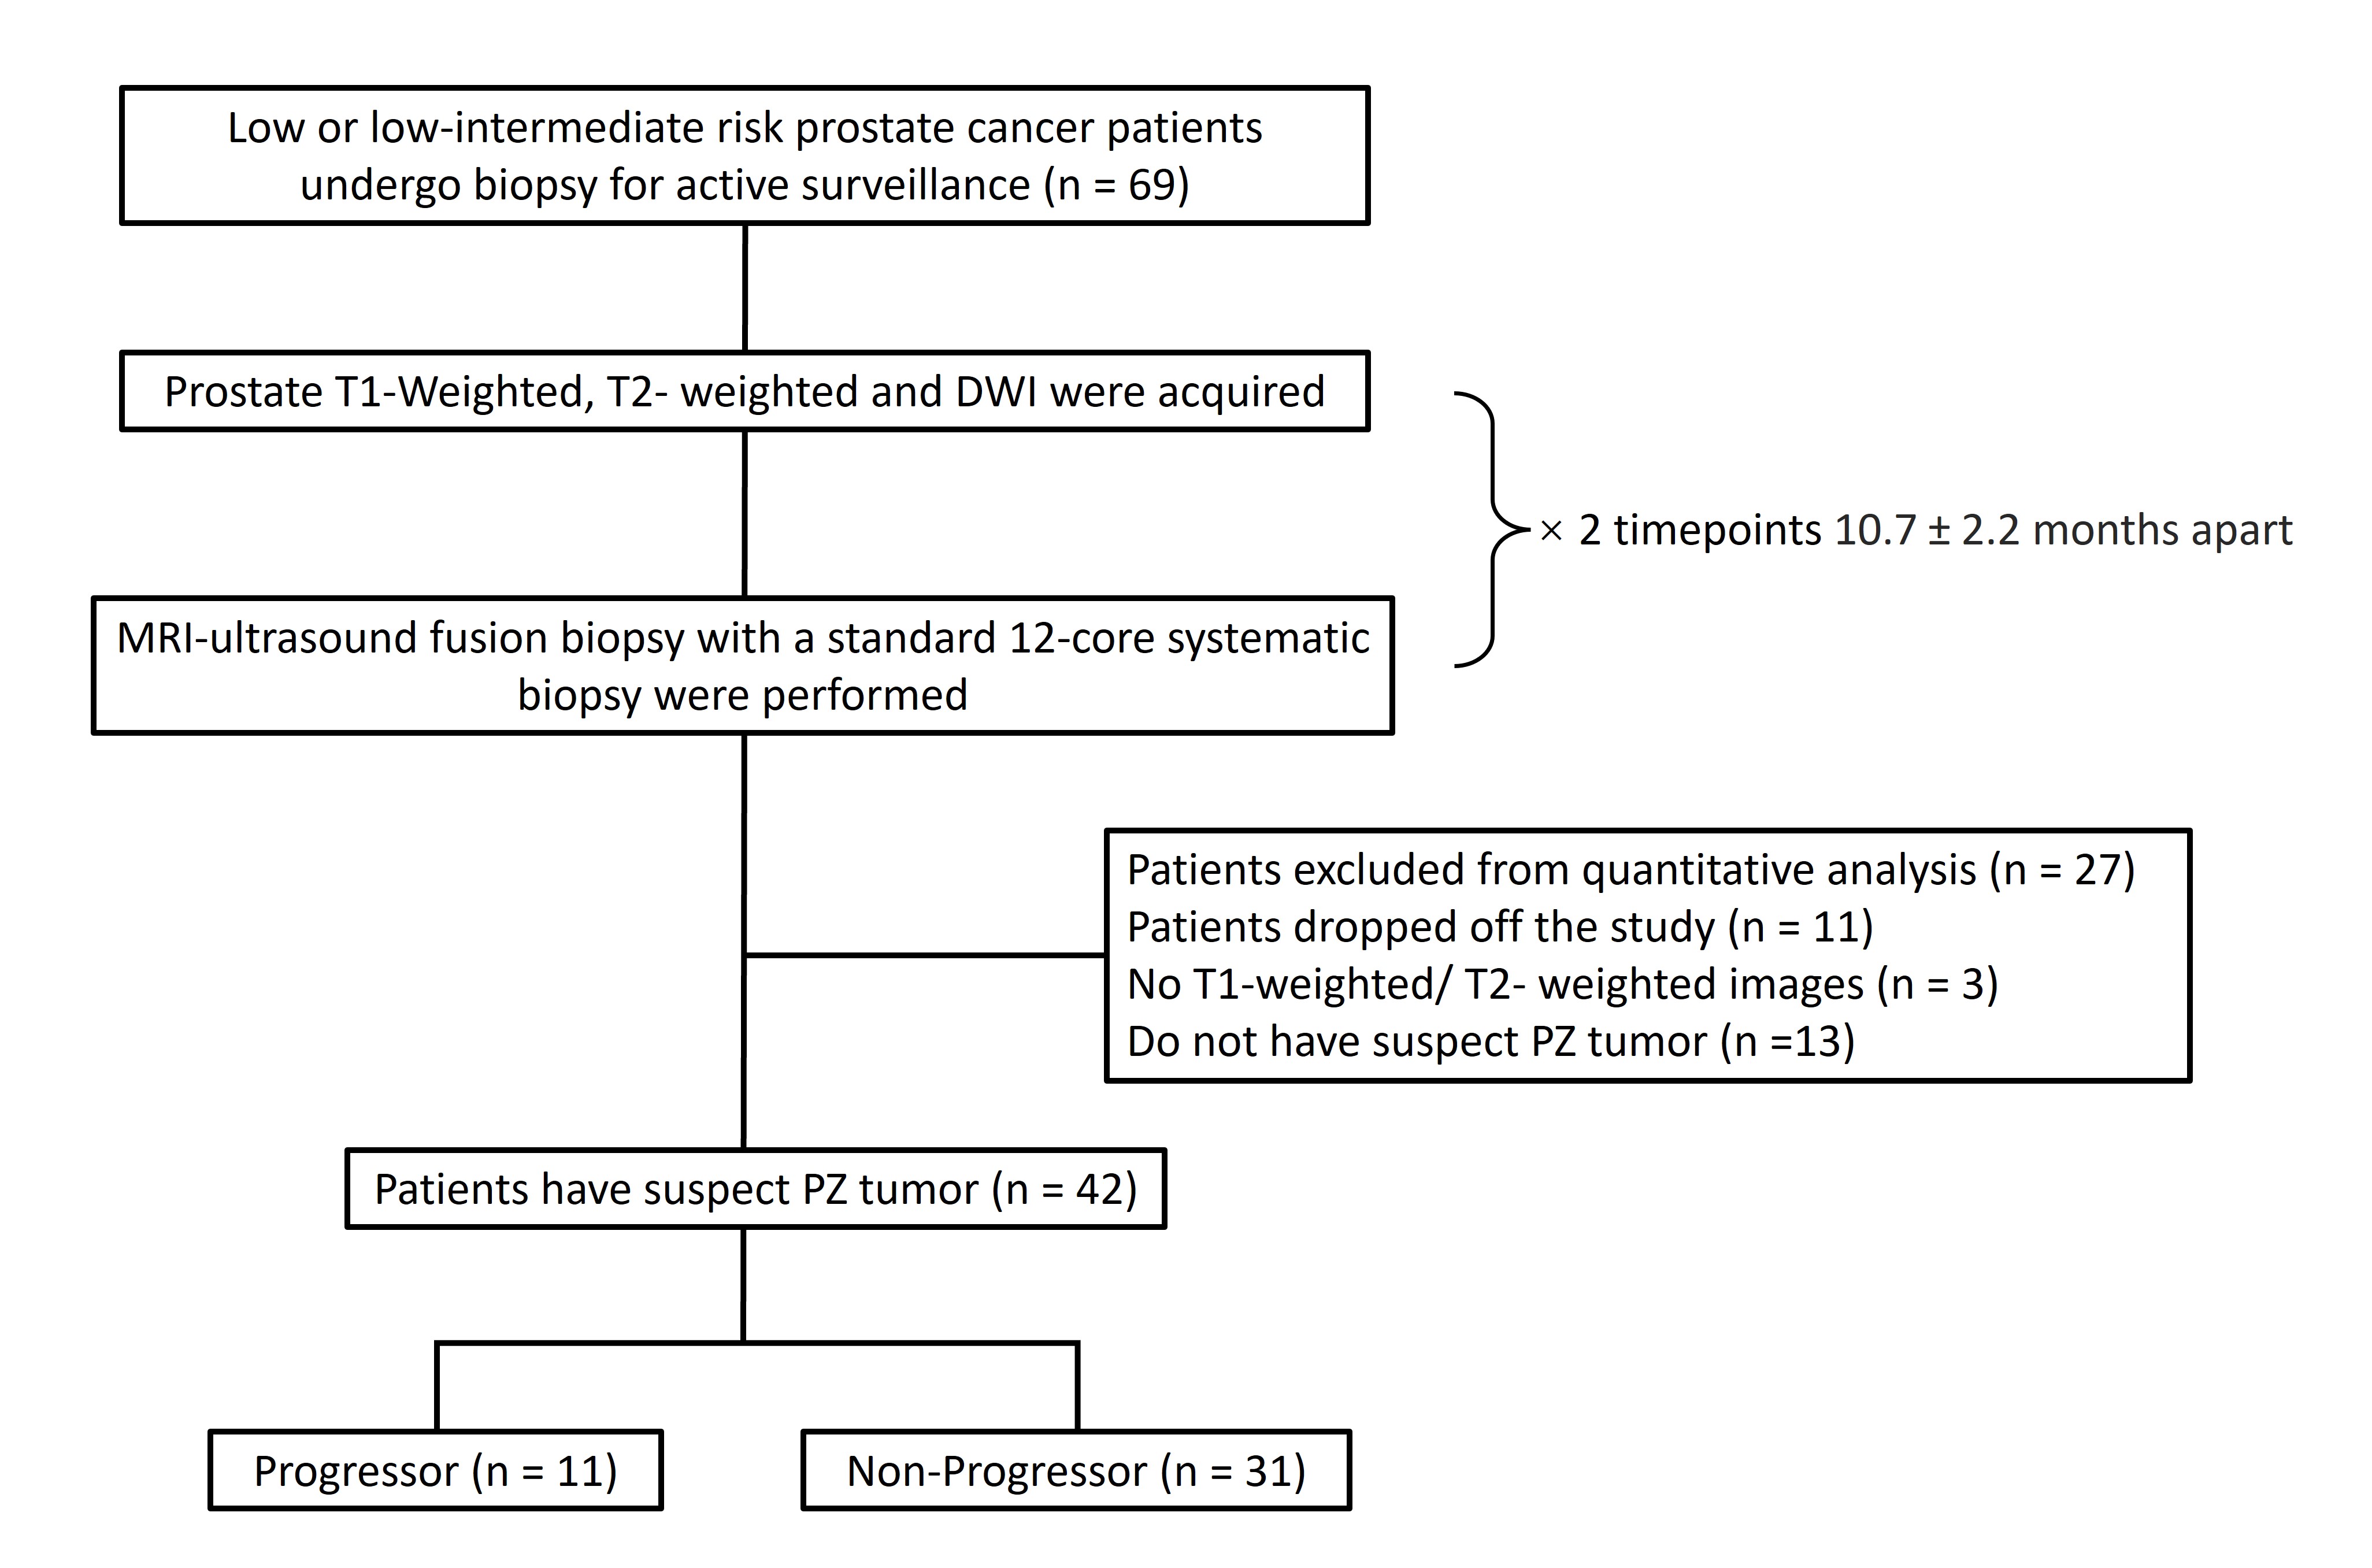
This retrospective study consists of 69 patients undergoing AS who have been diagnosed with low or low-intermediate risk PCa. All patients were scanned on a 3 T clinical scanner (Biograph mMR; Siemens Healthineers, Erlangen, Germany) at two times. Detailed MRI parameters are listed in Figure 1.The patient population was divided into two groups depending on progression status. Biopsies showed adverse histology with Gleason score ≥ 7 or positive cores increases ≥ 3 were defined as progression. Only peripheral zone lesions were included in this study. Detailed workflow is shown in Figure 2.
T1W images were resampled and registered to the same spatial resolution as T2W images. The estimated T2 maps of baseline and follow-up were generated by a trained deep learning network using the conventional acquired T1-weighted and T2-weighted images as inputs. Detailed network structure and performance evaluations can be found in our previous publication 10. An experienced radiologist provided the lesion ROI informed by the standard clinical reading workup based on mpMRI and PSMA-PET (when available).
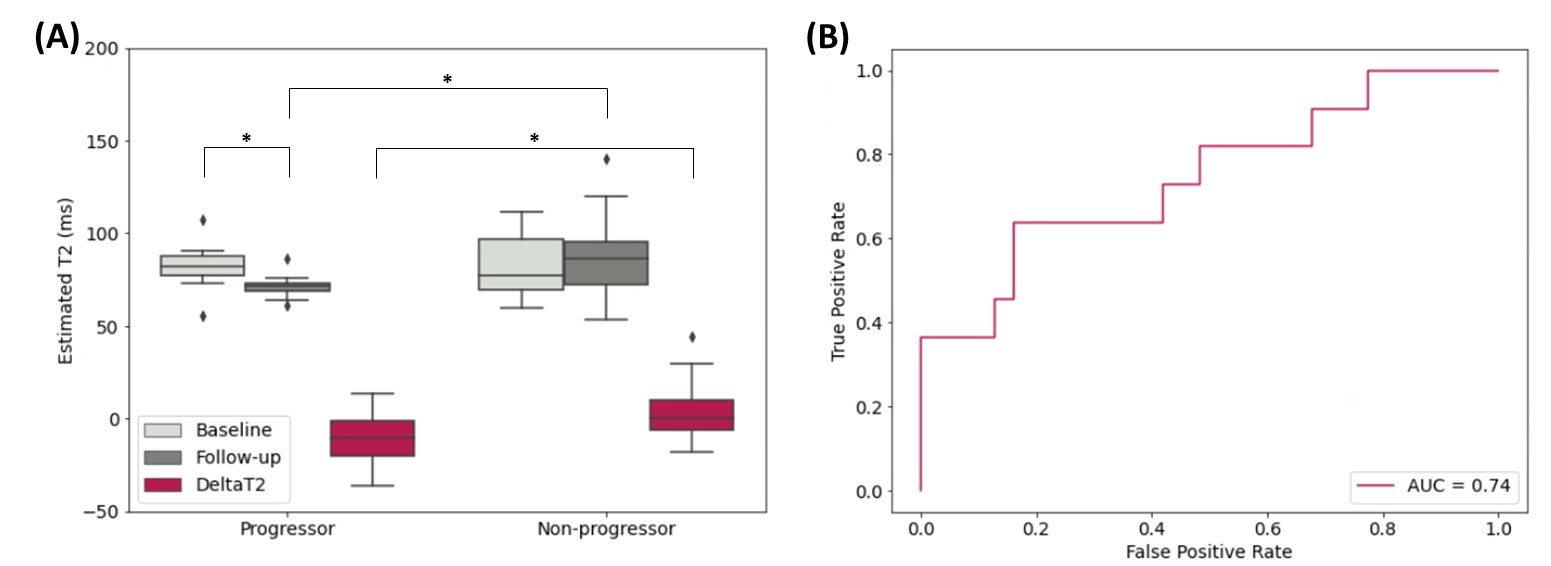
Quantitative analysis was performed on the estimated T2 maps to compare the same lesion ROI between baseline and follow-up. DeltaT2 represents the T2 difference using estimated T2 on follow-up subtracted by its baseline. In addition, t-tests and ROC analysis were included.
3. RESULTS:
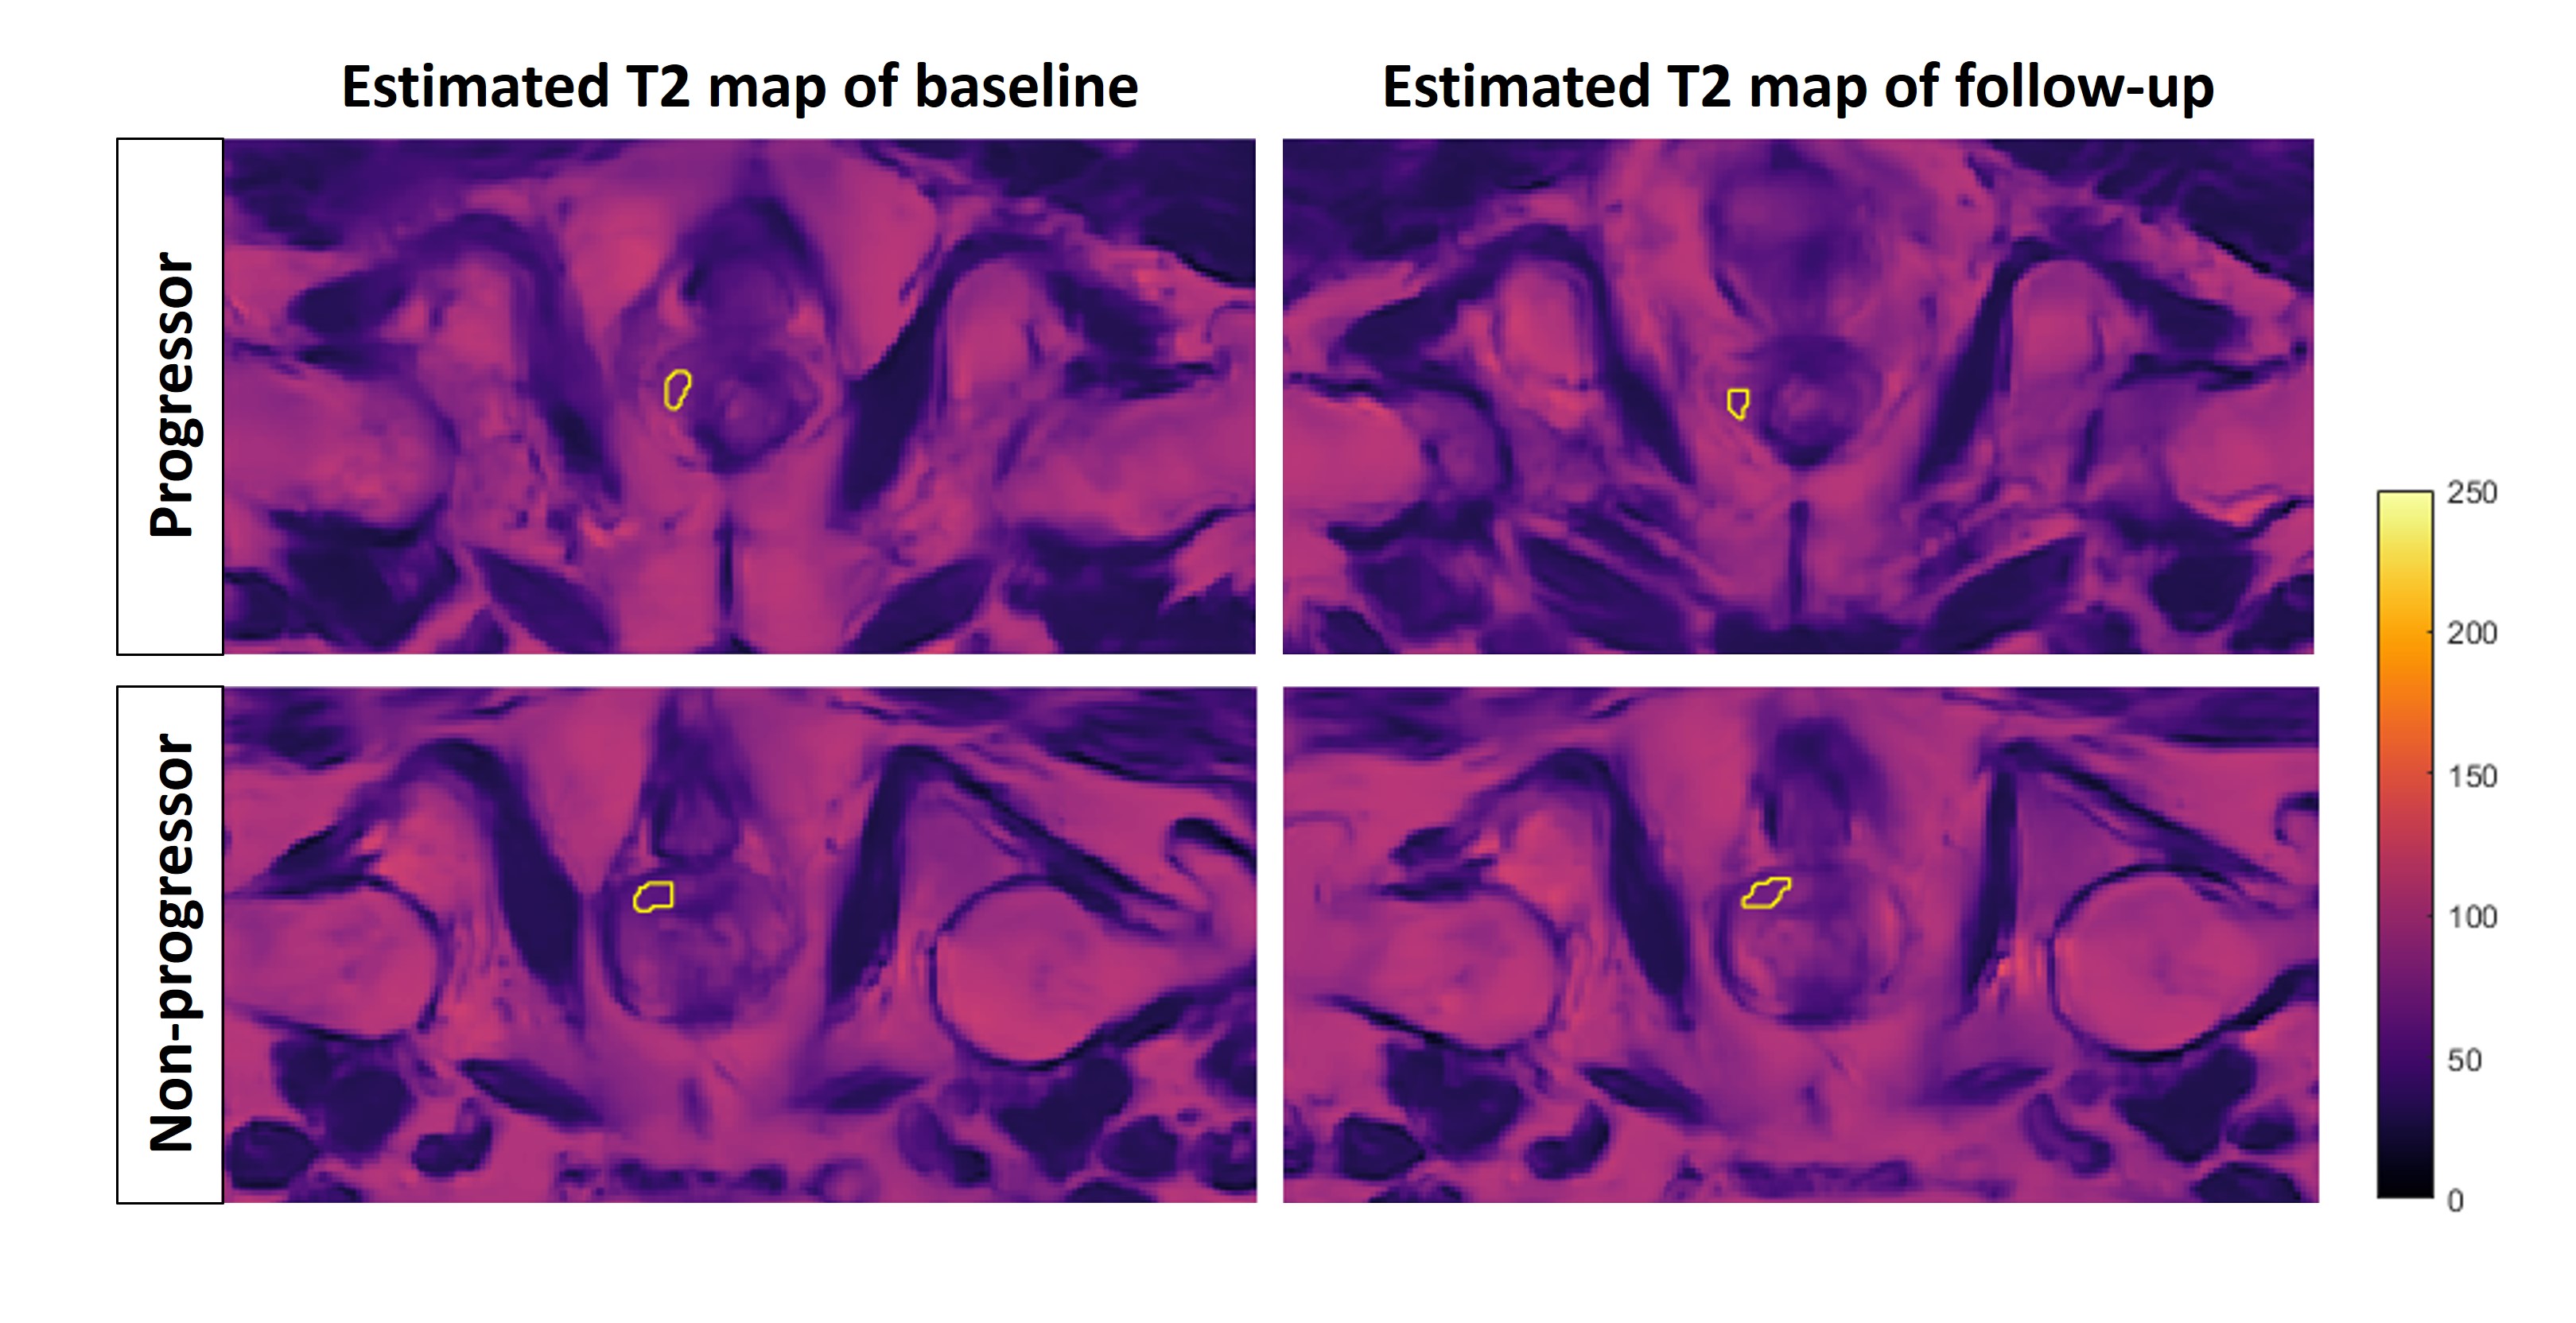
The estimated T2 maps were analyzed for both progressors and non-progressors with tumor ROIs. As shown in Figure 3, the lesions outlined in yellow have lower intensity compared with surrounding normal PZ tissue. Figure 4 and Figure 5 demonstrated the quantitative ROI analysis results. The mean estimated T2 value of ROIs on both baseline and follow-up was reported, as well as their differences, noted as Delta T2. From the t-tests, a significant difference is revealed between the progressors and non-progressors on the follow-up but not on the baseline. Also, there are significant differences in estimated T2 between the two time points of the progressors and the DeltaT2 of the two groups. Moreover, using DeltaT2 values to classify progressors from non-progressors reached an AUC of 0.74.4. DISCUSSION:
Based on the deep learning T2 estimation method developed in our previous work10, this study further explored the potential application of the estimated T2 map on AS. The estimated T2 values of lesion ROIs are consistent with the tumor T2 intensity level reported in literatures7,9. Quantitative results showed the estimated T2 information on baseline and follow-up with its delta can detect the PCa progression on AS.The current T2WI for network training has a lower resolution than the T2 map reference which causes the generated map to have a visible blurriness. Changing to a T2WI with imaging parameters closer to current clinical routine will be implemented to address this limitation.
Future work will focus on adding ADC, DCE also clinical information to the analysis. Meanwhile expanding the dataset to include TZ tumors to refine the potential application for PCa detection.
5. CONCLUSION:
This study demonstrated the diagnostic value of retrospectively estimated T2 maps generated by deep learning for detecting prostate cancer disease progression in patients undergoing active surveillance. Upon further validation, T2 information derived from standard clinical MRI has the potential to improve the diagnostic performance of prostate MRI without incurring additional scan time.Acknowledgements
This study was partially supported by NIH R01CA217098 and NIH R01EB028146.References
1. Sung H, Ferlay J, Siegel RL, et al. Global Cancer Statistics 2020: GLOBOCAN Estimates of Incidence and Mortality Worldwide for 36 Cancers in 185 Countries. CA Cancer J Clin. 2021;71(3):209-249. doi:10.3322/caac.21660
2. Sklinda K, Mruk B, Walecki J. Active Surveillance of Prostate Cancer Using Multiparametric Magnetic Resonance Imaging: A Review of the Current Role and Future Perspectives. Med Sci Monit. 2020;26:e920252-1-e920252-9. doi:10.12659/MSM.920252
3. Dominique G, Brisbane WG, Reiter RE. The utility of prostate MRI within active surveillance: description of the evidence. World J Urol. 2022;40(1):71-77. doi:10.1007/s00345-021-03853-9
4. Stavrinides V, Giganti F, Trock B, et al. Five-year Outcomes of Magnetic Resonance Imaging–based Active Surveillance for Prostate Cancer: A Large Cohort Study. European Urology. 2020;78(3):443-451. doi:10.1016/j.eururo.2020.03.035
5. de Rooij M, Hamoen EHJ, Fütterer JJ, Barentsz JO, Rovers MM. Accuracy of multiparametric MRI for prostate cancer detection: a meta-analysis. AJR Am J Roentgenol. 2014;202(2):343-351. doi:10.2214/AJR.13.11046
6. Fütterer JJ, Briganti A, De Visschere P, et al. Can Clinically Significant Prostate Cancer Be Detected with Multiparametric Magnetic Resonance Imaging? A Systematic Review of the Literature. Eur Urol. 2015;68(6):1045-1053. doi:10.1016/j.eururo.2015.01.013
7. Panda A, OʼConnor G, Lo WC, et al. Targeted Biopsy Validation of Peripheral Zone Prostate Cancer Characterization With Magnetic Resonance Fingerprinting and Diffusion Mapping. Invest Radiol. 2019;54(8):485-493. doi:10.1097/RLI.0000000000000569
8. Panda A, Obmann VC, Lo WC, et al. MR Fingerprinting and ADC Mapping for Characterization of Lesions in the Transition Zone of the Prostate Gland. Radiology. 2019;292(3):685-694. doi:10.1148/radiol.2019181705
9. Chatterjee A, Devaraj A, Mathew M, et al. Performance of T2 Maps in the Detection of Prostate Cancer. Acad Radiol. 2019;26(1):15-21. doi:10.1016/j.acra.2018.04.005
10. Sun H, Wang L, Daskivich T, et al. Retrospective T2 quantification from conventional weighted MRI of the prostate based on deep learning. Front Radiol. 2023;3:1223377. doi:10.3389/fradi.2023.1223377
Figures