3338
Accelerated MR Fingerprinting with 1 mm3 spatial resolution for prostate cancer at 3.0 T1Department of Radiology, University of Michigan, Ann Arbor, MI, United States, 2Department of Electrical Engineering and Computer Science, University of Michigan, Ann Arbor, MI, United States, 3Department of Biomedical Engineering, University of Michigan, Ann Arbor, MI, United States, 4Department of Biomedical Engineering, Univeristy of Michigan, Ann Arbor, MI, United States
Synopsis
Keywords: Prostate, Prostate, prostate cancer, 3D MRF Fingerprinting
Motivation: MRF has shown to have potential to separate cancer from non-cancer in the prostate. Improving resolution and accuracy of tissue property maps while lowering acquisition times could expedite clinical adoption of this technique.
Goal(s): To obtain high-resolution 3D T1 and T2 maps in the prostate in a single rapid scan.
Approach: A highly undersampled isotropic 1 mm3 SoS MRF FISP sequence with B1+ and B0 correction was developed.
Results: We obtained high-resolution 3D T1 and T2 maps of the prostate from a single 6-minute scan and report these values in the normal-appearing prostate from 6 subjects and a PIRADS 5 suspected lesion.
Impact: High-resolution quantitative 3D T1 and T2 maps using a single 6-minute scan may enable this technology to be used for detection and characterization of prostate lesions and encourage clinical adoption.
Introduction
Previous studies have demonstrated the power of MRF-derived T1 and T2 mapping together with diffusion mapping, to quantitatively differentiate cancerous from non-cancerous lesions [1, 2]. These results were acquired using a 2D MRF acquisition at a relatively low spatial resolution (1x1x5 mm3) that cannot be used directly for lesion detection and is difficult to align to high resolution T2w imaging used for lesion detection. The goal of this study is to develop an accelerated 3D MR Fingerprinting (MRF) method with 1 mm3 isotropic spatial resolution to simultaneously obtain T1 and T2 maps that can be reformatted to the coronal, axial and sagittal planes, with a scan time of less than 6 minutes.Methods
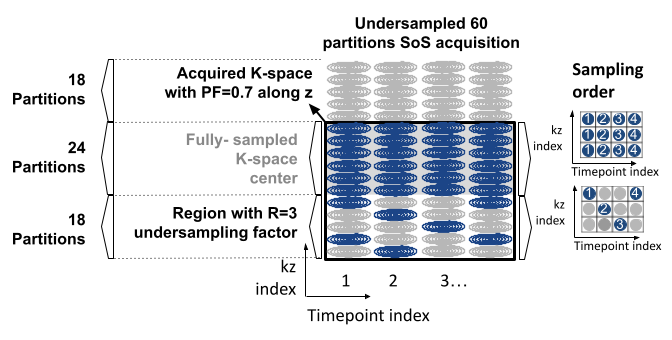
Pulse Sequence parameters and acquisition: An accelerated 3D MRF acquisition was implemented using a FISP sequence and a stack-of-spirals trajectory with 0.7 Partial Fourier Fraction and k-t R=3 undersampling pattern [3] as shown in Fig. 1. 700 time points were acquired using a TR of 8.75 ms, TE of 2.0 ms, and variable flip angles [4]. Each time point was acquired with one spiral arm with a field-of-view of 400 mm2. The acquisition time for 60 partitions was 6 minutes. B0 and B1+ were separately acquired to correct for fields inhomogeneities using a two-echo GRE [5] and a TurboFlash sequence [6], respectively.Reconstruction: MRF time series were SVD-compressed to 6 coefficients along the temporal domain [7]. POCS [8] was applied to retrieve the missing data along the partition direction. B0 correction was performed on the coefficient images using a discretized conjugate phase method with 50 demodulated frequencies [9]. The spiral data were gridded to images using the NUFFT [10]. A dictionary of signal evolutions (541,890 entries) was calculated with ranges of T1 values between 10 and 5000 ms, T2 values between 2 and 800 ms and relative B1+ values between 0.5 and 1.4 using Bloch equations. B1-corrected T1 and T2 maps were generated by taking the maximum cross-correlation between the reconstructed images and the dictionary corresponding to the relative B1+ value.
Phantom and In Vivo Experiments: All experiments were performed on a 3T scanner (Magnetom Vida, Siemens Healthineers, Erlangen, Germany) with an 18-channel body array and spine array with 32 channels. The NIST phantom [11] was scanned to assess the proposed method. Six subjects were scanned. T2-weighted images were acquired as reference.
Results
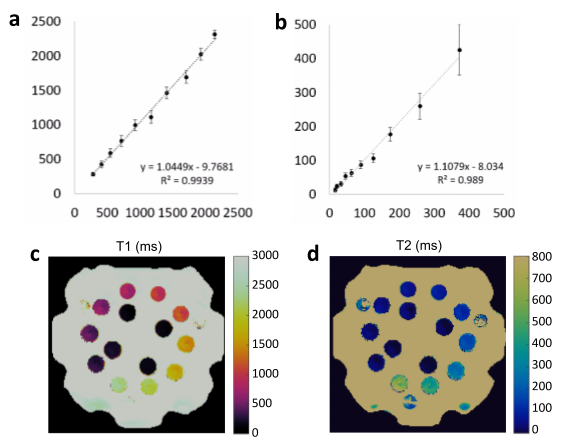
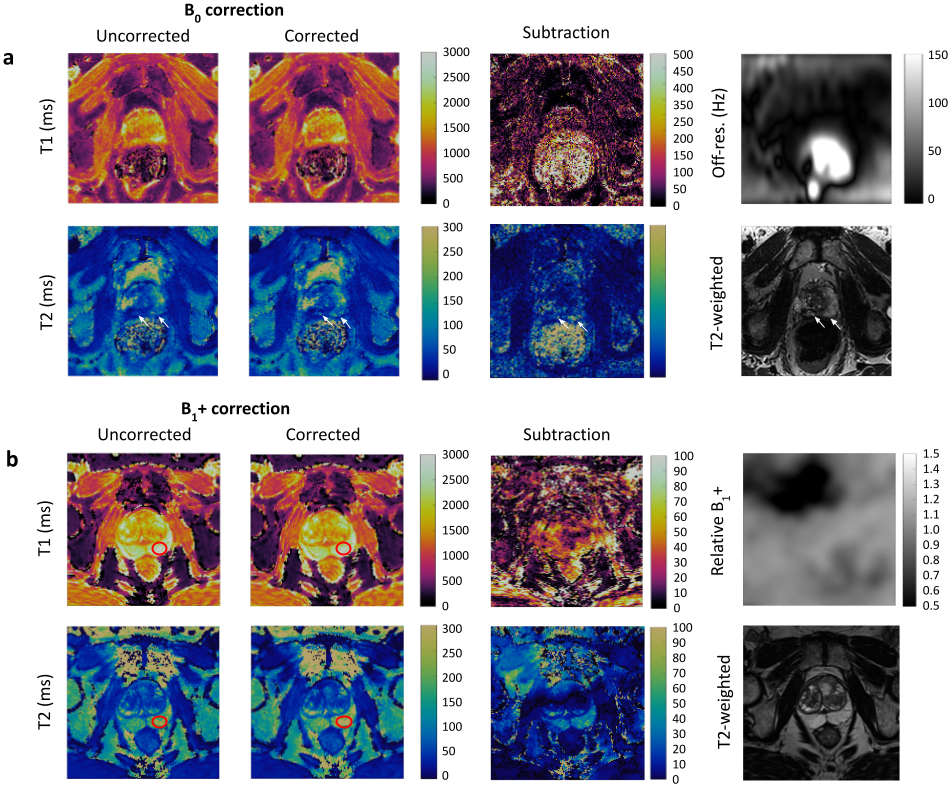
Fig. 2 shows correlation plots comparing T1 and T2 values estimated using the proposed MRF method to reference values estimated using gold standard spin echo methods. T1 and T2 values are in good agreement with the references.Fig. 3a shows T1 and T2 maps with and without B0 correction, the off-resonance map and T2-weighted image. Structures, pointed by white arrows, are visually close to those observed in the T2-weighted images. Fig. 3b shows T1 and T2 maps with and without B1+ correction, and relative B1+ map and T2-weighted image. T1 and T2 values of an ROI drawn over the NPZ (red ovals) correspond to 2686±513 ms and 214±52 ms, respectively before B1+ correction and 2631±466 ms and 256±61 ms after applying B1+ correction, indicating the importance of B1+ in getting accurate T1 and T2 values in prostate.
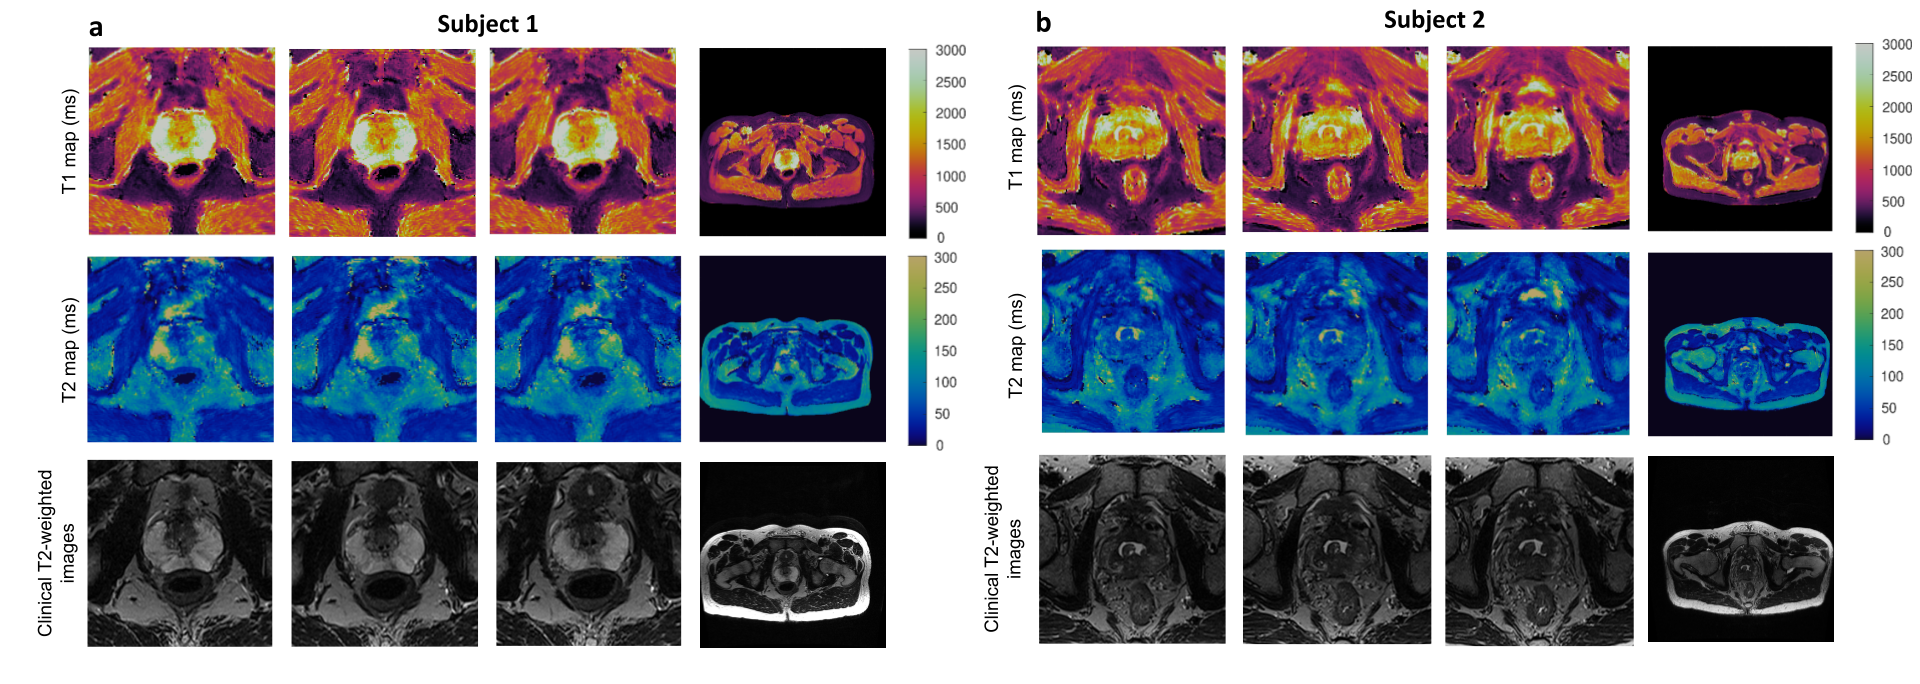
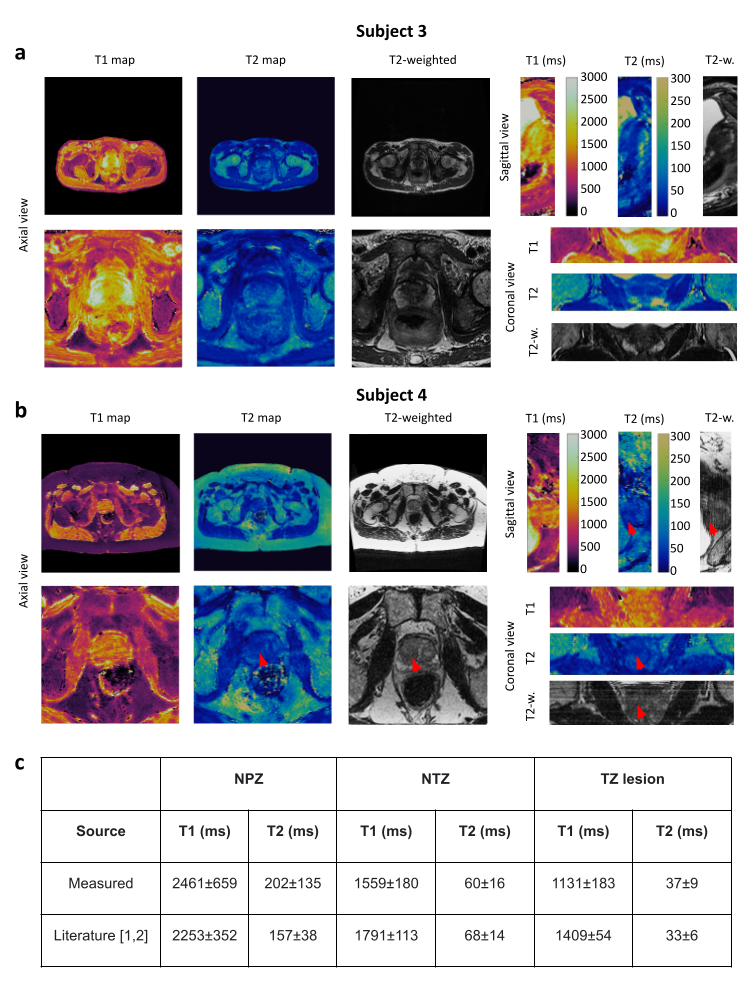
Fig. 4 shows T1 and T2 maps and T2-weighted images in axial plane from two subjects.
In Fig. 5a, T1 and T2 maps acquired from a healthy subject in all planes are shown. In Fig. 5b, a case of a suspected PIRADS 5 lesion (diagnosed by a physician using T2-weighted images alongside with ADC) highlighted with arrows. In Fig. 5b, the data obtained from ROIs drawn over the NPZ and normal-appearing transition zone (NTZ) in six subjects and a patient with a PIRADS 5 suspected TZ lesion is shown and compared to values previously reported in literature [1,2]. T1 and T2 values of the NPZ, NTZ and the lesion are within previously reported distributions [1,2].
Conclusion and Discussion
We demonstrated the ability of a 3D MRF sequence to generate high-resolution 1 mm3 isotropic resolution T1 and T2 maps of the whole prostate gland in 6-minute by applying an undersampling strategy involving Partial Fourier and k-t sampling. Correction methods were applied to account for B0 and B1+ inhomogeneities. We observed that off-resonance correction has the potential to correct geometrical distortion caused by the rectal gas and B1+ correction is needed for estimating accurate T1 and T2 of the prostate. We reported T1 and T2 values in the NPZ and NTZ from six subjects and a PIRADS 5 suspected lesion in the TZ. Additional experiments in patients are underway to validate these measurements.Acknowledgements
Support for this study was provided by NIH grants R37CA263583 and R01CA208236, and Siemens Healthcare.References
1. Panda, A., Obmann, V. C., Lo, W. C., Margevicius, S., Jiang, Y., Schluchter, M., ... & Gulani, V. MR fingerprinting and ADC mapping for characterization of lesions in the transition zone of the prostate gland. Radiology. 2019; 292(3), 685.
2. Panda, A., O’Connor, G., Lo, W. C., Jiang, Y., Margevicius, S., Schluchter, M., ... & Gulani, V. Targeted biopsy validation of peripheral zone prostate cancer characterization with MR fingerprinting and diffusion mapping. Investigative radiology. 2019; 54(8), 485.
3. Anderson, C. E., Wang, C. Y., Gu, Y., Darrah, R., Griswold, M. A., Yu, X., & Flask, C. A. Regularly incremented phase encoding–MR fingerprinting (RIPE‐MRF) for enhanced motion artifact suppression in preclinical cartesian MR fingerprinting. Magnetic resonance in medicine. 2018; 79(4), 2176-2182.
4. Fajardo, JE., Lavrova, A., Gulani, V. and Jiang, Y. 3D High Resolution MR Fingerprinting for prostate cancer, Proceedings of the International Society of Magnetic Resonance in Medicine, Toronto. 2023.
5. Schneider, E., & Glover, G. Rapid in vivo proton shimming. Magnetic Resonance in Medicine. 1991; 18(2), 335-347.
6. Chung, S., Kim, D., Breton, E., & Axel, L. Rapid B1+ mapping using a preconditioning RF pulse with TurboFLASH readout. Magnetic resonance in medicine. 2010; 64(2), 439-446.
7. McGivney, D. F., Pierre, E., Ma, D., Jiang, Y., Saybasili, H., Gulani, V., & Griswold, M. A. SVD compression for magnetic resonance fingerprinting in the time domain. IEEE transactions on medical imaging. 2014; 33(12), 2311-2322.
8. Gubin, L. G., Polyak, B. T., & Raik, E. V. The method of projections for finding the common point of convex sets. USSR Computational Mathematics and Mathematical Physics. 1967; 7(6), 1-24.
9. Noll, D. C. Reconstruction techniques for magnetic resonance imaging. Stanford University. 1991; pp 108-114.
10. Fessler, J. A., & Sutton, B. P. Nonuniform fast Fourier transforms using min-max interpolation. IEEE transactions on signal processing. 2003; 51(2), 560-574.
11. Keenan, K. , Stupic, K. , Boss, M. , Russek, S. , Chenevert, T. , Prasad, P. , Reddick, W., Zheng, J. , Hu, P. and Jackson. Comparison of T1 measurement using ISMRM/NIST system phantom, Proceedings of the International Society of Magnetic Resonance in Medicine, Singapore. 2016; https://tsapps.nist.gov/publication/get_pdf.cfm?pub_id=919826 (Accessed November 3, 2022).
Figures