3335
Improved diagnostic value for prostate cancer with bpMRI PI-RADS v2.1 integrating quantitative synthetic magnetic resonance imaging1The Affiliated Cancer Hospital of Zhengzhou University & Henan Cancer Hospital, Zhengzhou, China, 2GE Healthcare MR Research,Beijing,China, Beijing, China
Synopsis
Keywords: Prostate, Prostate, Prostate Imaging Reporting and Data System, Relaxation time quantitative technique, Synthetic magnetic resonance imaging
Motivation: It’s essential to explore new imaging methods to improve the diagnostic performance of bp-MRI (T2W+DWI) PI-RADS v2.1 in the absence of DCE.
Goal(s): To evaluate the potential of quantitative relaxometry from synthetic MRI in combination with bp-MRI PI-RADS v2.1 score for differentiating clinically significant prostate cancer.
Approach: T2WI, T2WI fs, DWI and synthetic MRI with magnetic resonance image compilation (MAGiC) imaging in 3T MR
Results: Integrating T1, T2, PD and ADC with PI-RADS score improves the diagnostic performance for lesions in peripheral zone significantly with increased both sensitivity and specificity, but not significantly for the lesions in transitional zone.
Impact: The introduction of relaxometry from synthetic MRI can help improve the diagnostic efficiency in the peripheral zone when integrated with PI-RADS in the absence of DCE, which avoid the increase of peripheral zone lesions with PI-RADS score of 3.
Introduction
Prostate cancer is one of the most common malignancy in men [1]. Multi-parameter MRI was considered valuable in the diagnosis and staging of clinically significant prostate cancer(csPCa). The latest PI-RADS 2.1 makes multi-parameter MRI diagnosis of the prostate lesions more standardized. However, DCE MRI was not always done because of the necessary for saving time or avoiding adverse reactions of contrast agents. Then only T2WI and DWI without DCE (dual-parameter MRI) were available for prostate lesion differentiation, leading to an increase in the proportion of patients with PI-RADS 3 points and a decrease in the detection rate of lesions [2]. Quantitative synthetic MRI (syMRI) is a multi-dynamic multi-echo sequence which can simultaneously generate the T1/T2 relaxometry and PD quantification maps in clinical acceptable time[3]. This study attempted to investigate the potential of syMRI for distinguishing the malignant and benign lesions and explore if they will help when combined with ADC and PI-RADS v2.1 score in the absence of DCE.Method
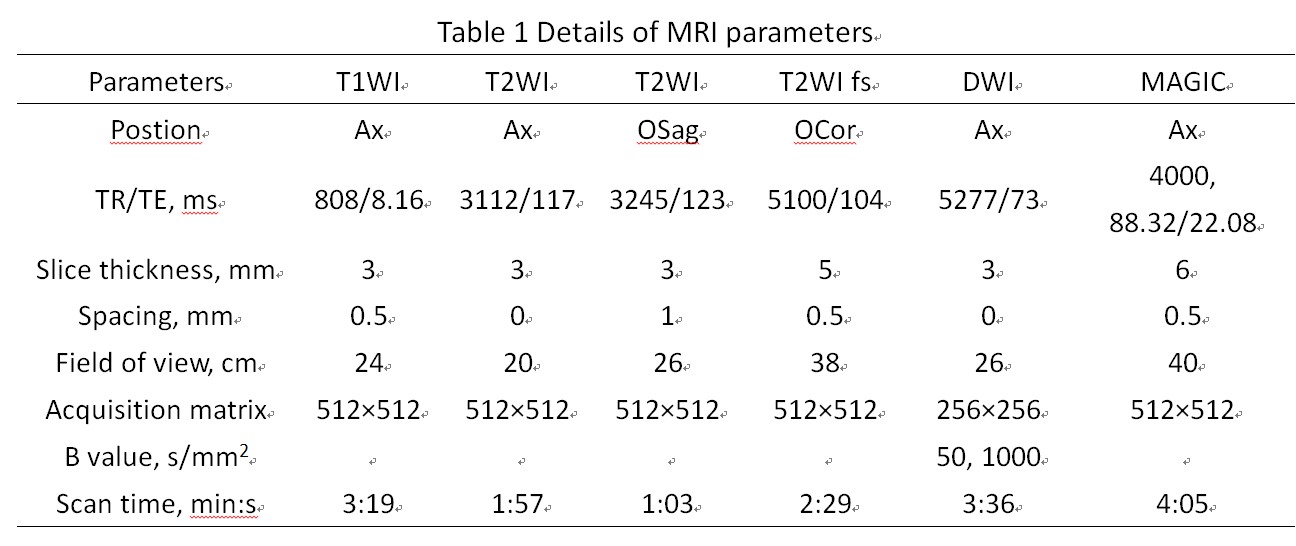
99 patients with prostate lesions, including 39 in peripheral zone (21 cancer, 18 non-cancer) and 60 in transitional zone (10 cancer, 50 non-cancer), were collected. All the lesions were pathologically confirmed without prior treatment and the sizes were larger than 5mm in diameter. MRI including T2WI, DWI and synthetic imaging (magnetic resonance image compilation, MAGiC) in a 3T scanner (SIGNA Architect, GE Healthcare) were performed 4 weeks before puncture (Table 1). The lesion scores were evaluated by an experienced radiologist (> 5 years) according to the PI-RADS v2.1 and the final scores were determined by the lesions with the largest diameter. The MAGiC data was processed to generate the T1, T2 and PD maps in SyMRI (SyntheticMR, Linköping, Sweden, ver. 8.0). Regions of interest (ROIs) were delineated in the slice with maximum lesion diameter and its adjacent upper and lower slice on T2WI with carefully avoiding the tumor bleeding, obvious necrosis, calcification, and cystic change. Then the ROIs were projected to T1, T2, PD and ADC maps and the averages in three slices for each index were used as the final measurement. The data in cancer and non-cancer group were compared with t-test or Mann-Whitey U test according to the data normality. Logistic regressions were done to explore the model for diagnosis and the receiver operator curves (ROC) were applied to evaluate the performance. The AUCs were compared with DeLong test. p < 0.05 was considered statistically significant. All analysis was conducted in MedCalc15.2.2 (MedCalc) and SPSS 22(IBM)Results
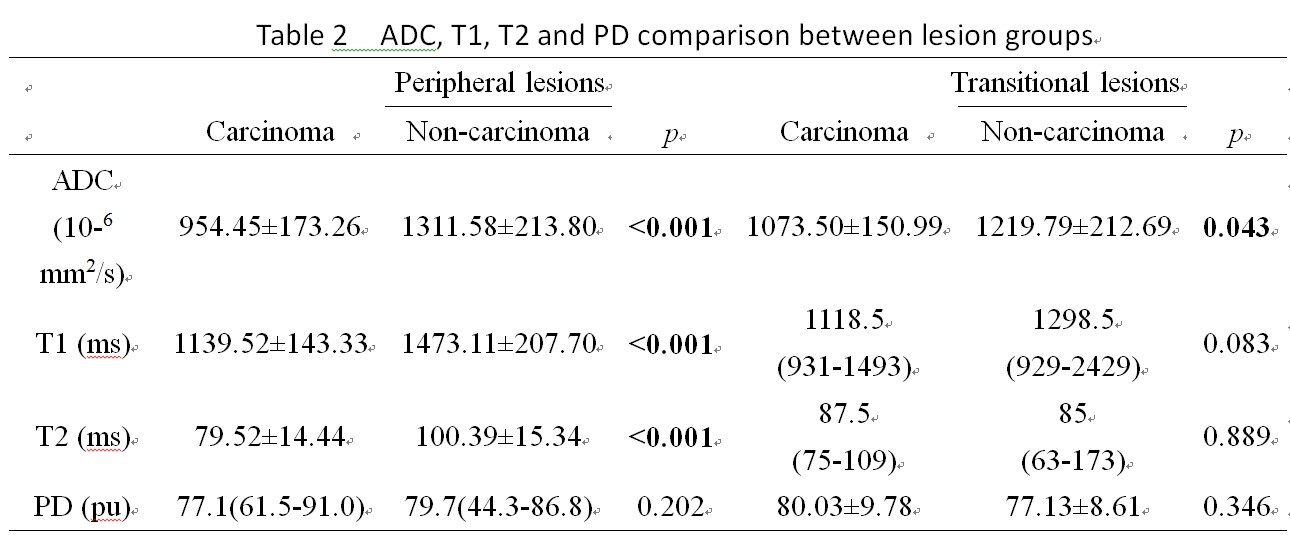
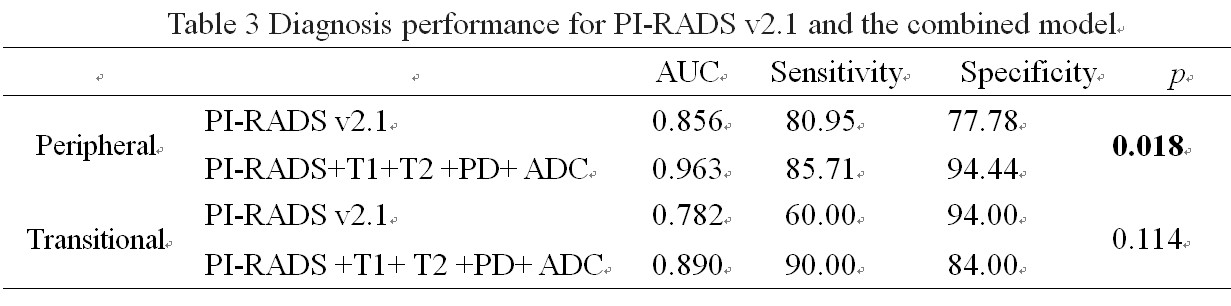
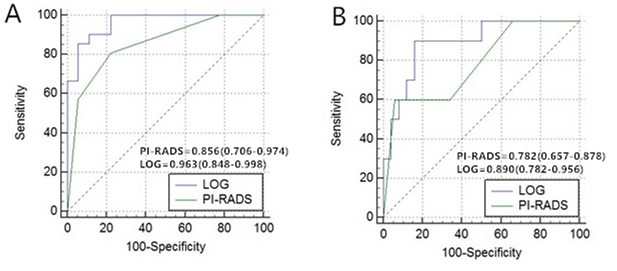
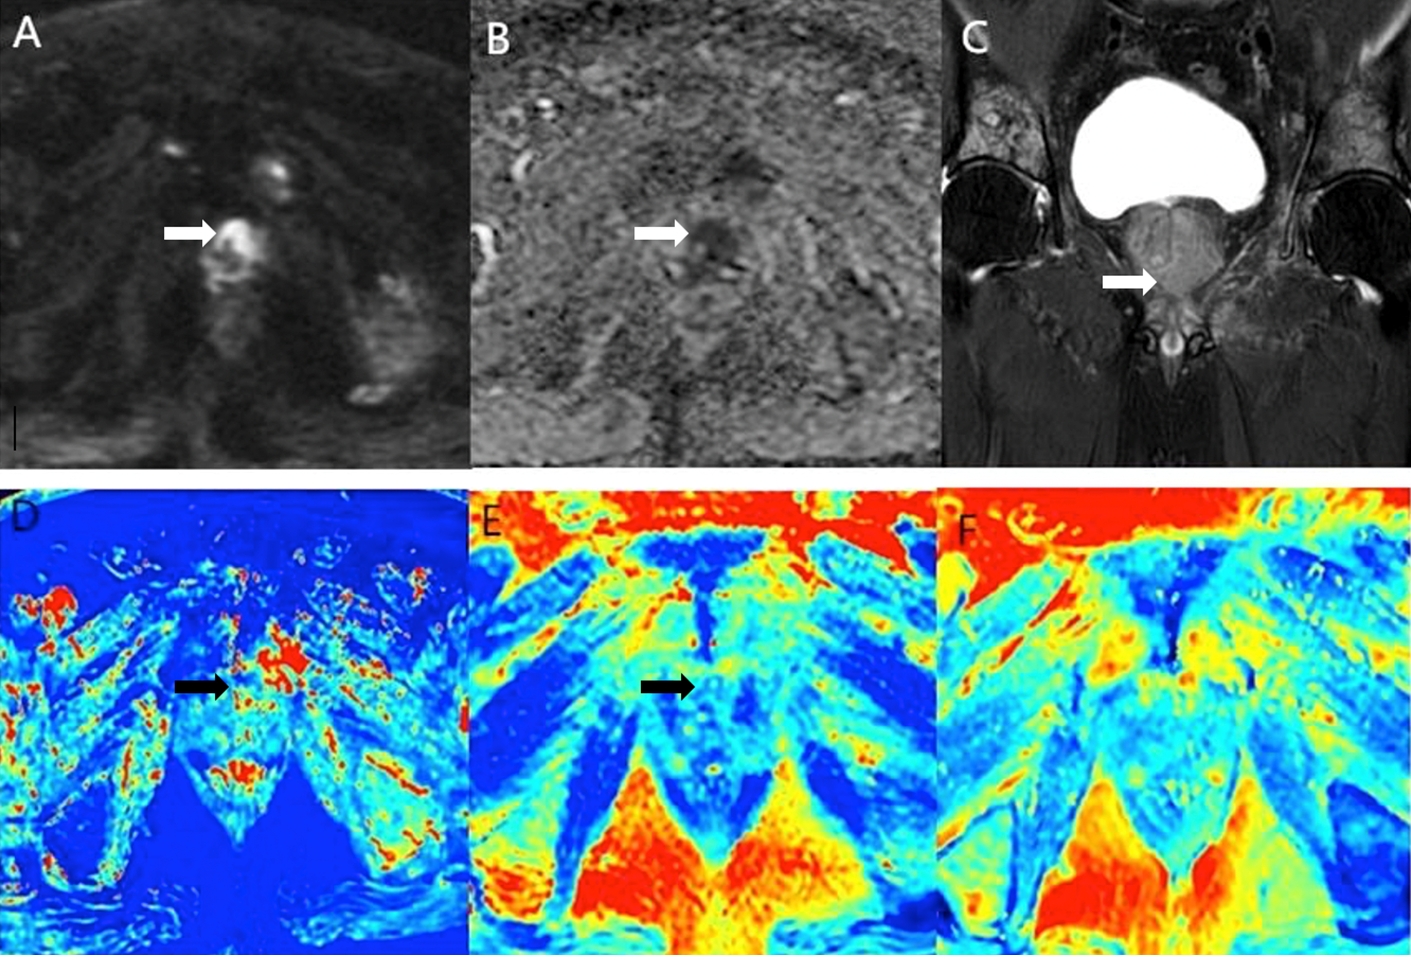
In table 2, T1, T2 and ADC in the peripheral carcinoma group were significantly lower than those in non-peripheral carcinoma group, while there was no significant difference for PD between two groups. ADC in the transitional carcinoma group were lower than those in the non-cancer group (p < 0.043). No significant difference was found in in T1, T2 and PD values between the two groups.The AUC in table 3 for lesion diagnosis in peripheral zone with PI-RADS V2.1 score was 0.856 and increased to 0.963 when integrating the PI-RADS V2.1 score, T1/T2 /PD and ADC in the model (p = 0.0179). There was no significant difference for AUCs in transition zone between the model with PI-RADS v2.1 score (0.782) and the one including T1/T2/PD and ADC (0.890) (p=0.114).
Discussion
In this study, we identified that T1 and T2 relaxometry can help distinguish the lesions of peripheral zone. In the transitional zone, only T1 showed the potential to distinguish disease. The combined model integrating bp MRI PI-RADS score, T1/T2/PD and ADC showed higher diagnostic efficiency in the peripheral zone, but only showed an increasing trend in the transitional zone which is similar to previous research. The relatively loose acinar structure in the peripheral prostate zone was replaced by tightly arranged tumor cells, and the content of mucin and fluid decreased, resulting in lower T1 and T2 values in the peripheral zone prostate cancer than in the non-cancerous zone[5].The transitional zone of prostate is an area where benign prostatic hyperplasia(BPH) nodules are prone to occur. Because of different glandular, stromal, and fibromuscular components, the signals of BPH nodules differ greatly. However, nodules with stromal hyperplasia are similar to those of prostate central gland carcinoma on T2[6], which may be the reason why the relaxometry did not help distinguish transitional zone lesions.Acknowledgements
No acknowledgement found.References
[1] Siegel RL, Miller KD, Wagle NS, Jemal A. Cancer statistics, 2023. CA Cancer J Clin. 2023 Jan;73(1):17-48. doi: 10.3322/caac.21763. PMID: 36633525.
[2] Rosenkrantz AB, Babb JS, Taneja SS, Ream JM. Proposed Adjustments to PI-RADS Version 2 Decision Rules: Impact on Prostate Cancer Detection. Radiology. 2017 Apr;283(1):119-129. doi: 10.1148/radiol.2016161124. Epub 2016 Oct 26. PMID: 27783538.
[3] Hagiwara A, Warntjes M, Hori M, Andica C, Nakazawa M, Kumamaru KK, Abe O, Aoki S. SyMRI of the Brain: Rapid Quantification of Relaxation Rates and Proton Density, With Synthetic MRI, Automatic Brain Segmentation, and Myelin Measurement. Invest Radiol. 2017 Oct;52(10):647-657. doi: 10.1097/RLI.0000000000000365. PMID: 28257339; PMCID: PMC5596834.
[4] Shiradkar R, Panda A, Leo P, Janowczyk A, Farre X, Janaki N, Li L, Pahwa S, Mahran A, Buzzy C, Fu P, Elliott R, MacLennan G, Ponsky L, Gulani V, Madabhushi A. T1 and T2 MR fingerprinting measurements of prostate cancer and prostatitis correlate with deep learning-derived estimates of epithelium, lumen, and stromal composition on corresponding whole mount histopathology. Eur Radiol. 2021 Mar;31(3):1336-1346. doi: 10.1007/s00330-020-07214-9. Epub 2020 Sep 2. Erratum in: Eur Radiol. 2020 Sep 18;: PMID: 32876839; PMCID: PMC7882016
[5] Yu AC, Badve C, Ponsky LE, Pahwa S, Dastmalchian S, Rogers M, Jiang Y, Margevicius S, Schluchter M, Tabayoyong W, Abouassaly R, McGivney D, Griswold MA, Gulani V. Development of a Combined MR Fingerprinting and Diffusion Examination for Prostate Cancer. Radiology. 2017 Jun;283(3):729-738. doi: 10.1148/radiol.2017161599. Epub 2017 Feb 10. PMID: 28187264; PMCID: PMC5452885
[6] van Houdt PJ, Agarwal HK, van Buuren LD, Heijmink SWTPJ, Haack S, van der Poel HG, Ghobadi G, Pos FJ, Peeters JM, Choyke PL, van der Heide UA. Performance of a fast and high-resolution multi-echo spin-echo sequence for prostate T2 mapping across multiple systems. Magn Reson Med. 2018 Mar;79(3):1586-1594. doi: 10.1002/mrm.26816. Epub 2017 Jul 3. PMID: 28671331; PMCID: PMC5752635.
Figures