3327
Zero-echo time MB-SWIFT MRI responses to visual stimuli in a mouse model of demyelination and remyelination1A.I. Virtanen Institute for Molecular Sciences, University of Eastern Finland, Kuopio, Finland, 2Roche Pharma Research and Early Development, Neuroscience and Rare Diseases, Roche Innovation Center, Basel, Switzerland
Synopsis
Keywords: Task/Intervention Based fMRI, fMRI (task based), Zero echo time, demyelination, remyelination
Motivation: The changes in responses to sensory stimuli during demyelination and remyelination could help quantify neuro-functional deficits in neurodegenerative disorders.
Goal(s): The goal of this study was to explore the capability of fMRI to detect changes in the functional response during both demyelination and remyelination.
Approach: A genetic mouse model of widespread demyelination and remyelination was imaged with MB-SWIFT fMRI during visual stimulation.
Results: We observed alterations in activation maps and fMRI responses to visual stimuli during demyelination. The function was restored during the remyelination phase.
Impact: We show that zero echo time MB-SWIFT fMRI protocol with visual stimulation can detect myelination-associated differences in neuro-functional responses in mice and thus lends itself as a potential translational biomarker for disease and treatment monitoring in drug development.
Introduction
Functional magnetic resonance imaging is a non-invasive tool for exploring the changes in brain function in neurodegenerative diseases. However, the effects of demyelination and remyelination on functional responses to stimuli remain underexplored. Here we utilize a genetic mouse model of demyelination (MyRF-iCKO), which is induced by tamoxifen. The process of demyelination peaks around 10 weeks post-induction and is clearly separated from the subsequent gradual but incomplete myelin repair1. We used this model to explore the changes in responses to sensory stimuli in the different myelination stages. Since the standard EPI fMRI is sensitive to susceptibility-induced image distortions, which hinder mouse whole-brain imaging at high fields, we utilized a zero-echo-time Multi-Band SWeep Imaging with Fourier Transformation (MB-SWIFT) sequence. We have previously demonstrated the insensitivity of MB-SWIFT to the susceptibility-induced artifacts in rats, while the method still produces similar fMRI results to those obtained with EPI sequences2,3.Methods
35 MyRF-iCKO mice were implanted with head posts designed to fit to an in-house built MRI holder. A group of 19 mice (10 females and 9 males) received 5 daily i.p. injections of tamoxifen, and 16 mice (8 females and 8 males) were injected with corn oil. The animals were imaged at baseline and at 7- and 19-week post-injections. Functional imaging was performed under ketamine-xylazine (ketamine 100mg/kg, xylazine 10mg/kg, i.p.) anesthesia in a 9.4T magnet (Agilent DirectDrive) with a zero-echo time MB-SWIFT sequence: a repetition time of 0.82ms, acquisition time per volume 1.7s, flip angle 3°, transmission bandwidth of 125kHz, a matrix size of 64×64×64, field of view 24×24×24mm. During a 12-minute scan, 10 stimuli of flashing blue LED light at a frequency of 5Hz were delivered in a 15s-on-45s-off block design. To explore fMRI responses, regions of interest (ROIs) were drawn on the reference brain in the main parts of the visual pathway: superior colliculi (SC), dorsal lateral geniculate nuclei (dLGN), and visual cortex (VC). For the area under the curve (AUC) calculations, the mean signal from the ROIs was highpass-filtered (0.001Hz) and the median value from the 10 stimuli for each subject was used for statistical analysis.Results
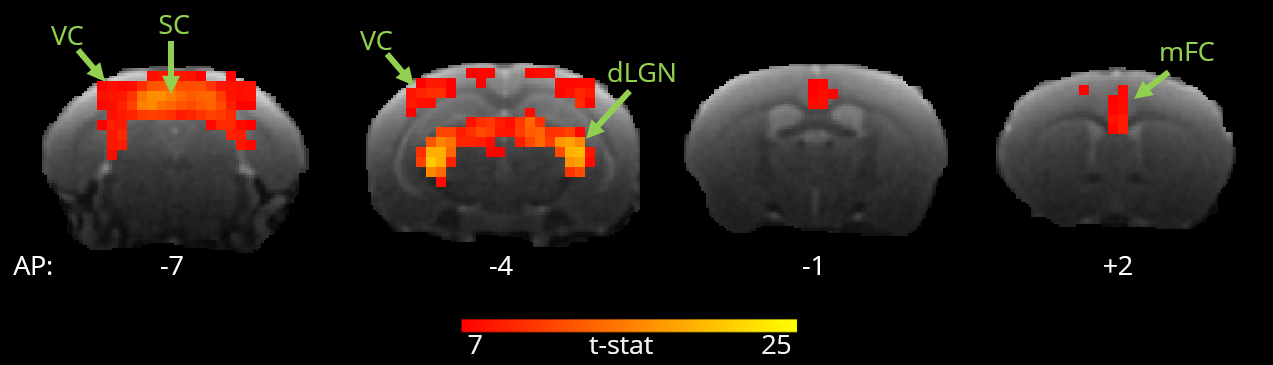
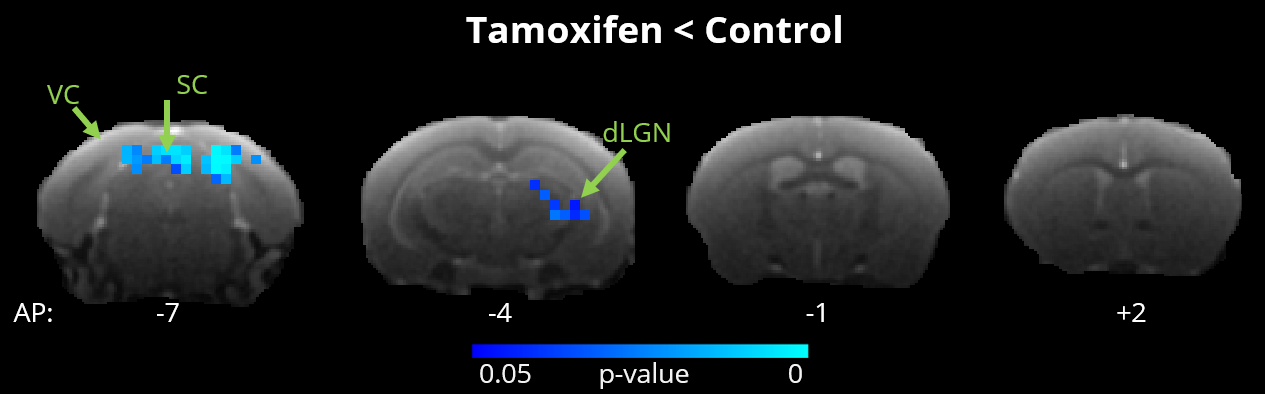
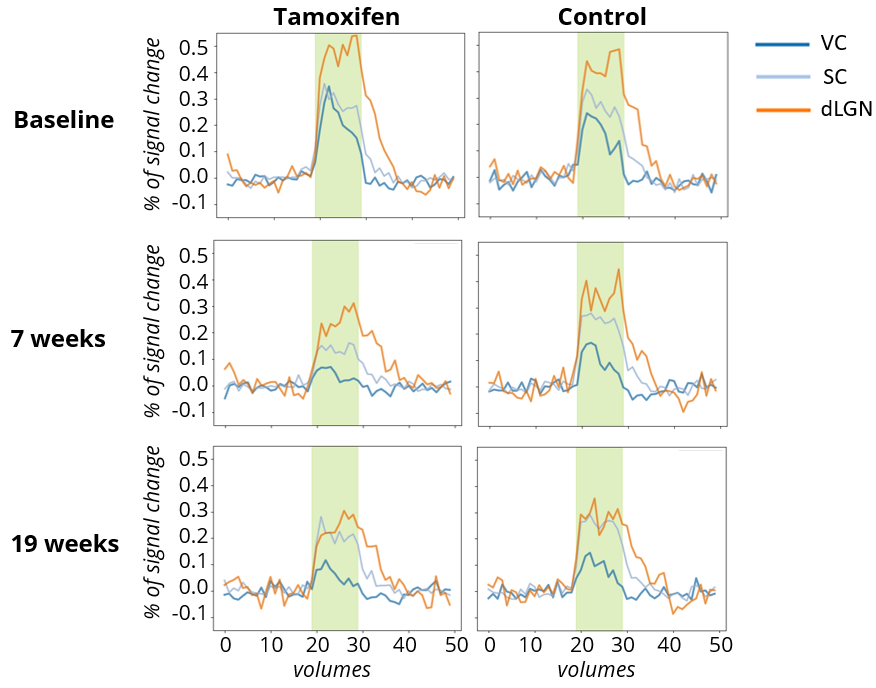
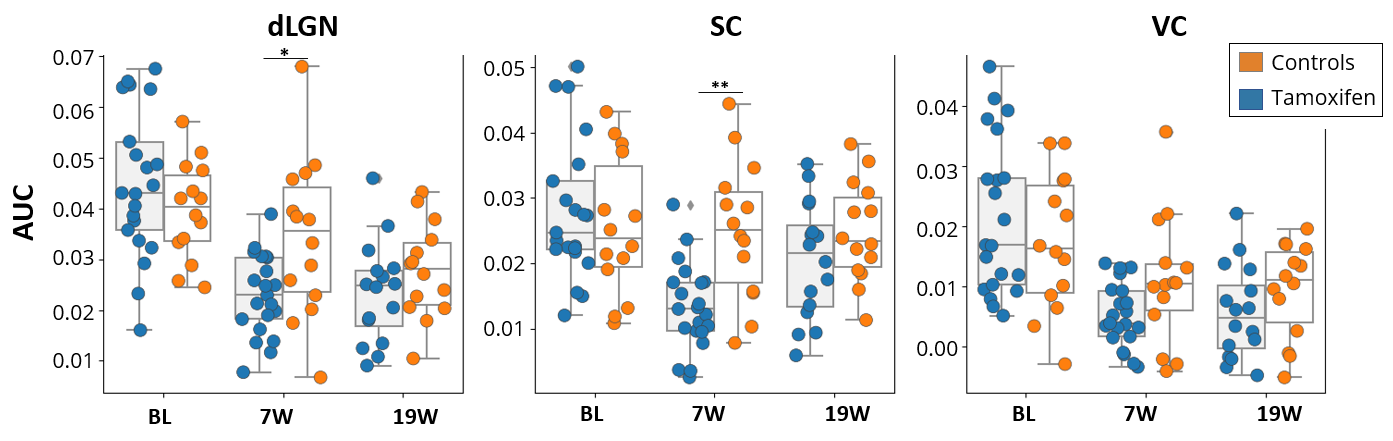
The group activation maps from all (n=35) animals from the baseline measurements are shown in Figure 1. The strongest responses were in the superior colliculi (SC) and dorsal lateral geniculate nucleus (dLGN). Additionally, we observed responses in the visual cortex (VC) and medial frontal cortex (mFC).The activation maps of the tamoxifen and control group at the 7-week timepoint differed in SC and unilaterally in the dLGN (Figure 2). No statistically significant differences between the groups were found in the activation maps at baseline or 19 weeks. The group-level fMRI responses in both groups and all timepoints are shown in Figure 3. In the control group, the responses in dLGN and VC gradually decreased with time. The amplitude of the responses notably decreased in all ROIs in the tamoxifen group at 7 weeks and partially recovered at the 19-week timepoint. In the AUC analysis, significant differences between the tamoxifen and control group were found in the dLGN and SC at the 7-week timepoint (Figure 4).
Discussion
We observed responses in the main nodes of the visual pathway in both groups and all timepoints. Additionally, we observed a response in mFC, which is known to modulate visual processing4. The sensory responses in the mFC are often reduced under anesthesia5, therefore our findings point out the potential of ketamine-xylazine anesthesia in studying higher order cortical processing. The differences between the groups were observed at 7 weeks post-injection when demyelination occurs in this animal model. This also corresponds to the altered motor function observed in this model1. This motor function partially recovers by 19 weeks post-injections, when the functional response was also restored in our study. Even though the model used here features widespread demyelination and therefore no lateral variations were anticipated, thalamic nuclei showed unilateral alteration during demyelination. This could be explained by lateral preference in the visual response of the animals or by a bias in the experimental setup. Additionally, we have observed a decrease in the strength of the responses in the control group over time, which could be connected to the aging or chronic effect of the anesthesia.Conclussion
We used a model of demyelination and remyelination in visual stimulation fMRI and demonstrated an altered functional response in the superior colliculi and thalamus during the demyelination. This functional deficit was then restored during the remyelination. Therefore, we conclude that fMRI can detect myelination-related functional changes in brain circuits.Acknowledgements
This work was supported by F. Hoffmann-La Roche Ltd and The Finnish Cultural Foundation (grant no. 00230292).References
1. Hartley, M. D. et al. Myelin repair stimulated by CNS-selective thyroid hormone action. JCI Insight 4, (2019).
2. Paasonen, J. et al. Multi-band SWIFT enables quiet and artefact-free EEG-fMRI and awake fMRI studies in rat. Neuroimage 206, 116338 (2020).
3. Lehto, L. J. et al. MB-SWIFT functional MRI during deep brain stimulation in rats. Neuroimage 159, 443–448 (2017).
4. Zanto, T. P., Rubens, M. T., Thangavel, A. & Gazzaley, A. Causal role of the prefrontal cortex in top-down modulation of visual processing and working memory. Nature Neuroscience 2011 14:5 14, 656–661 (2011).
5. Sellers, K. K., Bennett, D. V., Hutt, A., Williams, J. H. & Fröhlich, F. Awake vs. anesthetized: layer-specific sensory processing in visual cortex and functional connectivity between cortical areas. J Neurophysiol 113, 3798 (2015).
Figures