3319
Validation of Resting State Functional Connectivity of S2 in Squirrel Monkey Brain: Comparisons with Optogenetic and Tactile fMRI1Vanderbilt University Institute of Imaging Science, Vanderbilt University, Nashville, TN, United States, 2Department of Biomedical Engineering, Vanderbilt University, Nashville, TN, United States, 3Department of Radiology and Radiological Sciences, Vanderbilt University, Nashville, TN, United States, 4Department of Molecular Physiology and Biophysics, Vanderbilt University, Nashville, TN, United States, 5Department of Physics and Astronomy, Vanderbilt University, Nashville, TN, United States
Synopsis
Keywords: Functional Connectivity, Brain
Motivation: To validate the derivation of functional networks from resting state and confirm the contribution of specific neuron types to BOLD responses.
Goal(s): Our aim is to compare resting state BOLD-derived functional networks with those from neuron-type selective optogenetic and natural tactile stimulationin the non-human primate brain.
Approach: We compared the BOLD signals in the brains of squirrel monkeys under three conditions: in response to blue light optogenetic stimulation, vibrotactile stimulation of fingers, and in a resting state.
Results: It shows the neural specificity of the optogenetic fMRI approach and its potential to enhance the understanding of brain circuits and connectivity within S2.
Impact: This study's validation of functional networks from resting-state BOLD acquisitions and the confirmation of optogenetic fMRI's neural selectivity helps with the understanding brain function. These results encourage further investigations for deeper insights into neurological conditions.
Introduction
This study focuses on the secondary somatosensory cortex (S2) in squirrel monkey brain because of its essential role in gating and integrating tactile and painful information. Optogenetic fMRI studies of brain circuits rely on the selective excitation of cells that have been targeted by a virus that introduces a blue light wavelength-specific opsin1, ChR22, expressed in excitatory pyramidal neurons within S2. Whole brain responses to pyramidal neuron activation can be captured by BOLD fMRI3,4. Direct comparisons may then be made of BOLD responses under neuron-specific activation, tactile sensory stimulation, and in a resting-state, which may validate the predictions of resting state derived networks.Materials and Methods
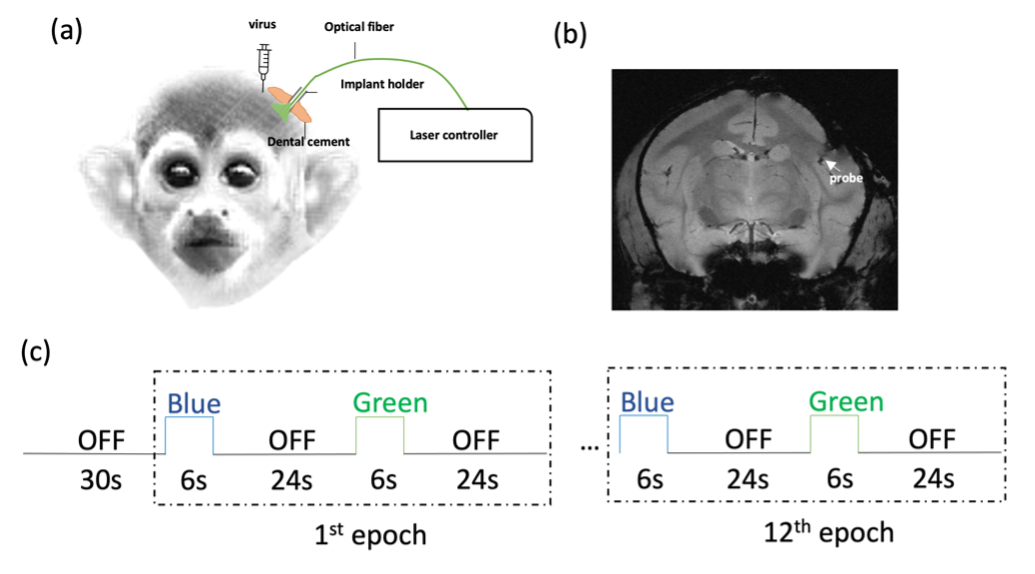
a. Animal preparation: Two squirrel monkeys were studied. AAV5/9-CaMKIIa-ChR2 was transfected into the electrophysiologically defined hand representation region in S2 of the left hemisphere. Successful expression of ChR2 was validated by electrophysiology recordings. Optical fibers were later implanted into the S2 virus injection site for opto-fMRI studies (Fig. 1a and b). Both blue (473 nm wavelength) and green (561nm wavelength, control) laser lights were delivered during fMRI experiments.b. Data Acquisition: High-resolution BOLD and T2*-weighted structural MR images were acquired at 9.4T using a home-built coil5,6. BOLD images were obtained using a T2*-weighted GE-EPI sequence (TR/TE = 750/10.8ms, resolution 0.43×0.43 mm2, FOV 55×55 mm2,24 slices, thickness 1 mm). Laser stimulations (4 mW, 8 Hz, 129 mW/mm2) were delivered via optical fibers in a run of twelve 6-sec ON and 24-sec OFF blocks preceded by a 30-sec baseline (Fig. 1c). The presentations of blue and green light stimuli were interleaved. In separate runs, 8 Hz vibrotactile stimulation was applied to the D2 and D3 digits of the right hand of the monkey, with 30-sec for baseline, 30-sec ON, and 30-sec OFF (7 epochs). Resting-state fMRI runs, comprising 150 volumes, were also acquired within each imaging session.
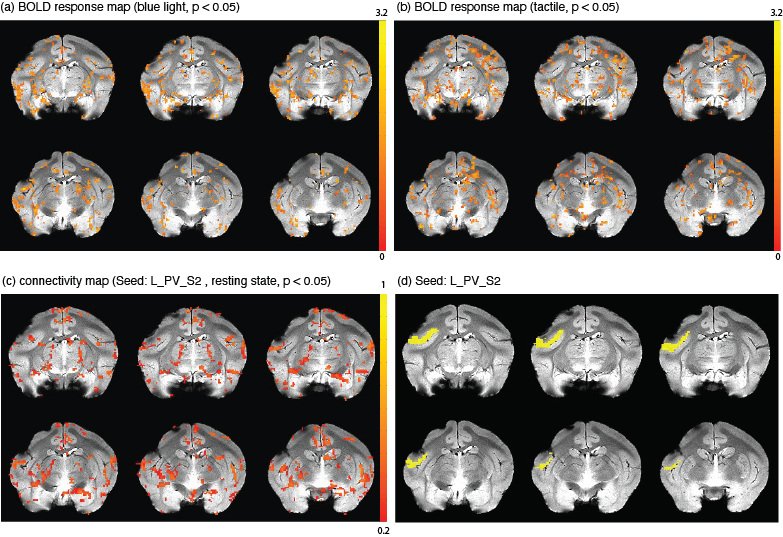
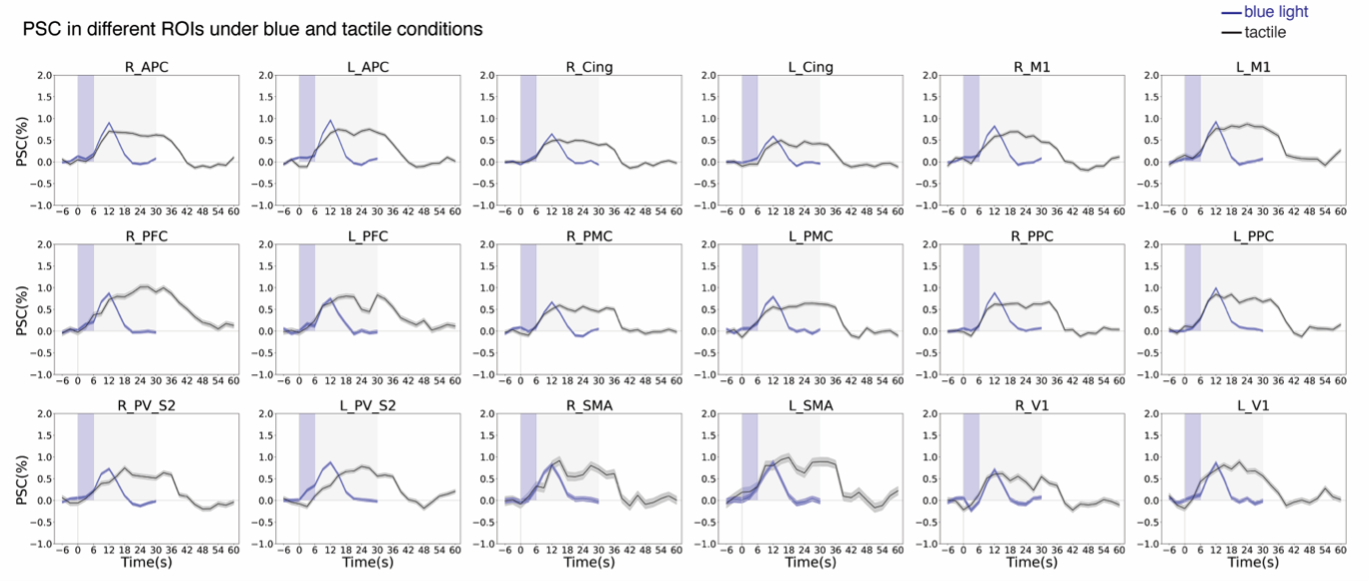
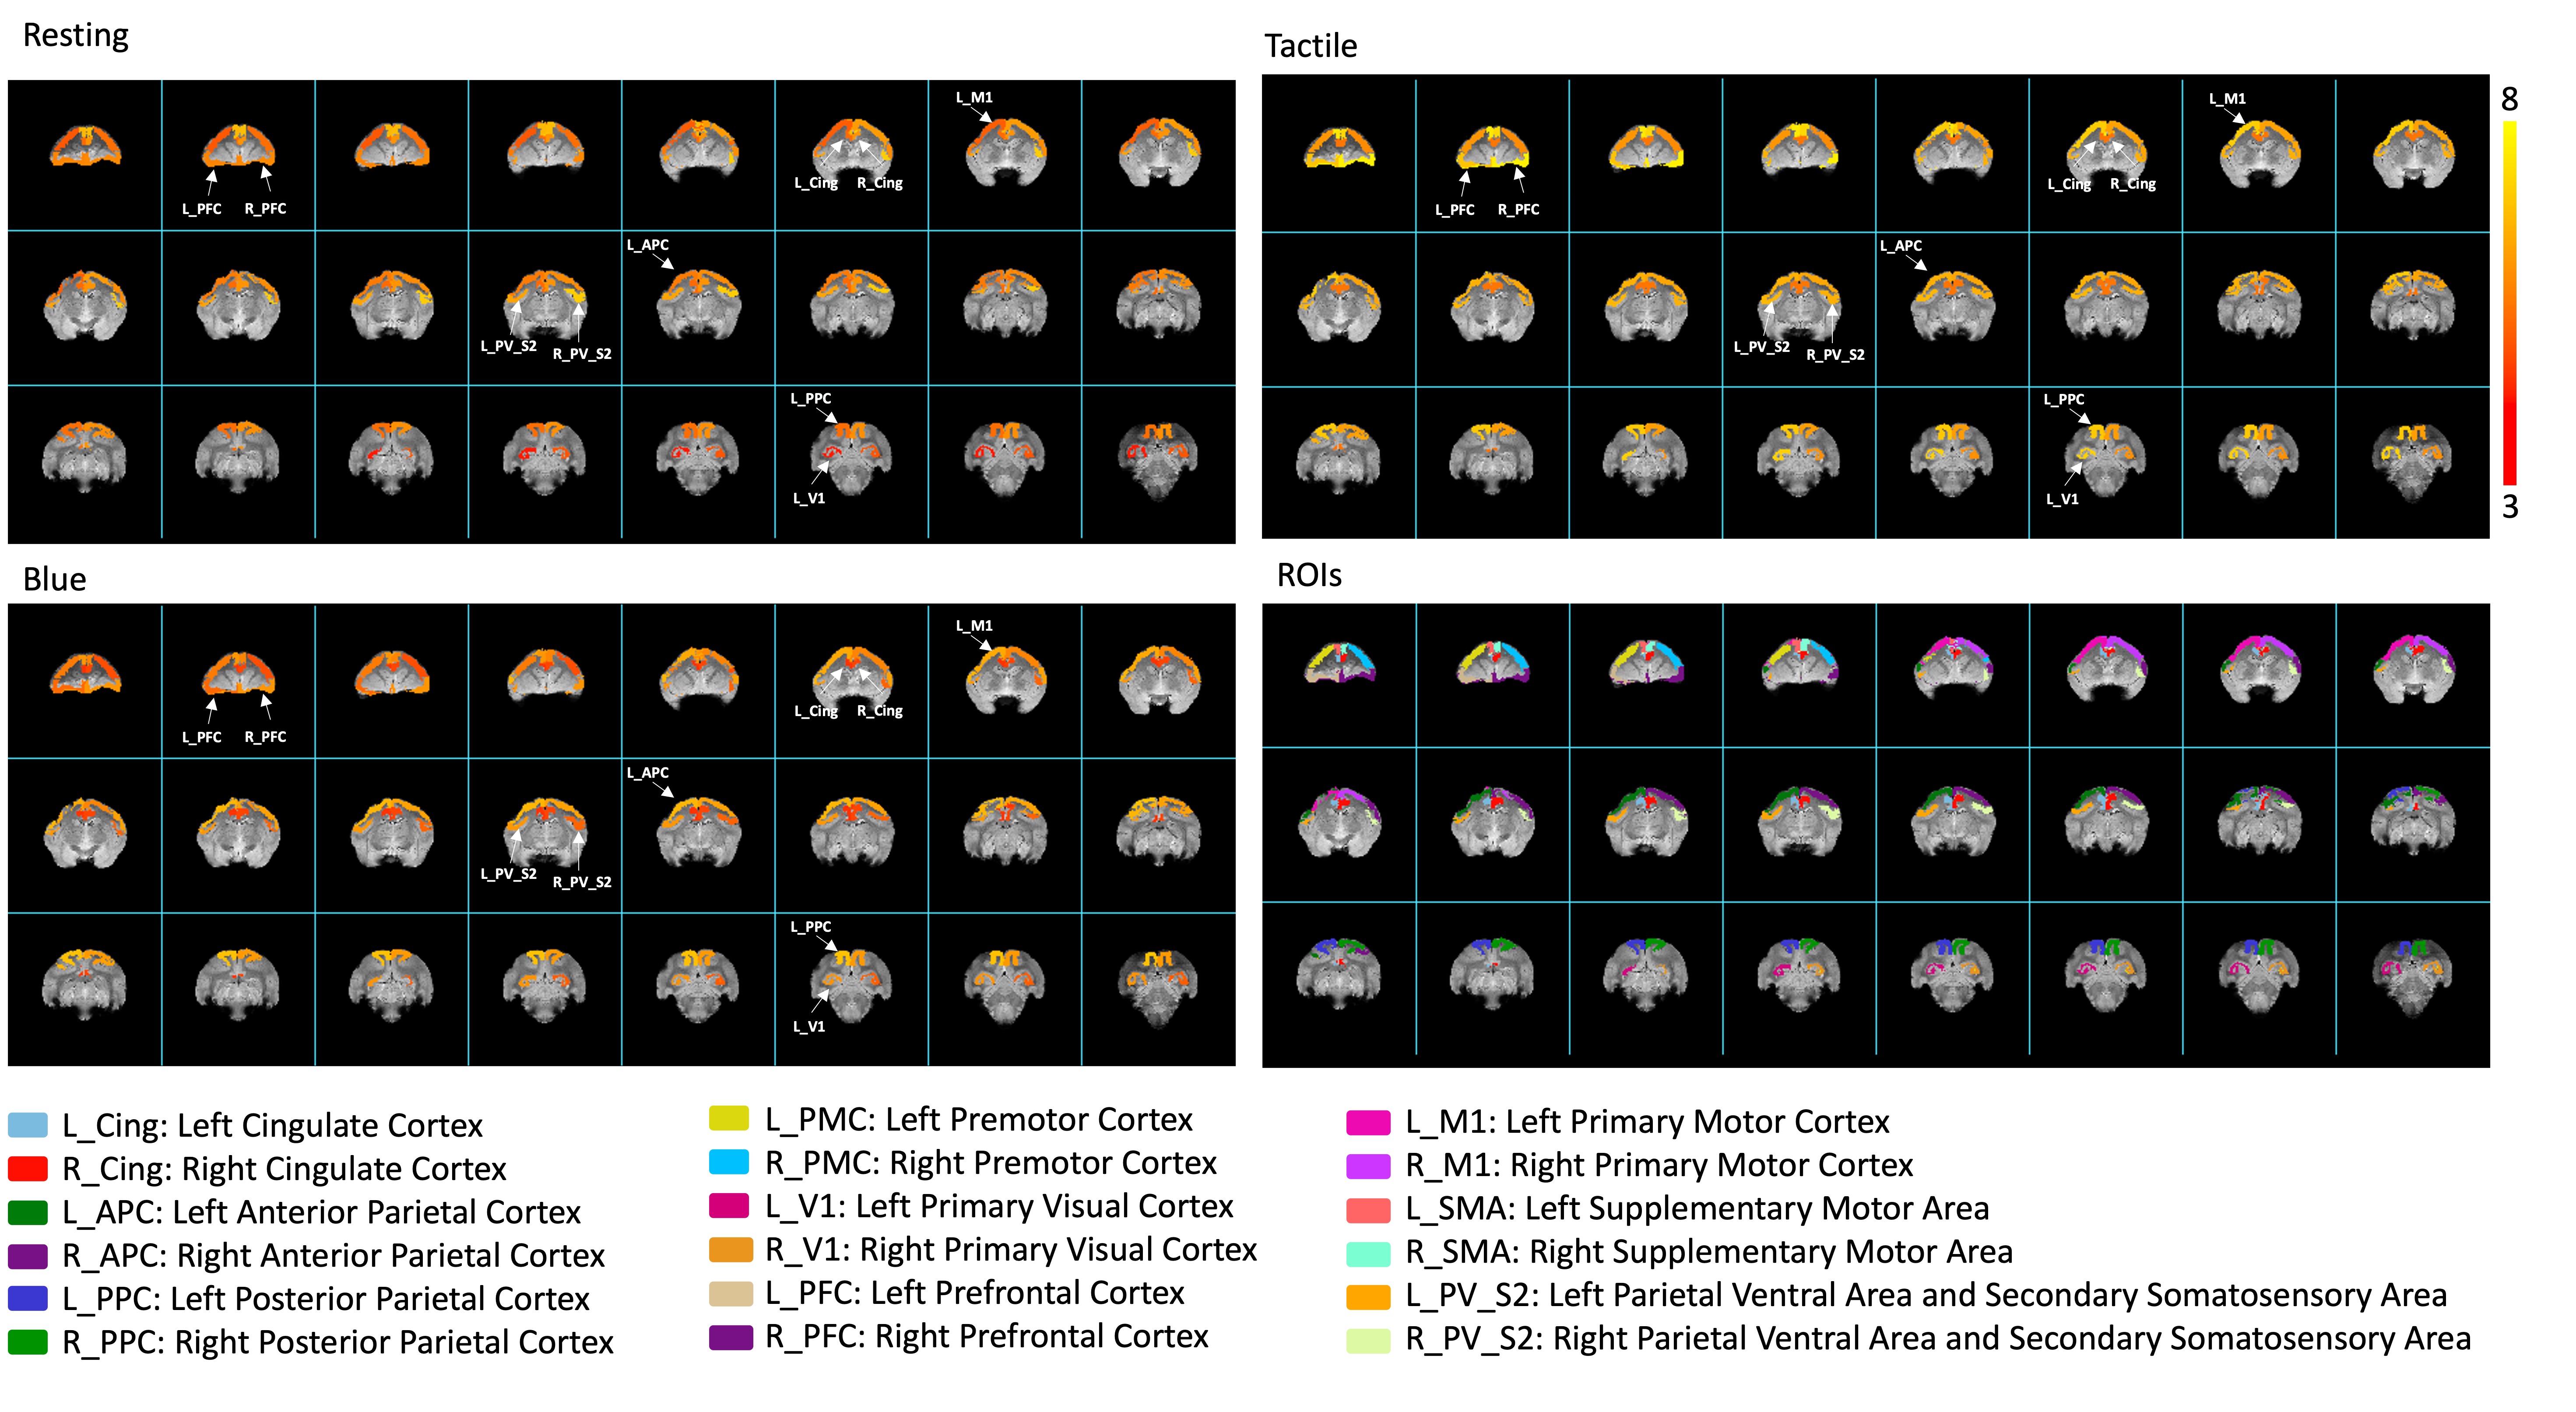
c. Data processing: 6 runs of fMRI data during blue/green laser stimulation, 6 runs of tactile stimulation, and 4 runs of resting-state data, were acquired and analyzed. BOLD fMRI data were processed with AFNI (http://afni.nimh.nih.gov/afni) similar to our previous study7. For each run, activated voxels were defined as those showing stimulus‐related signal changes at a statistically significant level of p < 0.05 with cluster correction. Connectivity maps were obtained through seed-based (L_PV_S2) analyses of resting-state images. We calculated the percentage BOLD signal changes (PSC) associated with blue light and tactile conditions by subtracting the mean value from the signal at each time point after stimulation and dividing it by the mean pre-stimulus onset baseline values. PSC BOLD time courses were extracted from gray matter ROIs defined in the squirrel monkey VALiDATe29 atlas8. To quantify the PSC within identified ROIs, voxels were thresholded at t > 0.9 and the PSC values were averaged. The fractional contributions of each ROI to the total BOLD signal were then calculated for each ROI. For comparison, the integrated value of the correlations of the seed to all the ROIs was calculated and the fractional contribution of the correlation of each ROI to the total was found.
Results
Fig. 2 shows BOLD activation maps evoked by blue light and tactile stimulation and seed-based resting-state connectivity maps. Fig. 3 shows percentage signal changes in each ROI. Fig. 4 presents a comparison of fractional contributions for each ROI in response to resting, tactile, and blue light stimulation. During the right-hand tactile task, specific ROIs exhibited pronounced changes in contributions compared with the resting state. The left M1, PPC and SMA, associated with sensorimotor integration, demonstrated increases in contribution during tactile stimulation. In contrast, certain ROIs, including left Cing, right Cing, right PPC, and right M1 show a decrease in contribution during tactile stimulation. The right PFC and left PFC also display an increase in activity during tactile stimulation. Blue light and tactile stimulation led to similar increases in the left PPC and left M1 and decreases in the left and right Cing regions. Notably, the left PMC (FC: 4.71%-5.39%), left PV_S2 (FC: 5.77%-6.22%), right V1 (FC: 4.55%-4.83%), and right PMC (FC: 4.38%-5.17%) show similar contributions under three different conditions. This suggests a shared neural response and potential interaction between sensory and associative processing in these regions during both types of stimulation. The APC in both hemispheres exhibits an increase compared to the resting state in response to blue light but not tactile stimulation.Conclusions
This study shows the neural specificity of the optogenetic fMRI approach and its potential to enhance the understanding of brain circuits and connectivity within S2. These results underscore the intricate interplay between different conditions and brain regions.Acknowledgements
We acknowledge the support of NIH grants R01 NS07868, U18 EB 029351, and R01 EB 028773. Special thanks to Dr. Arabinda Mishra for his help with fMRI data pre-processing.References
1. Carter, M. E. & de Lecea, L. Optogenetic investigation of neural circuits in vivo. Trends Mol Med 17, 197 (2011).
2. Nagel, G. et al. Channelrhodopsin-2, a directly light-gated cation-selective membrane channel. Proc Natl Acad Sci U S A 100, 13940–13945 (2003).
3. Ogawa, S., Lee, T. M., Kay, A. R. & Tank, D. W. Brain magnetic resonance imaging with contrast dependent on blood oxygenation. Proc Natl Acad Sci U S A 87, 9868 (1990).
4. Lin, P., Fang, Z., Liu, J. & Lee, J. H. Optogenetic Functional MRI. J Vis Exp 2016, 53346 (2016).
5. Lu, M. et al. Optimization of a quadrature birdcage coil for functional imaging of squirrel monkey brain at 9.4T. Magn Reson Imaging 79, 45–51 (2021).
6. Yang, Z. et al. RF shielding designs for birdcage coils for preclinical MRI at 9.4 T. Magn Reson Imaging 94, 1–6 (2022).
7. Mishra, A. et al. Functional connectivity with cortical depth assessed by resting state fMRI of subregions of S1 in squirrel monkeys. Hum Brain Mapp 40, 329 (2019).
8. Schilling, K. G. et al. The VALiDATe29 MRI Based Multi-Channel Atlas of the Squirrel Monkey Brain. Neuroinformatics 15, 321–331 (2017).
Figures