3317
Altered Functional Connectivity Density between Obesity and Type 2 Diabetes Mellitus in Rat brain.1College of Biomedical Engineering and Instrument Science, Zhejiang University, Hangzhou, China, 2Department of Endocrinology, School of Medicine, Sir Run Run Shaw Hospital, Zhejiang University, Hangzhou, China, 3Hangzhou Institute of Medicine, Chinese Academy of Sciences, Hangzhou, China
Synopsis
Keywords: fMRI Analysis, Metabolism, obesity diabetes
Motivation: Obesity and hyperglycemia would both affect brain function, while the longitudinal evolution of brain connectivity from obesity to diabetes is unknow.
Goal(s): Obesity and diabetes rat brain were evaluated to find the regions that were mostly affected by the diabetic incidence.
Approach: Rats were scanned at baseline and 10 days after streptozotocin injection (for diabetes model). Functional connectivity density (FCD) was applied to detect affected brain regions.
Results: Visual cortex’s FCD was increased in both obesity and diabetes. Diabetic rats show increased FCD in insular cortex and decreased FCD in ventral pallidum after streptozotocin injection, and these changes are correlated with fasting glycemia.
Impact: Obesity and diabetes show a progressive effect on cortex including visual and insular region. Acute changes are found in diabetic brain after streptozotocin injection for ventral pallidum, which suggested an impaired reward system in the development of T2DM.
Introduction
Diabetes mellitus has become a major public health issue over the past 40 years, with a sedentary lifestyle leading to chronic obesity that increases the risk of insulin resistance (IR) and development of type 2 diabetes (T2DM)[1]. Recent research discovered that chronic obesity would damage brain structure and function, and then elicit abnormal cognition and behavior[2]. Resting-state functional magnetic resonance imaging (rsfMRI) is used to assess spontaneous neural activity. The functional connectivity density (FCD) based on the voxel-wised correlation of blood oxygen level-dependent (BOLD) time series is a powerful index for globally reflecting functional changes[3]. A recent study reported cortex FCD changes in chronic T2DM patients[4]. However, the longitudinal transition from obesity to T2DM in brain remains largely unknown. This study is to explore the obesity and T2DM effects on rat brain, aiming to find longitudinal changes in brain FCD that marks the negative influences of hyperglycemia to functional integrity. The correlation between cortex, subcortex FCD value and plasma glycemia are evaluated.Methods
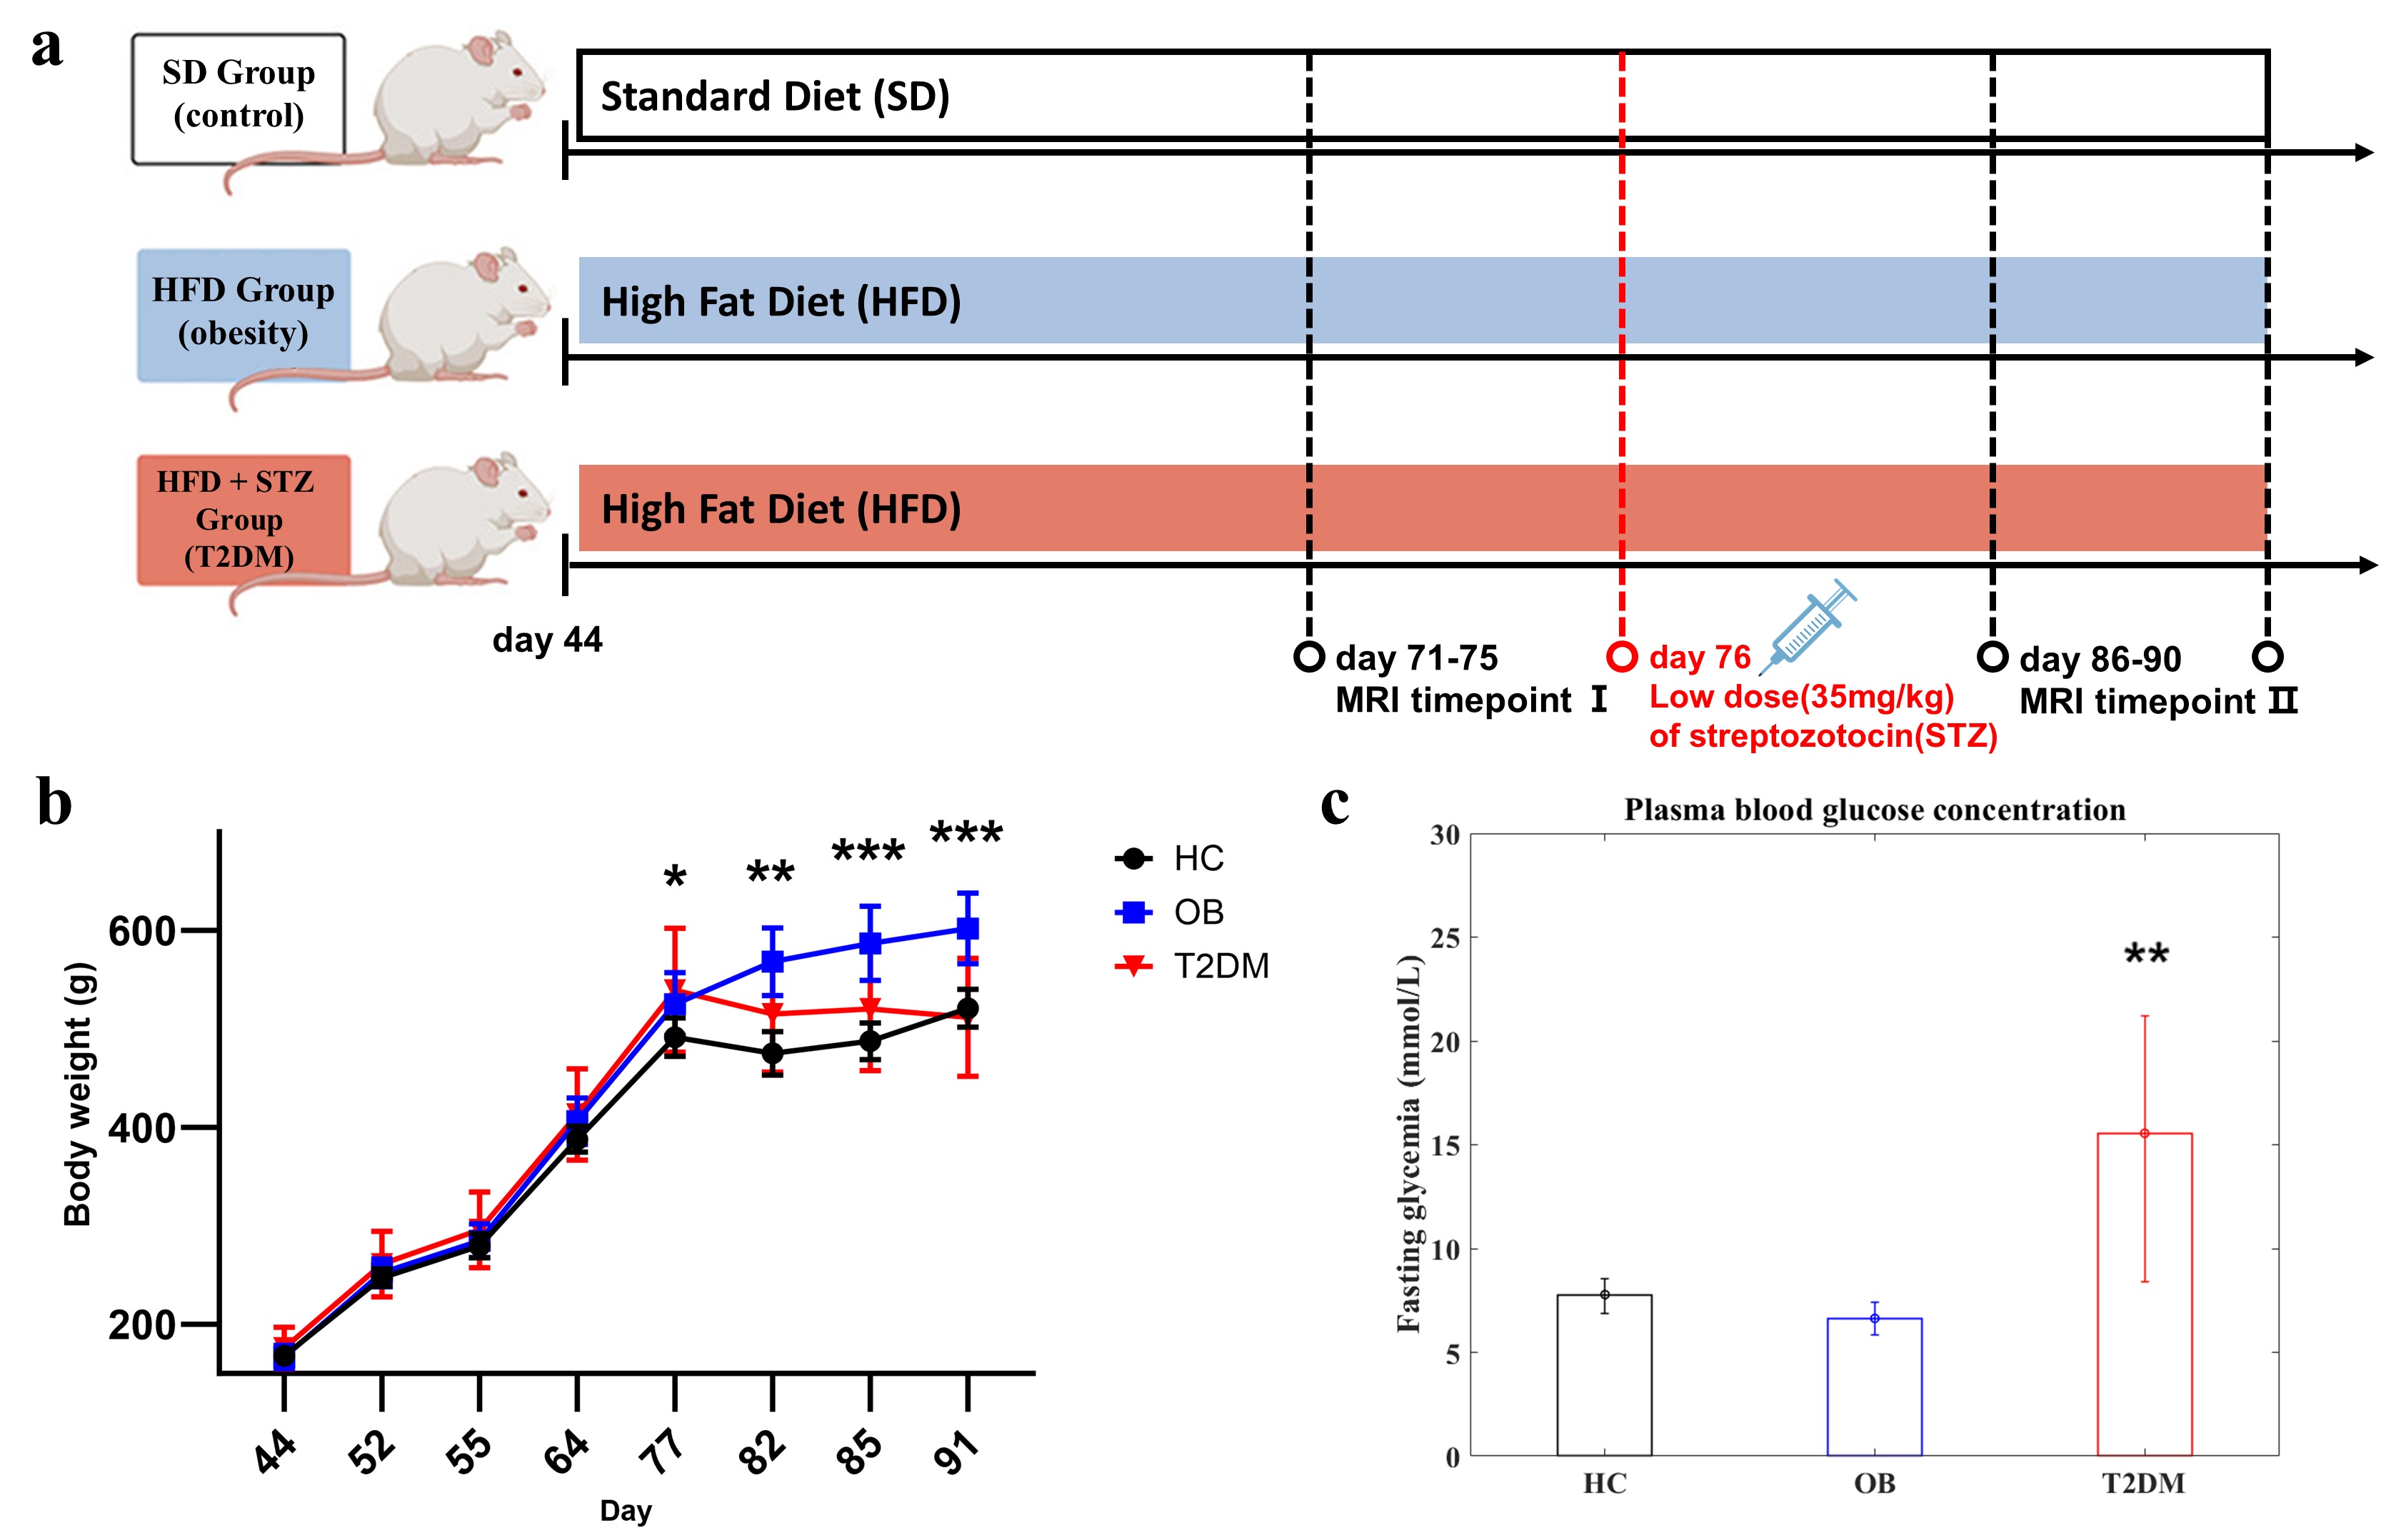
Instruments: Experiments were performed at 7.0T on a Bruker 70/20 USR system with Single channel quadrature rat surface coil for detection.Animal maintenance and treatment: six-week-old Sprague-Dawley rats were arbitrarily divided into 3 groups (n=6/ healthy control (HC) group, n=9/obesity (OB) group, n=8/ Type 2 diabetes (T2DM) group). All rats were kept under standard conditions. On day 76, T2DM group were injected with a low dose (35 mg/kg) of streptozotocin (STZ) to potentiate the T2DM phenotype.
Resting-state functional magnetic resonance imaging (rsfMRI): Rats were anaesthetized with 3% isoflurane for induction and decreased to 1-1.5% (maintenance). fMRI experiments were performed using GE-EPI sequence with TR/TE: 1000/15 ms; field of view: 32×32 mm; matrix 64×64; slice thickness: 1mm; 600 repetitions. Two sessions were recruited.
Data Processing: Before the pre-processing, a PCA-based denoise method was used to enhance signal-to-noise ratio[5]. A threshold of 0.1 was applied to voxel-wised Pearson’s correlation coefficient (CC) in the calculation of FCD maps. The FCD calculation was based on a previously established method[3], and the FCD value was proportionally scaled after normalizing the grand mean FCD to 1 before further analysis.
Statistical analyses: We performed two-sample t-test and Mann-Whitney U test to compare between different experimental groups and to compare between different time points, and p value < 0.05 was considered statistically significant.
Results
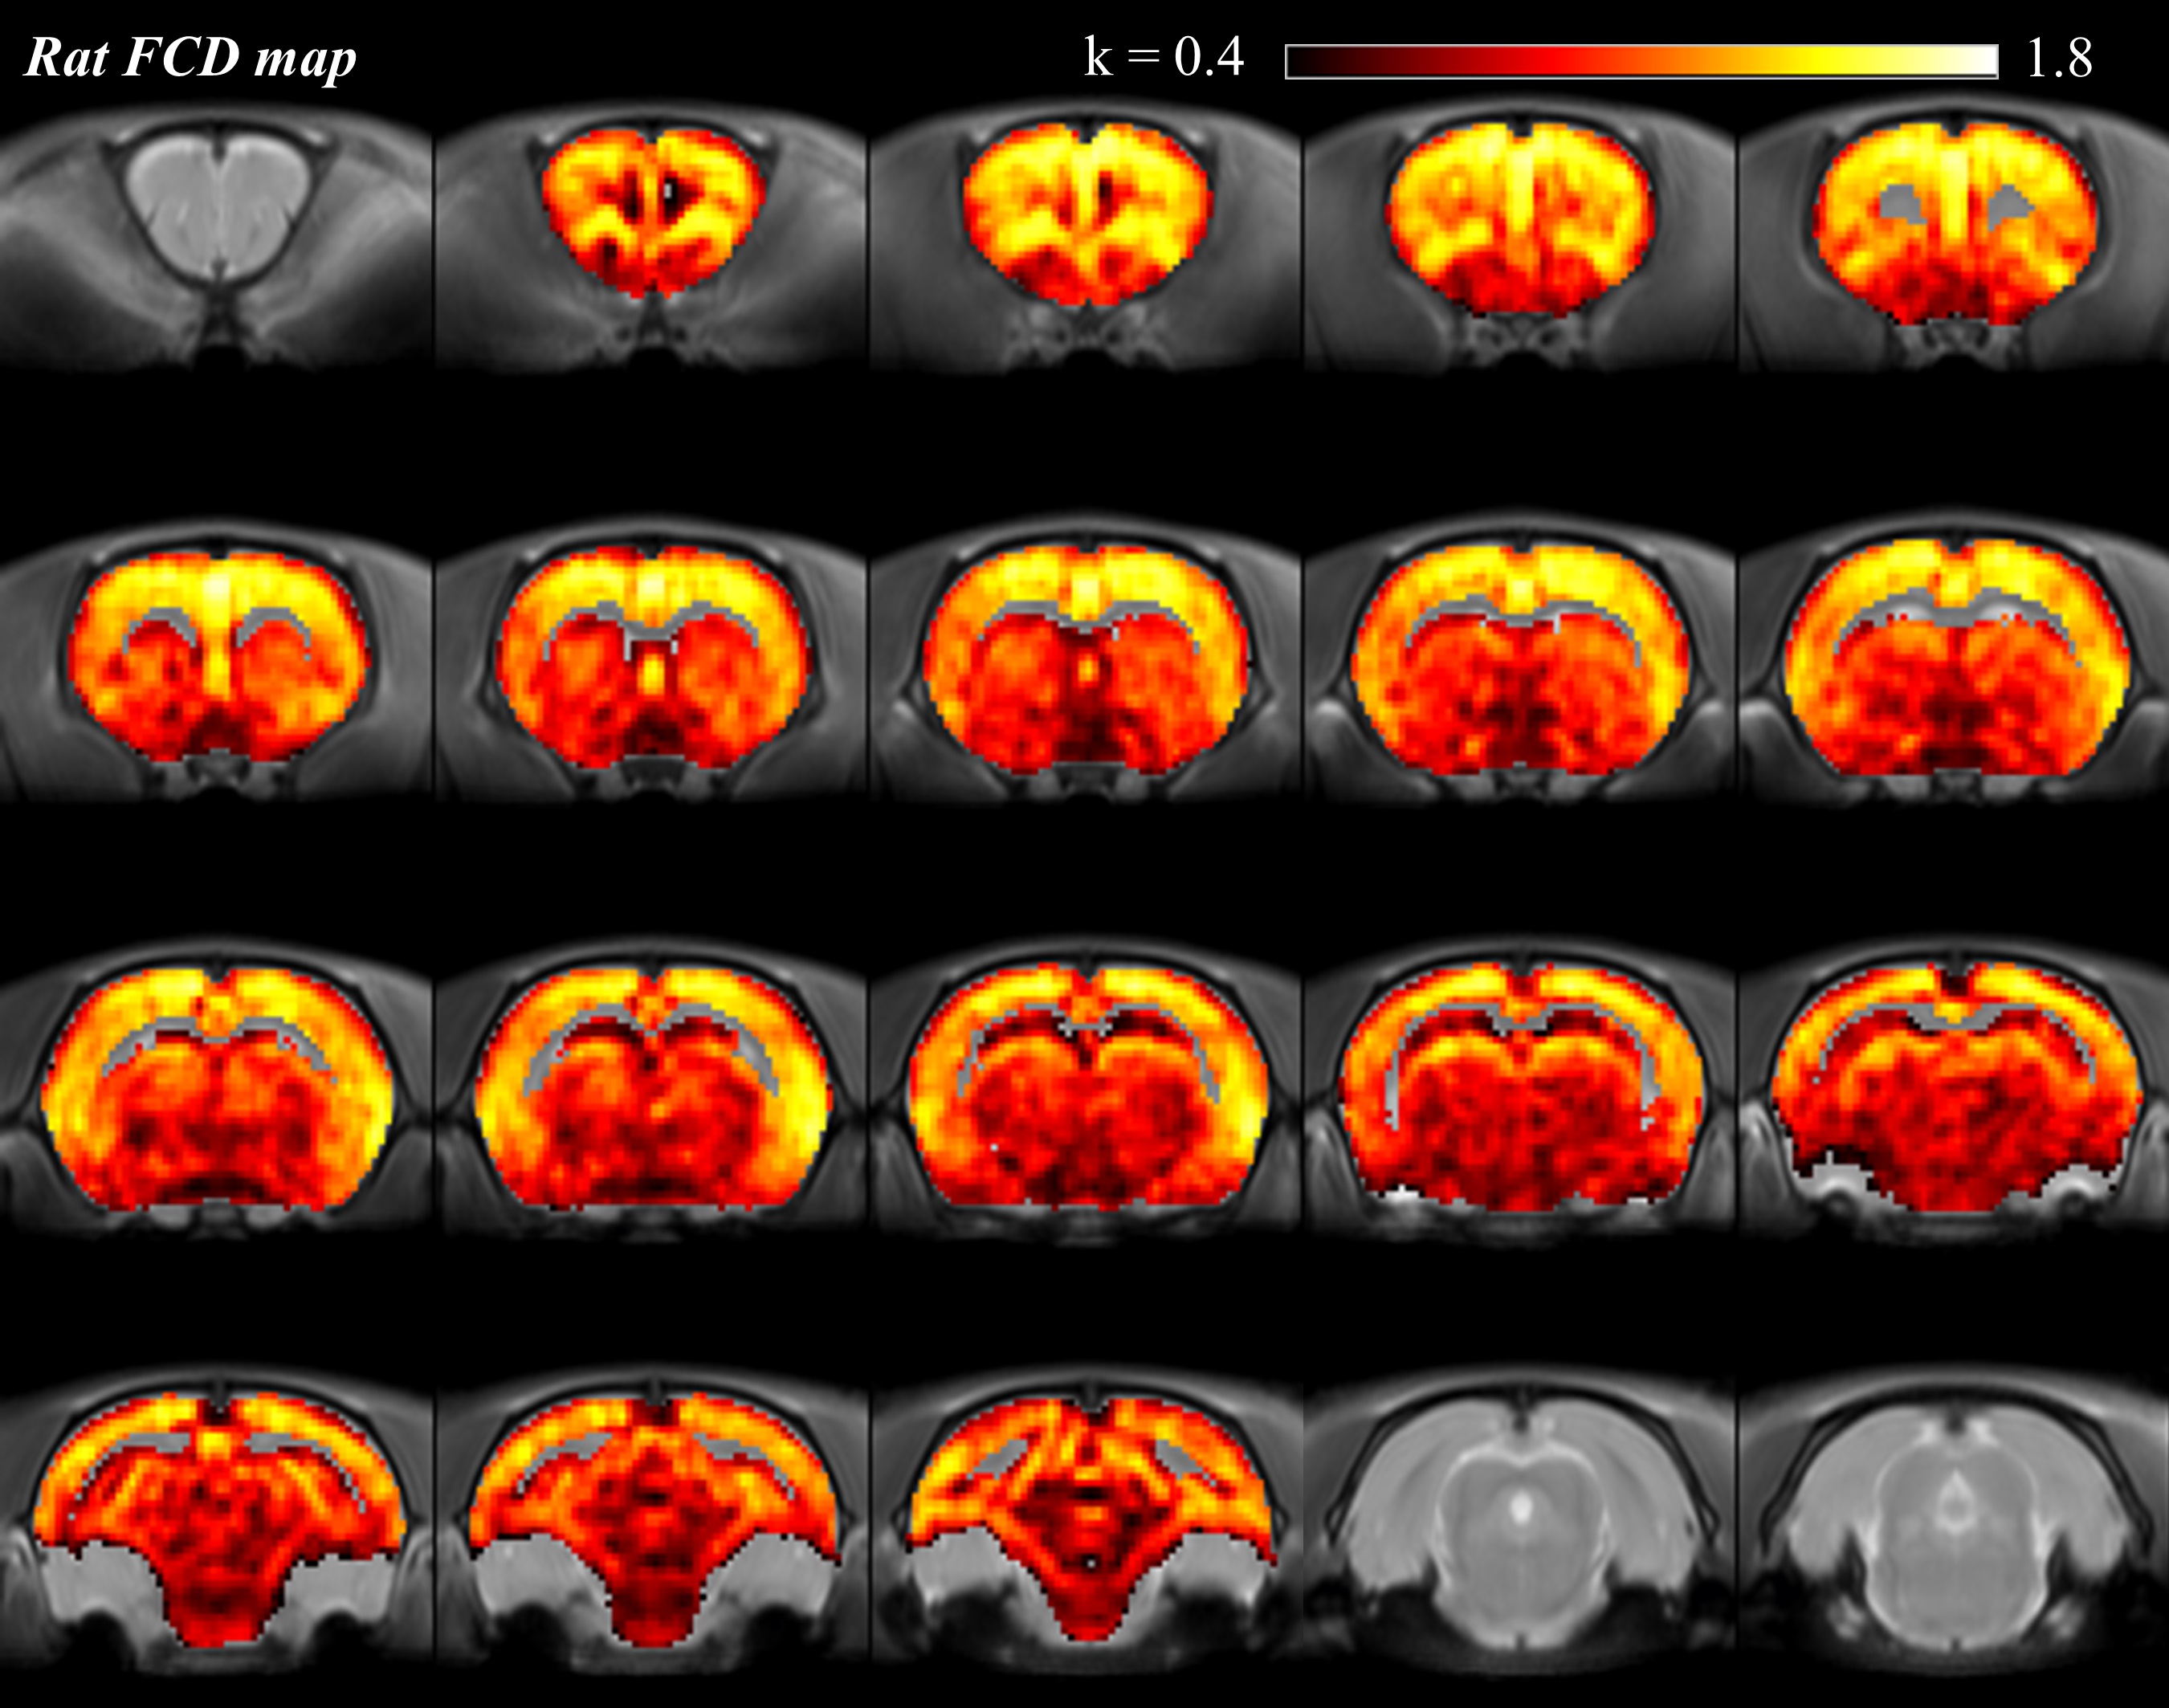
Figure 1a shows the protocol of rats feeding and scanning. In figure 1b, after STZ injection, T2DM groups’ weight was decreased. Figure 1c shows significantly higher plasma blood glucose in T2DM than HC and OB groups before scanning.Figure 2 shows the mean FCD maps across whole HC rats’ session of timepoint II. White matter and cerebrospinal fluid signals were not included in calculation of FCD. FCD value was higher in cortex than in subcortex.
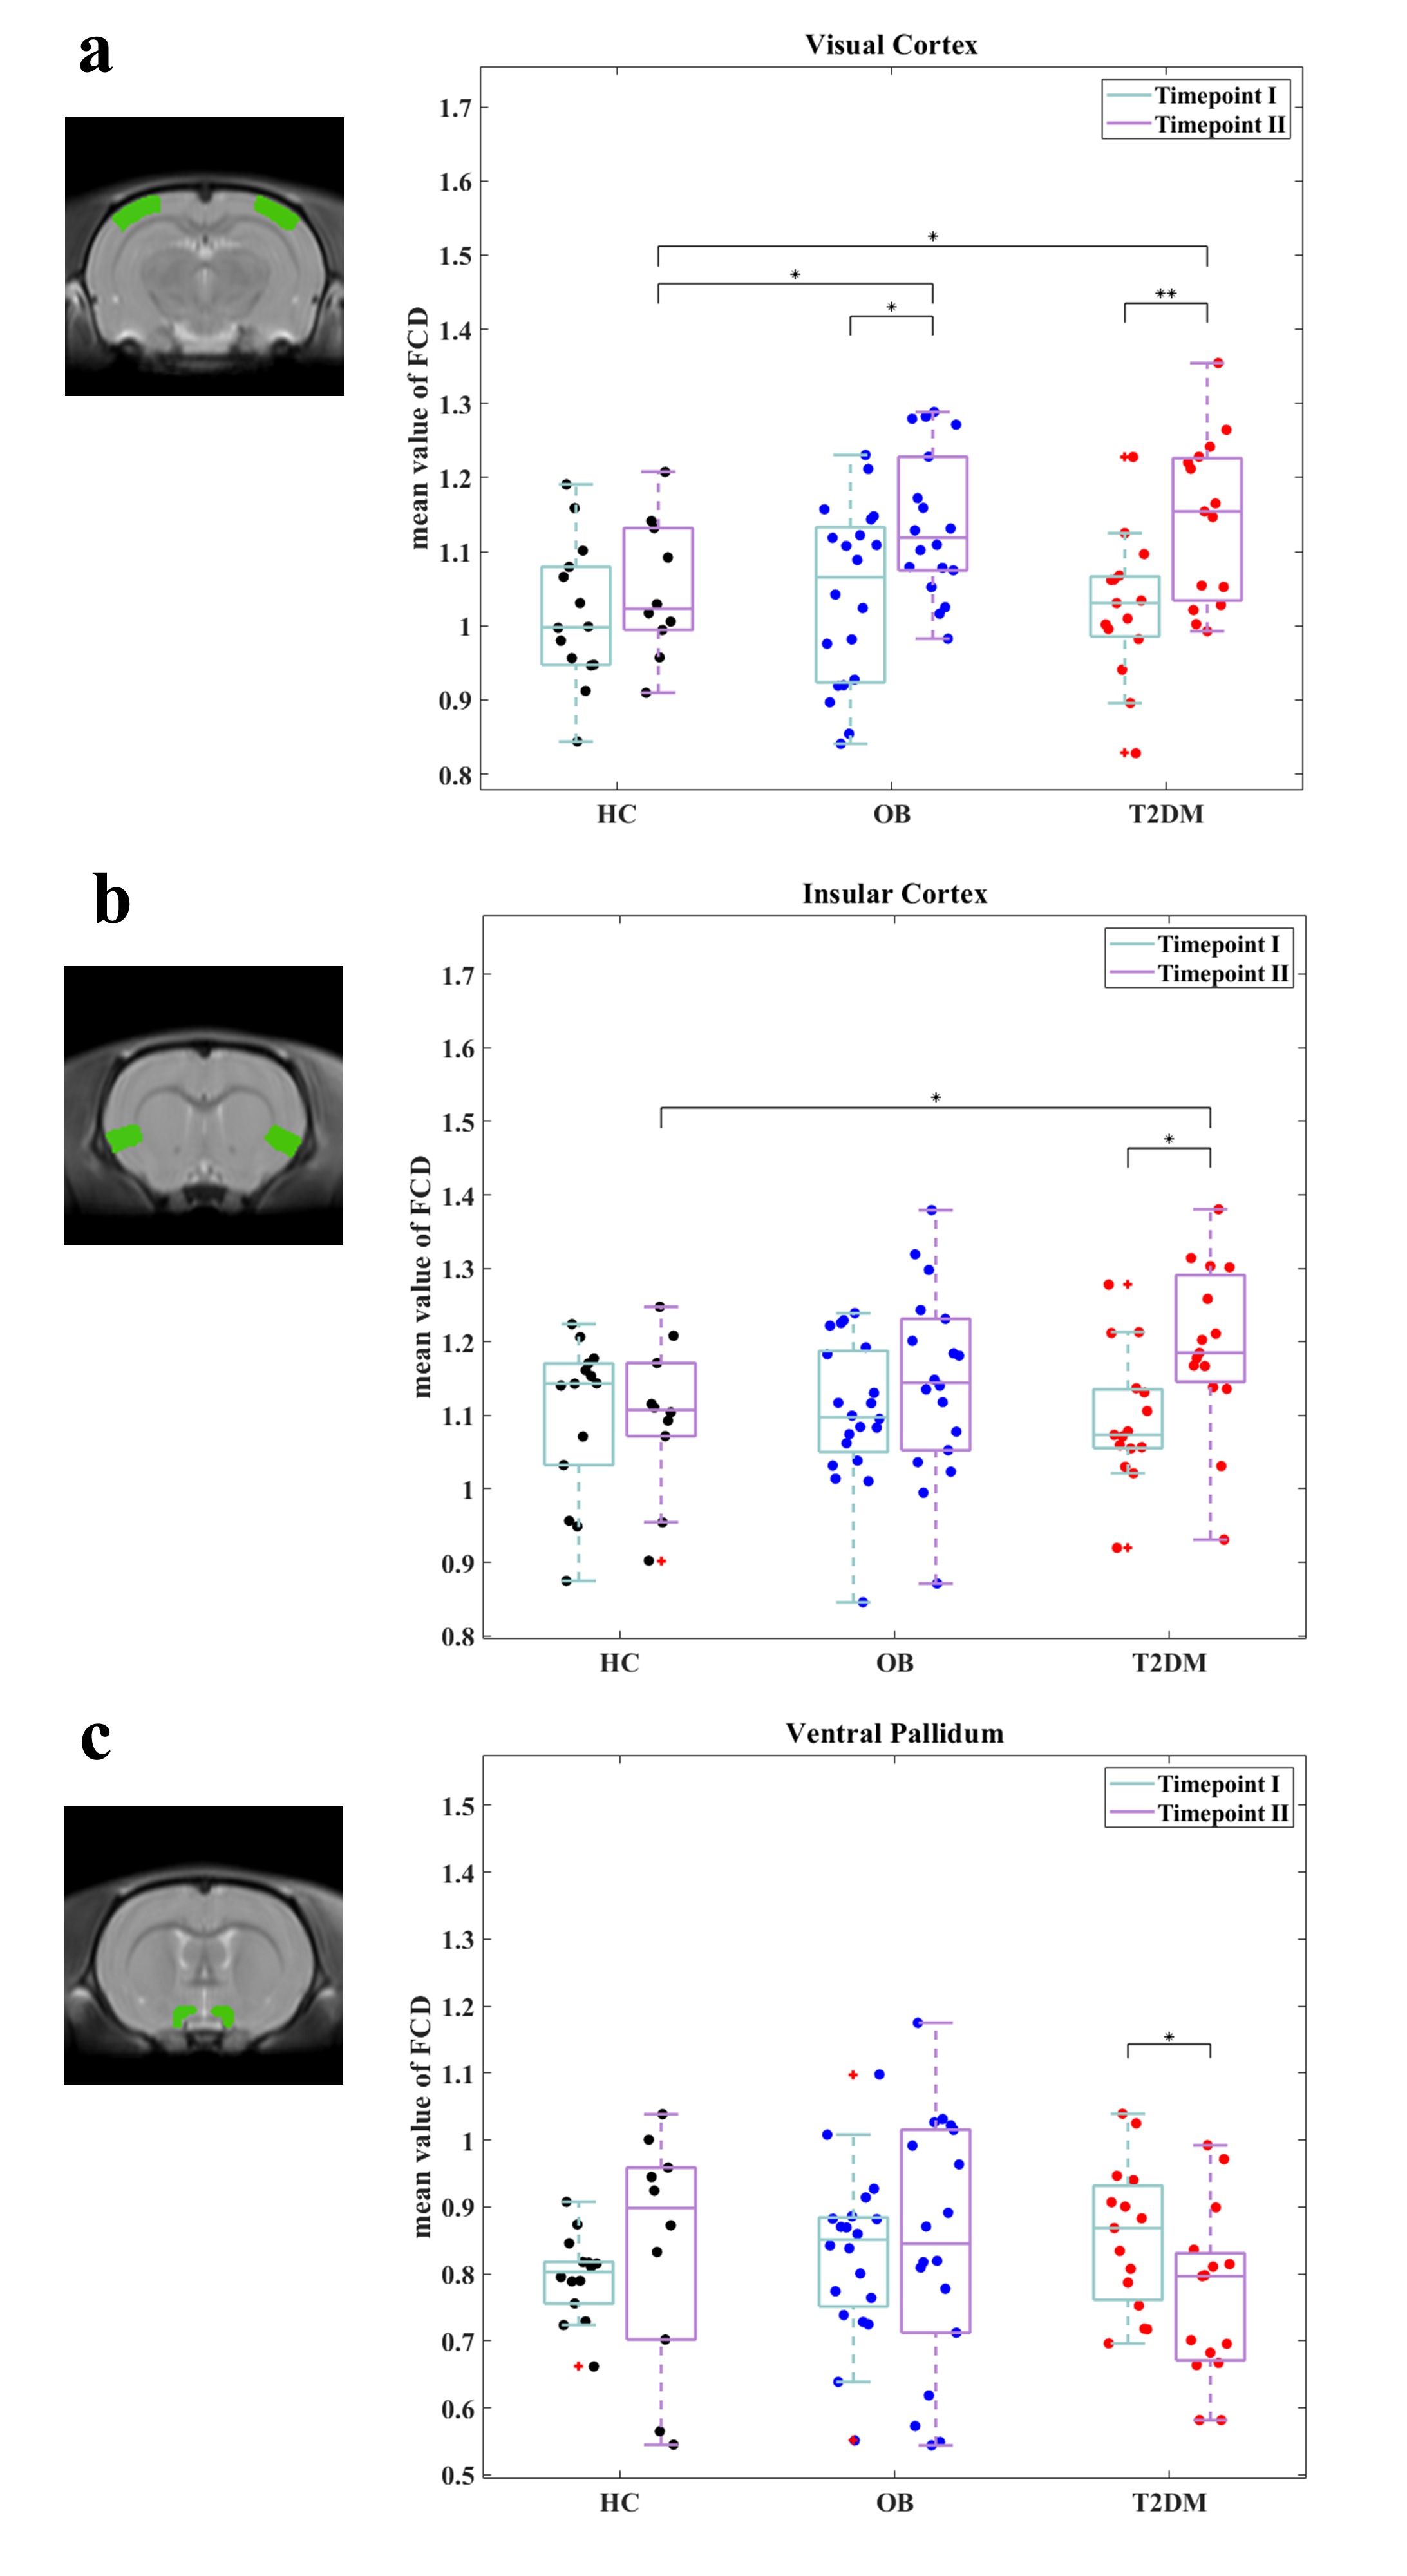
Figure 3 summarized FCD changes in three brain regions. In visual cortex, both OB and T2DM groups showed higher FCD values than HC group at timepoint II. The FCD value also increased significantly from timepoint I to II, while the FCD increase was more dramatic in STZ-injected T2DM rats. In insular cortex, higher FCD was found in T2DM after STZ injection, and was higher than the healthy control. In subcortex region, ventral pallidum (VP) showed significantly decreased FCD in T2DM group after STZ injection.
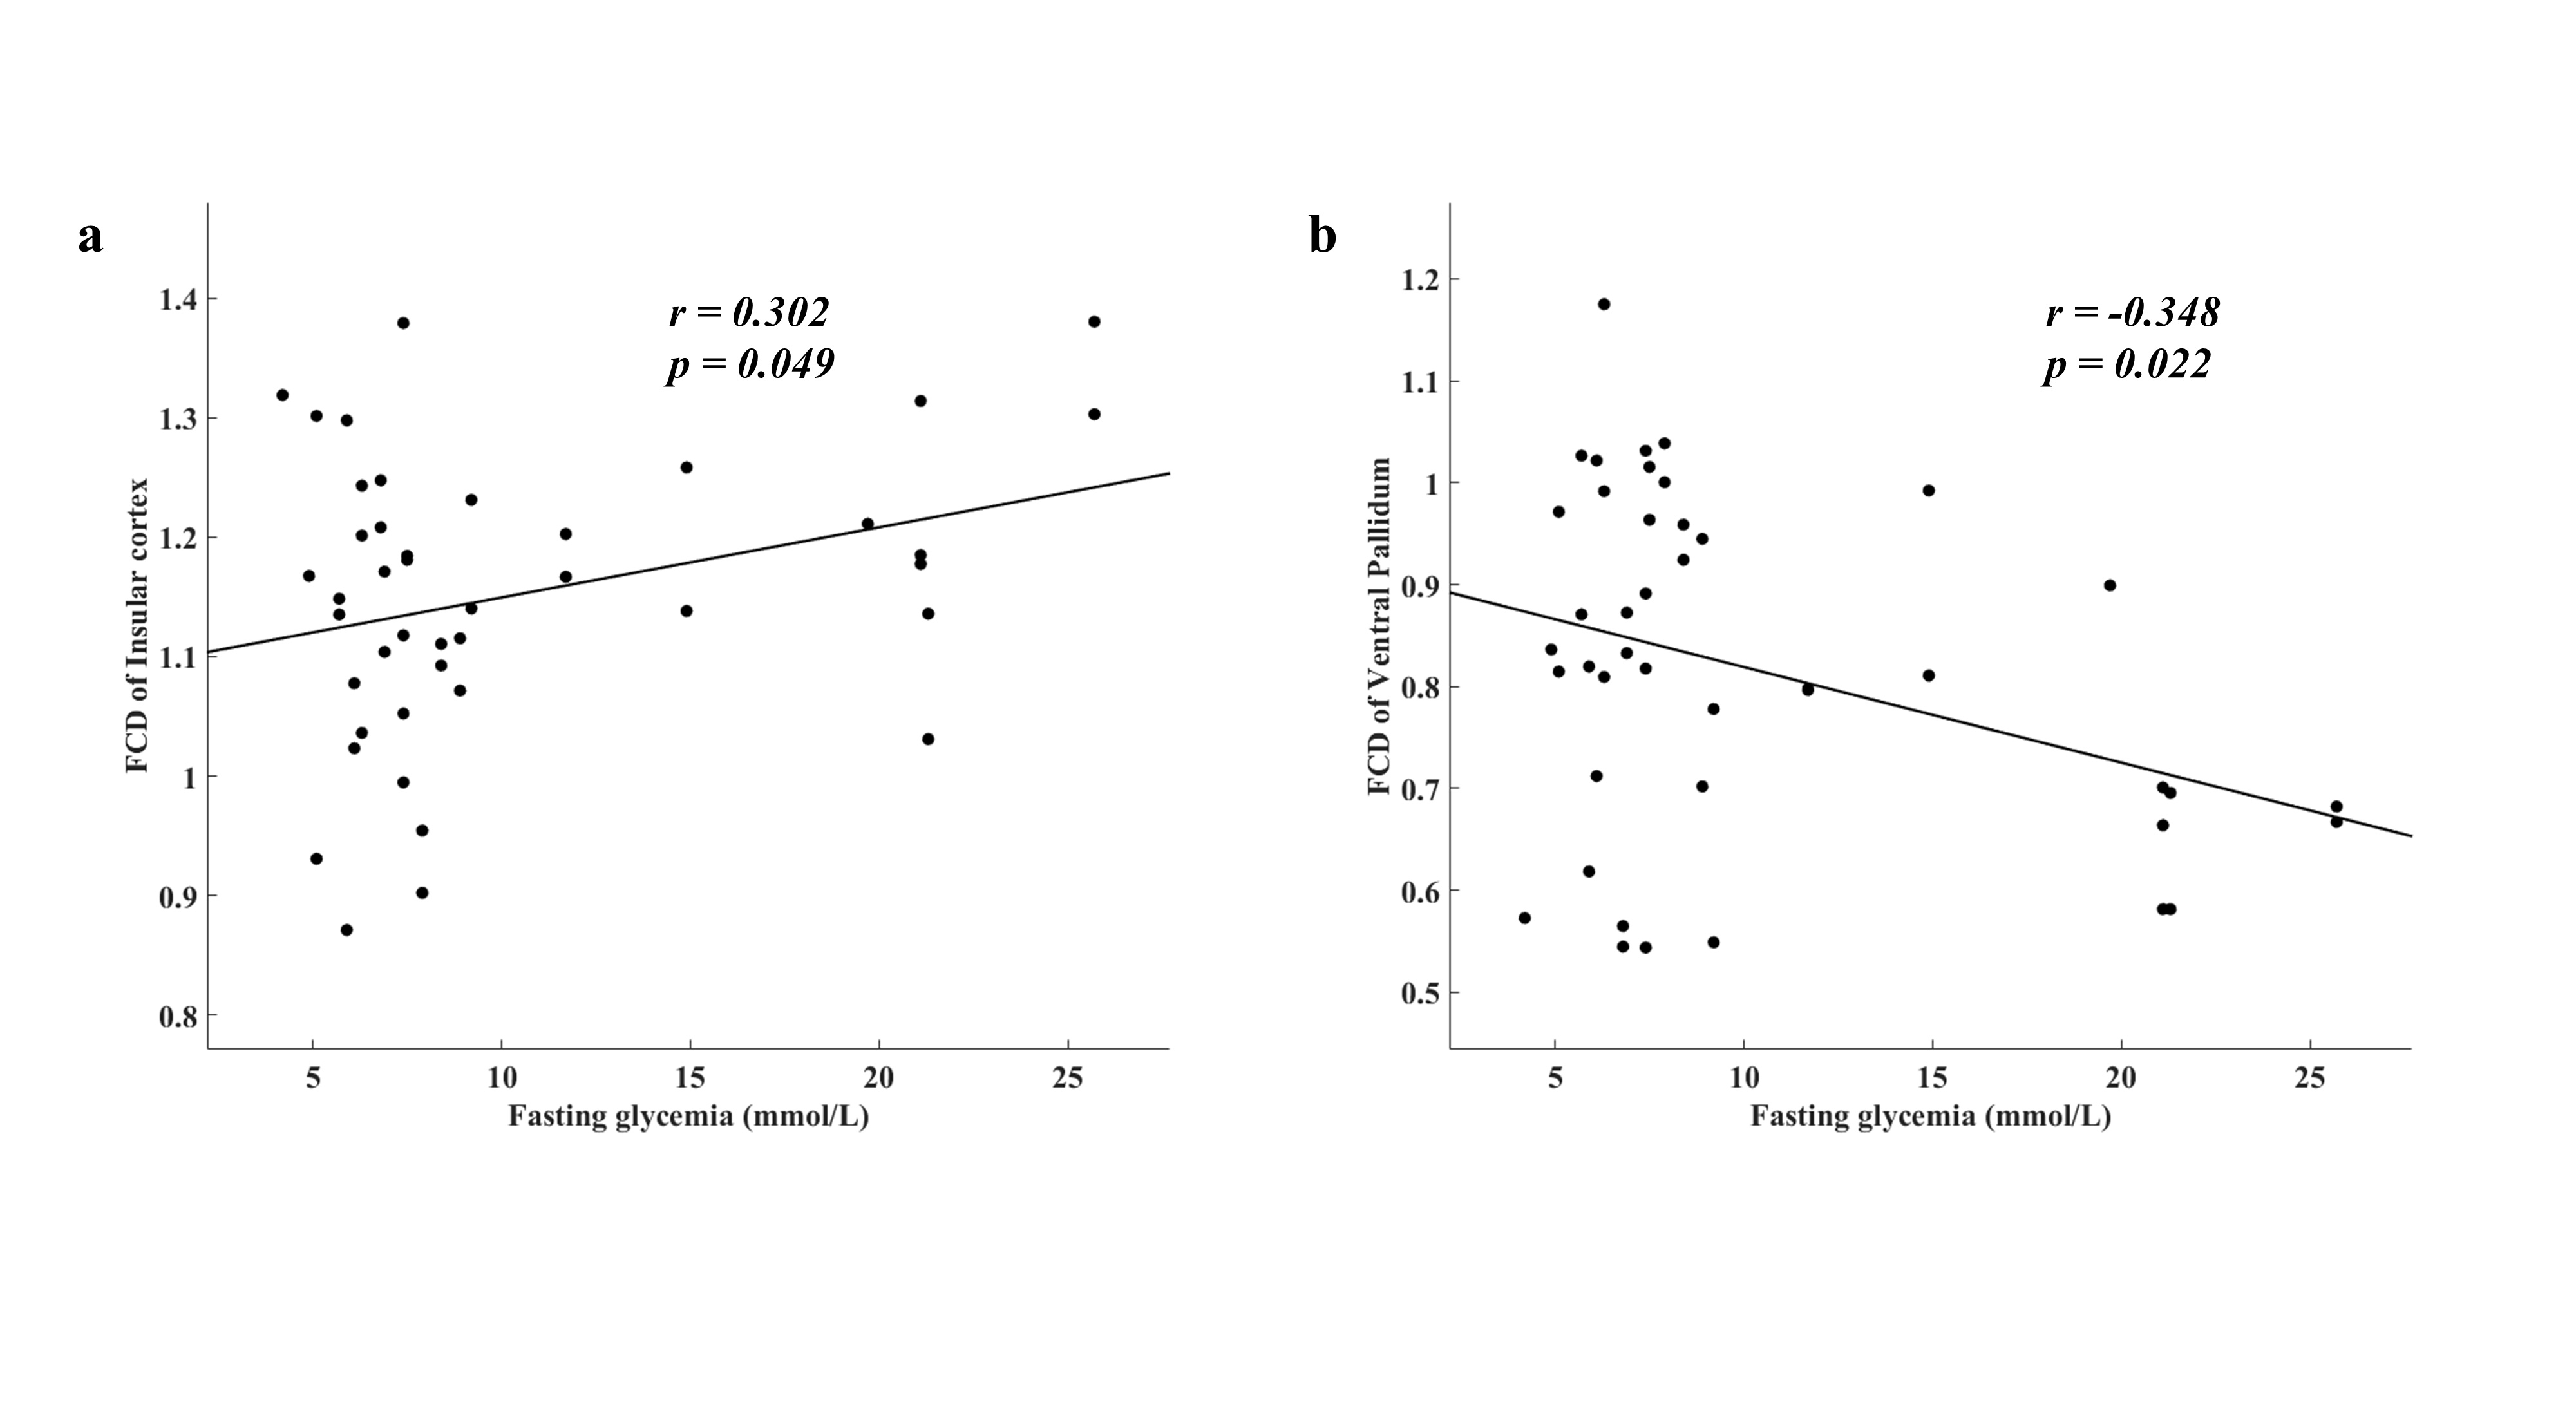
Figure 4 exhibits the correlation between FCD and fasting glycemia. The FCD of insular cortex was positively correlated with plasma blood glucose while VP was negatively correlated with it.
Discussion
The changes in brain function in OB and T2DM groups have been detected and proved different with FCD method, we found that visual and insular cortex had higher FCD in OB and T2DM groups, which was partially consistent with a previous study[6]. The longitudinal increase of FCD in OB and T2DM groups might be explained as a compensatory mechanism to resist the damage in certain important cortex region. In subcortex region, VP showed the lower FCD in T2DM groups after injection of STZ. Of note, we found that the FCD value of VP was negatively correlated to fasting glycemia, implying that VP is an essential hub impaired in the reward system during the development of T2DM by hyperglycemia.Conclusion
Impaired functional connectivity of brain has been detected by using FCD method in obesity and T2DM model rats, suggesting obesity would damage the visual and insular cortex while VP function decline might suggest the impaired reward system in early T2DM. Our study proves the negative effects of obesity and hyperglycemia on brain and add knowledge to the brain function transition from obesity to hyperglycemia.Acknowledgements
No acknowledgement found.References
1. Antar, S.A., et al., Diabetes mellitus: Classification, mediators, and complications; A gate to identify potential targets for the development of new effective treatments. Biomed Pharmacother, 2023. 168: p. 115734.
2. Li, G., et al., Brain functional and structural magnetic resonance imaging of obesity and weight loss interventions. Mol Psychiatry, 2023.
3. Tomasi, D. and N.D. Volkow, Functional connectivity density mapping. Proc Natl Acad Sci U S A, 2010. 107(21): p. 9885-90.
4. Zhang, D., et al., Altered Functional Connectivity Density in Type 2 Diabetes Mellitus with and without Mild Cognitive Impairment. Brain Sci, 2023. 13(1).
5. Veraart, J., et al., Denoising of diffusion MRI using random matrix theory. Neuroimage, 2016. 142: p. 394-406.
6. Jing, J., et al., Increased Resting-State Functional Connectivity as a Compensatory Mechanism for Reduced Brain Volume in Prediabetes and Type 2 Diabetes. Diabetes Care, 2023. 46(4): p. 819-827.
Figures