3315
Targeting Motor and Cognitive Impairments: Comparative Insights into STN-DBS and NAc-DBS Efficacy in Parkinson's Disease Model with Metabolism1Department of Biomedical Engineering, National Yang Ming Chiao Tung University, Taipei, Taiwan, 2School of Medicine, College of Medicine, National Yang Ming Chiao Tung University, Taipei, Taiwan, 3PhD Program in Medical Neuroscience, College of Medical Science and Technology, Taipei Medical University, Taipei, Taiwan, 4Department of Neurology, Hualien Tzu Chi Hospital, Buddhist Tzu Chi Medical Foundation, Hualien, Taiwan, 5Department of Neurology, School of Medicine, Tzu Chi University, Hualien, Taiwan
Synopsis
Keywords: Functional Connectivity, Parkinson's Disease, deep brain stimulation
Motivation: Addressing subthalamic nucleus deep brain stimulation (STN-DBS) limitations in Parkinson's Disease (PD), such as metabolic disorder and cognitive dysfunction. We explored nucleus accumbens deep brain stimulation (NAc-DBS) as an alternative, aiming to enhance motor, cognitive, and metabolic functions comprehensively.
Goal(s): Investigate NAc-DBS effectiveness, bridging STN-DBS gaps, enhancing motor skills, and improving cognitive and metabolic functions in PD.
Approach: Utilized behavioral tests, brain magnetic resonance imaging analysis, and bioenergetic analysis to evaluate NAc-DBS and STN-DBS impact on the MitoPark PD mouse model.
Results: NAc-DBS significantly enhanced cognitive, motor functions, and energy metabolism, offering a promising therapeutic solution for PD patients.
Impact: Our findings transform Parkinson's treatment, sheding a light to patients. The dual benefits of NAc-DBS inspire new inquiries, reshaping therapies with metabolic modulation. Improved outcomes redefine standards, offering hope for enhanced quality of life.
Introduction
Parkinson's disease (PD) is characterized by mitochondrial abnormalities and progressive degeneration in dopaminergic (DA) neurons1, leading to both motor and cognitive impairments2. Deep brain stimulation (DBS) has been widely used to stimulate specific brain regions for neuroplasticity change and circuit modification3,4. While subthalamic nucleus (STN)-DBS is a common treatment for PD, it fails to address cognitive impairments5. In contrast, nucleus accumbens (NAc)-DBS has shown promise in treating cognitive-related diseases and is known to enhance mitochondrial respiration6,7. Despite this understanding, the impact of NAc-DBS on metabolic functions and behaviors in PD remains unclear. In this study, we utilized a genetic MitoPark PD mice model with mitochondrial dysfunction8 to investigate the therapeutic effects of both STN-DBS and NAc-DBS. By employing behavioral assessments, resting-state functional magnetic resonance imaging (rsfMRI), and bioenergetic analysis, we aimed to comprehensively compare the outcomes of STN-DBS and NAc-DBS treatments in the context of both the motor and cognitive circuits, shedding light on their potential differential impacts on PD-related symptoms including metabolic disorder.Methods
To compare NAc-DBS and STN-DBS therapeutic effects, 20-week-old male experimental animals were divided into four groups: wild-type (WT) group (C57BL/6 mice), Mito-Sham group (MitoPark mice), Mito-STN-DBS group (MitoPark mice with implantation of STN), and Mito-NAc-DBS group (MitoPark mice with implantation of NAc) (N = 5, each group) ( Figure 1A, 1B). The Mito-STN-DBS group and Mito-NAc-DBS group received intermittent theta-burst bilateral DBS treatments for 30 minutes every day for seven days (intensity 150 μA, pulse width 100 μs, pulse frequency:200 Hz, burst width 100 ms, inter burst interval 100 ms). Open field test (OFT), novel object recognition task (NOR), and T-maze task were used to evaluate locomotor, long-term recognition memory, and working memory, respectively9-11. In the OFT, mice were allowed to explore the open field maze for 10 mins, and the total distance was analyzed12. NOR was performed by calculating the preference index (PI). The ratio of successful trials in the T-maze task was calculated for reflecting spontaneous alternation. Whole brain images were obtained using a 7 Tesla Bruker MRI scanner (Bruker Biospec 70/30 USR, Ettlingen, Germany) for post-DBS treatment. The gradient-echo planar imaging sequence (TR / TE = 2,000 / 20 ms, FOV = 20 × 20 mm2, matrix size = 80 × 80, bandwidth = 200 kHz, 14 coronal slices, and thickness = 0.5 mm) was used to acquire the rsfMRI images. The Allen mouse brain atlas13 was used to determine the regions of interest (ROIs), which included the motror cortex (M1), medial prefrontal cortex (mPFC), NAc, ventral hippocampus (vHIPP), ventral tegmental area (VTA), and STN (Figure 1C). The analysis of the functional neuroimages (AFNI) program and the FMRIB Software Library v5.0 (FSL 5.0) was used to calculate functional connectivity (FC). The Seahorse XF24 analyzer (Agilent Technologies, Santa Clara, CA, USA) was used to identify the bioenergetic status of oxygen consumption rate (OCR) and extracellular acidification rate (ECAR) using an assay protocol14. Statistical analyses were performed with Kruskal–Wallis test and post-hoc analysis with Dunn’s test among groups (p < 0.05).Results
In the behavioral tests, the Mito-STN-DBS group performed better than the Mito-sham group in total distance test (Figure 2A). However, the Mito-NAc-DBS group showed a higher PI value and correction ratio of the T-maze than the Mito-sham(Figure 2B, 2C). The Mito-NAc-DBS group showed a noticeably higher FC in the M1, mPFC, NAc, STN, vHIPP, and VTA (Figure 3A). In comparison to the Mito-sham group, the Mito-NAc-DBS group showed significantly restored FC in M1, mPFC, NAc, STN, vHIPP, and VTA, while the Mito-STN-DBS group did not present a significant difference (Figure 3B). Furthermore, the Mito-NAc-DBS group showed significantly increased levels of OCR and ECAR than the Mito-sham group in ROIs (Figure 4).Discussion
Both NAc-DBS and STN-DBS can improve motor impairment. As for cognitive impairment, compared to the Mito-sham group, the Mito-NAc-DBS groups show strengthened FC than STN-DBS, which may be associated with the role of NAc-DBS in treating cognitive disease proved by previous studies15,16. Corresponding to the result of FC, NAc-DBS also shows a higher PI value and the correct ratio of T-maze compared to the Mito-sham group. Moreover, NAc-DBS enhanced energy metabolism than STN-DBS compared to the Mito-sham group, consistent with the previous study7.Conclusion
Our findings suggested that NAc-DBS may be a possible therapeutic treatment for both motor, cognitive, and metabolic functions since it improves energy metabolism than STN-DBS. We provided a new targeting brain region for potentially treating PD.Acknowledgements
This work is financially supported by the National Science and Technology Council under Contract numbers of NSTC 112-2622-8-A49-010-TE2, 111-2221-E-A49-049-MY2, 112-2314-B-303-016-, 112-2321-B-A49-009-.
References
1. Ekstrand MI, Terzioglu M, Galter D, Zhu S, Hofstetter C, Lindqvist E, et al. Progressive parkinsonism in mice with respiratory-chain-deficient dopamine neurons. Proceedings of the National Academy of Sciences. 2007;104(4):1325–30. doi:10.1073/pnas.0605208103
2. Aarsland D, Batzu L, Halliday GM, Geurtsen GJ, Ballard C, Ray Chaudhuri K, et al. Parkinson disease-associated cognitive impairment. Nature Reviews Disease Primers. 2021;7(1). doi:10.1038/s41572-021-00280-3
3. Maiti P, Manna J, Dunbar GL. Current understanding of the molecular mechanisms in parkinson’s disease: Targets for potential treatments. Translational Neurodegeneration. 2017;6(1). doi:10.1186/s40035-017-0099-z
4. Deuschl G, Paschen S, Witt K. Clinical outcome of deep brain stimulation for parkinson’s disease. Handbook of Clinical Neurology. 2013;107–28. doi:10.1016/b978-0-444-53497-2.00010-3
5. Heo J-H, Lee K-M, Paek SH, Kim M-J, Lee J-Y, Kim J-Y, et al. The effects of bilateral subthalamic nucleus deep brain stimulation (STN DBS) on cognition in parkinson disease. Journal of the Neurological Sciences. 2008;273(1–2):19–24. doi:10.1016/j.jns.2008.06.010
6. Jakobs M, Fomenko A, Lozano AM, Kiening KL. Cellular, molecular, and clinical mechanisms of action of deep brain stimulation—a systematic review on established indications and outlook on future developments. EMBO Molecular Medicine. 2019;11(4). doi:10.15252/emmm.201809575
7. Kim Y, McGee S, Czeczor JK, Walker AJ, Kale RP, Kouzani AZ, et al. Nucleus accumbens deep-brain stimulation efficacy in ACTH-pretreated rats: Alterations in mitochondrial function relate to antidepressant-like effects. Translational Psychiatry. 2016;6(6). doi:10.1038/tp.2016.84
8. Hsieh T-H, Kuo C-W, Hsieh K-H, Shieh M-J, Peng C-W, Chen Y-C, et al. Probiotics alleviate the progressive deterioration of motor functions in a mouse model of parkinson’s disease. Brain Sciences. 2020;10(4):206. doi:10.3390/brainsci10040206
9. Leger M, Quiedeville A, Bouet V, Haelewyn B, Boulouard M, Schumann-Bard P, et al. Object recognition test in mice. Nature Protocols. 2013;8(12):2531–7. doi:10.1038/nprot.2013.155
10. Seibenhener ML, Wooten MC. Use of the open field maze to measure locomotor and anxiety-like behavior in mice. Journal of Visualized Experiments. 2015;(96). doi:10.3791/52434-v
11. Deacon RM, Rawlins JN. T-maze alternation in the rodent. Nature Protocols. 2006;1(1):7–12. doi:10.1038/nprot.2006.2
12. Ben-Shaul Y. OptiMouse: A comprehensive open source program for reliable detection and analysis of mouse body and nose positions. BMC Biology. 2017;15(1). doi:10.1186/s12915-017-0377-3
13. Papp EA, Leergaard TB, Calabrese E, Johnson GA, Bjaalie JG. Waxholm Space Atlas of the Sprague Dawley Rat Brain. NeuroImage. 2014;97:374–86. doi:10.1016/j.neuroimage.2014.04.001
14. Lai J-H, Chen K-Y, Wu JC-C, Olson L, Brené S, Huang C-Z, et al. Voluntary exercise delays progressive deterioration of markers of metabolism and behavior in a mouse model of parkinson’s disease. Brain Research. 2019;1720:146301. doi:10.1016/j.brainres.2019.146301
15. Luigjes J, van den Brink W, Feenstra M, van den Munckhof P, Schuurman PR, Schippers R, et al. Deep Brain Stimulation in addiction: A review of potential brain targets. Molecular Psychiatry. 2011;17(6):572–83. doi:10.1038/mp.2011.114
16. Nauczyciel C, Robic S, Dondaine T, Verin M, Robert G, Drapier D, et al. The nucleus accumbens: A target for deep brain stimulation in resistant major depressive disorder. Journal of Molecular Psychiatry. 2013;1(1). doi:10.1186/2049-9256-1-17
Figures
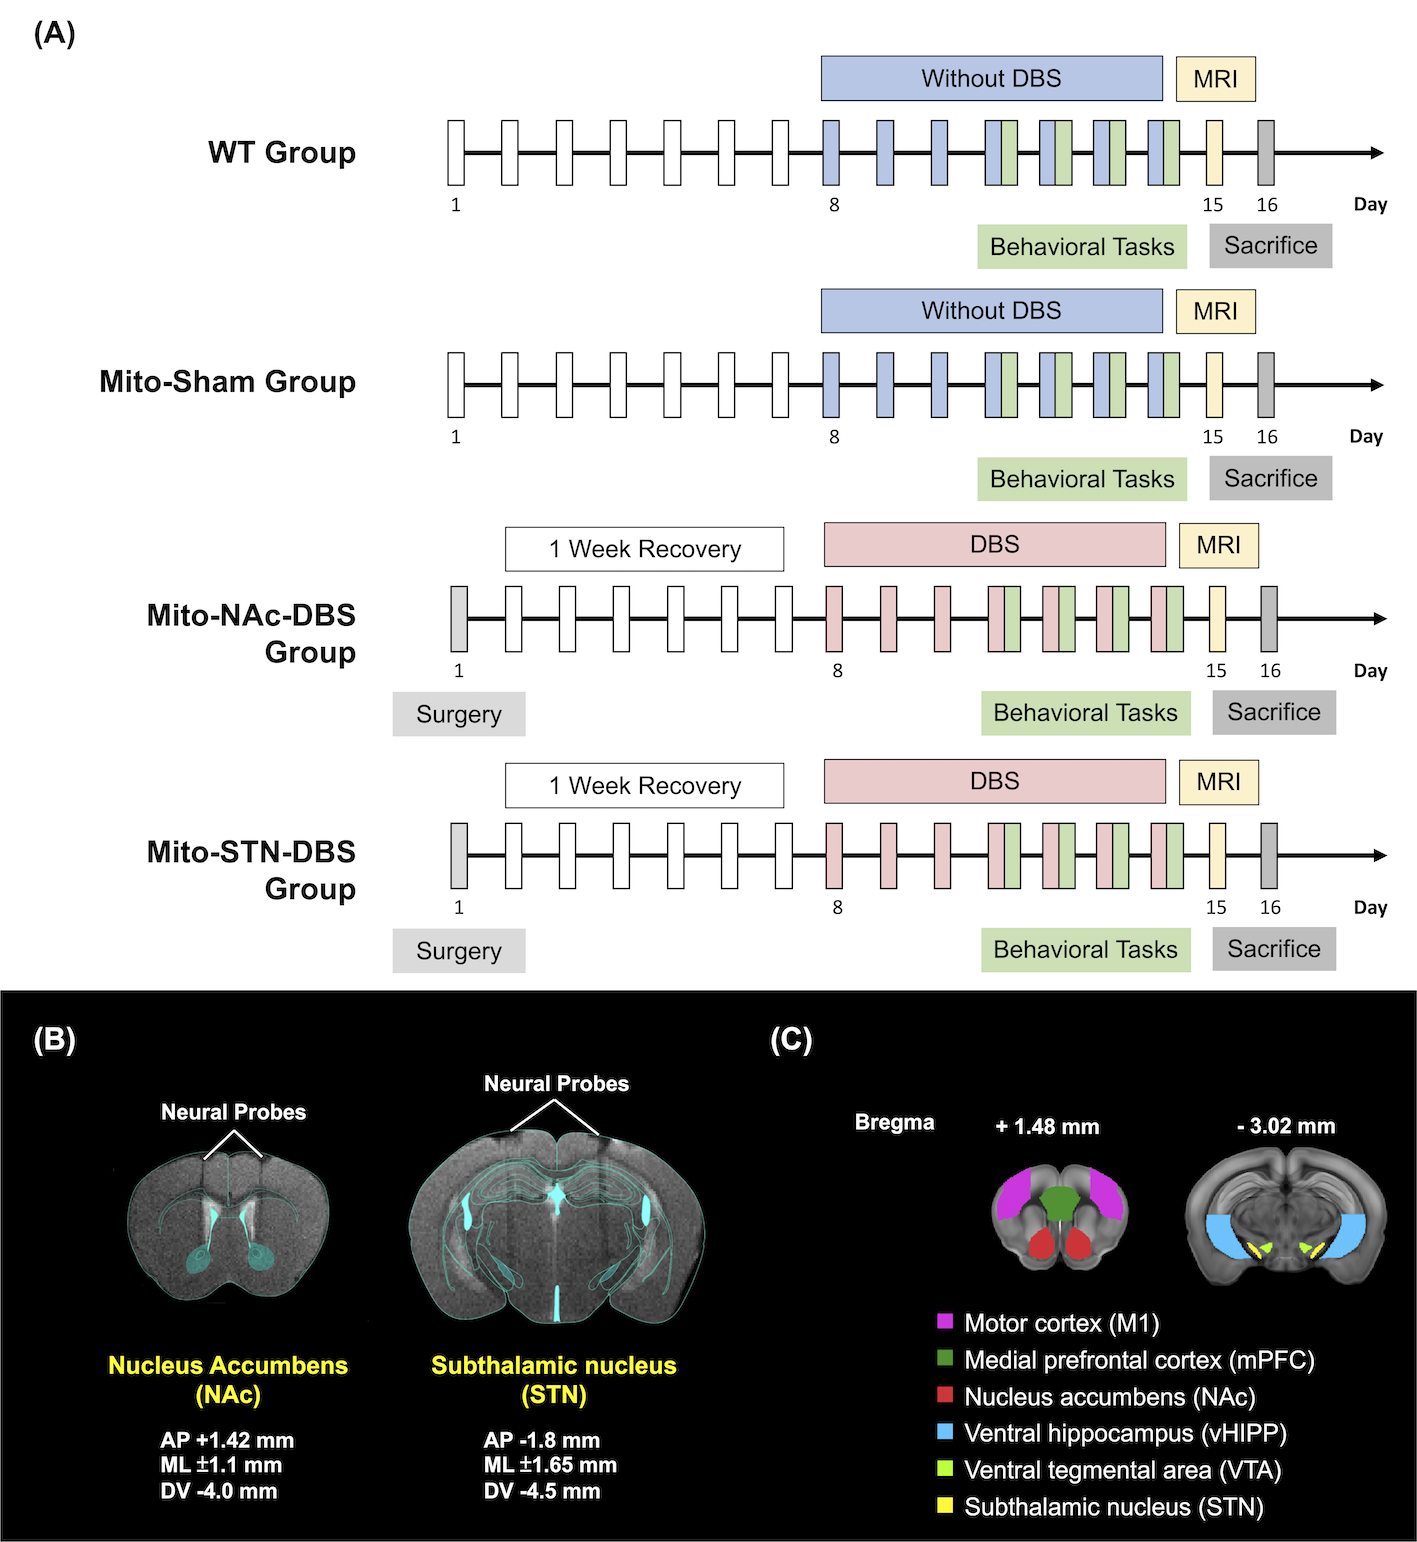
Figure 1. Experimental design. (A) Four groups, the WT group, Mito-Sham group, Mito-NAc-DBS group, and Mito-STN-DBS group, were conducted with bilateral probes implantations, behavioral tasks, MRI scan, and bioenergetic analysis. (N = 5, each group) (B) A T2-weighted image overlaid with a mouse brain atlas showed the tracks of the neural probes implanted into the bilateral NAc and STN. (C) ROIs include M1 (purple), mPFC (dark green), NAc (red), vHIPP (blue), VTA (light green), and STN (yellow).
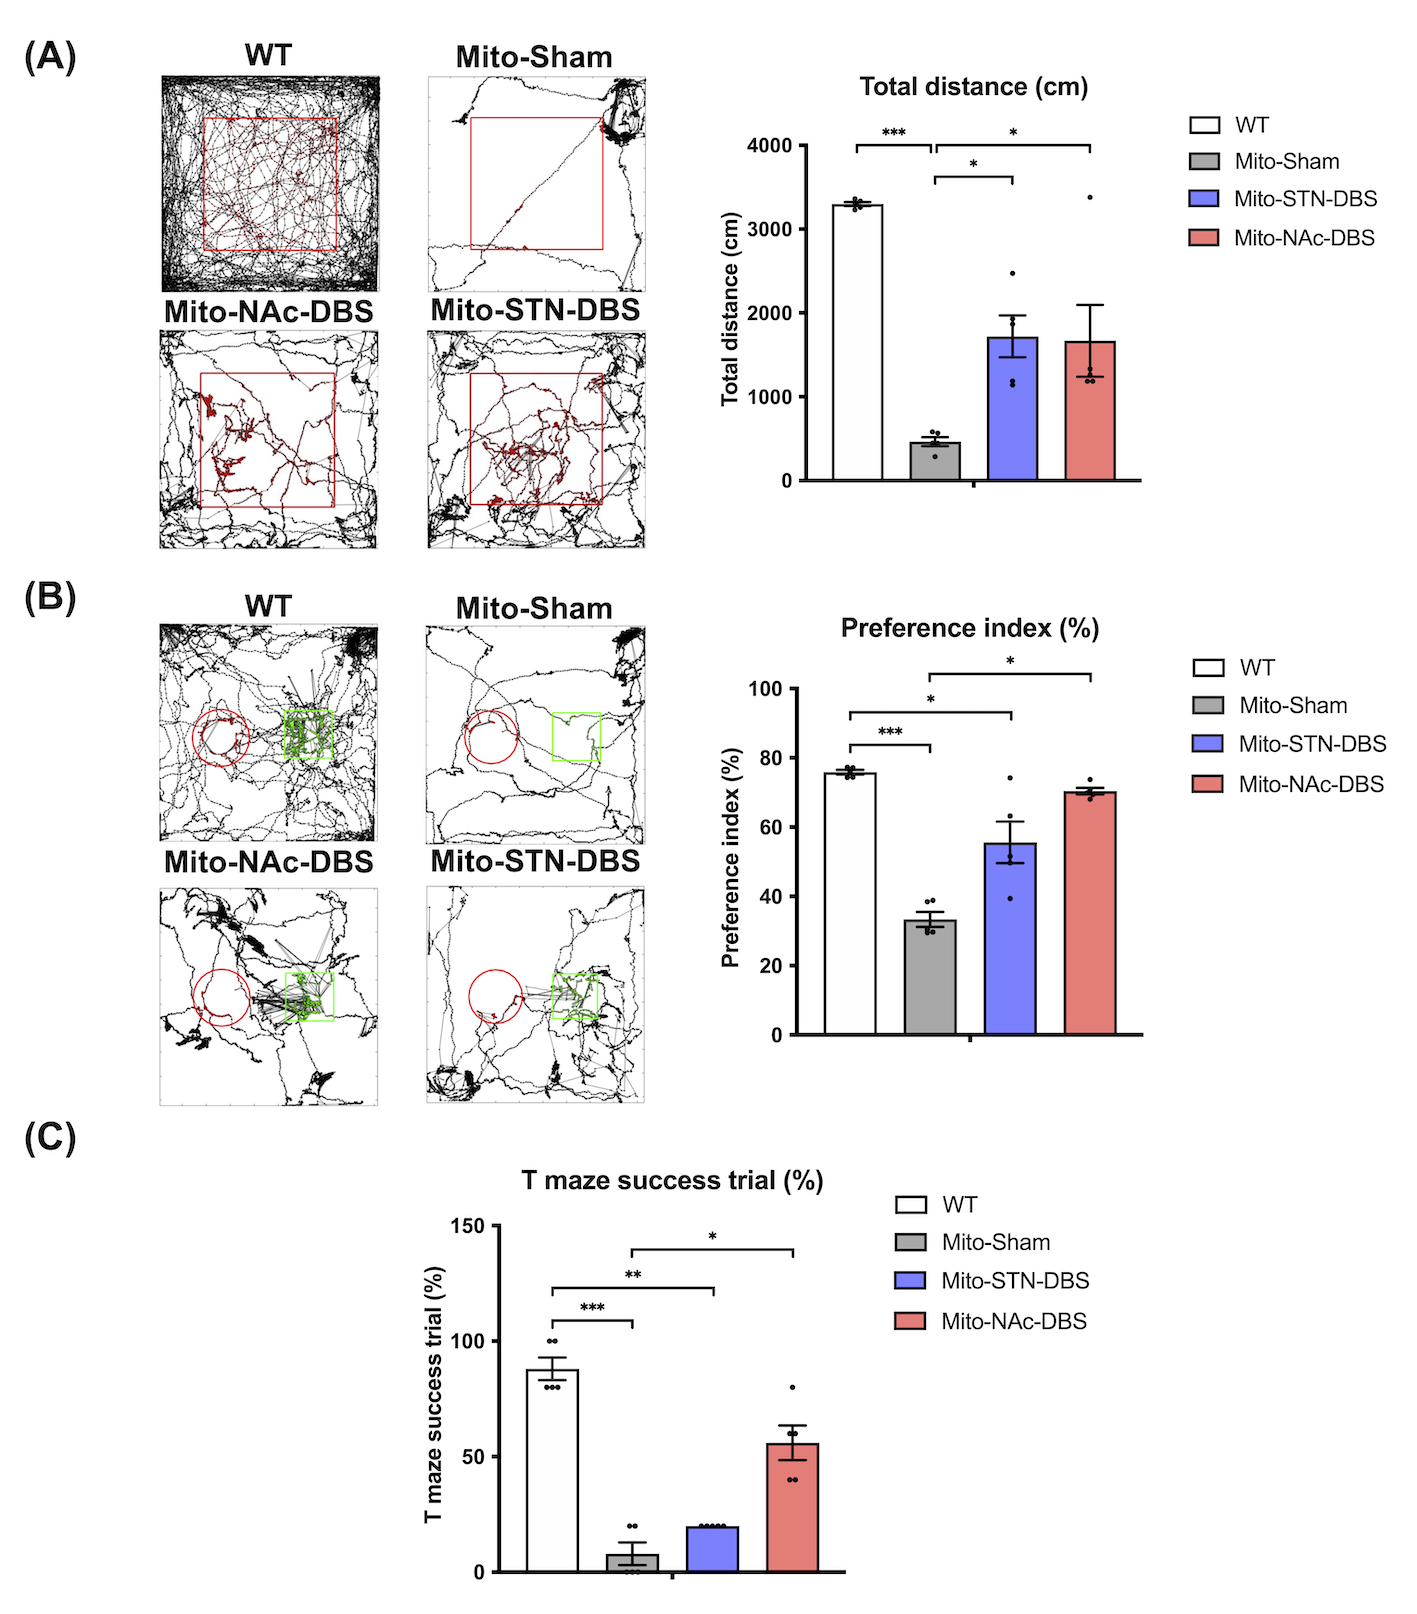
Figure 2. Behavioral tasks. (A) Tracks represent the route of the mouse, which showed declined moving distance in the Mito-Sham group, and both DBS treatments may increase locomotor activity. (red square, inner zone region) (B) In the NOR test, the Mito-Sham group showed a lower PI value than the WT group. After DBS, NAc-DBS performed a higher PI value than STN-DBS (red circle, familiar object; green square, novel object). (C) NAc-DBS showed a higher correct ratio than STN-DBS, recovering cognitive function. *: p < 0.05, **: p < 0.01
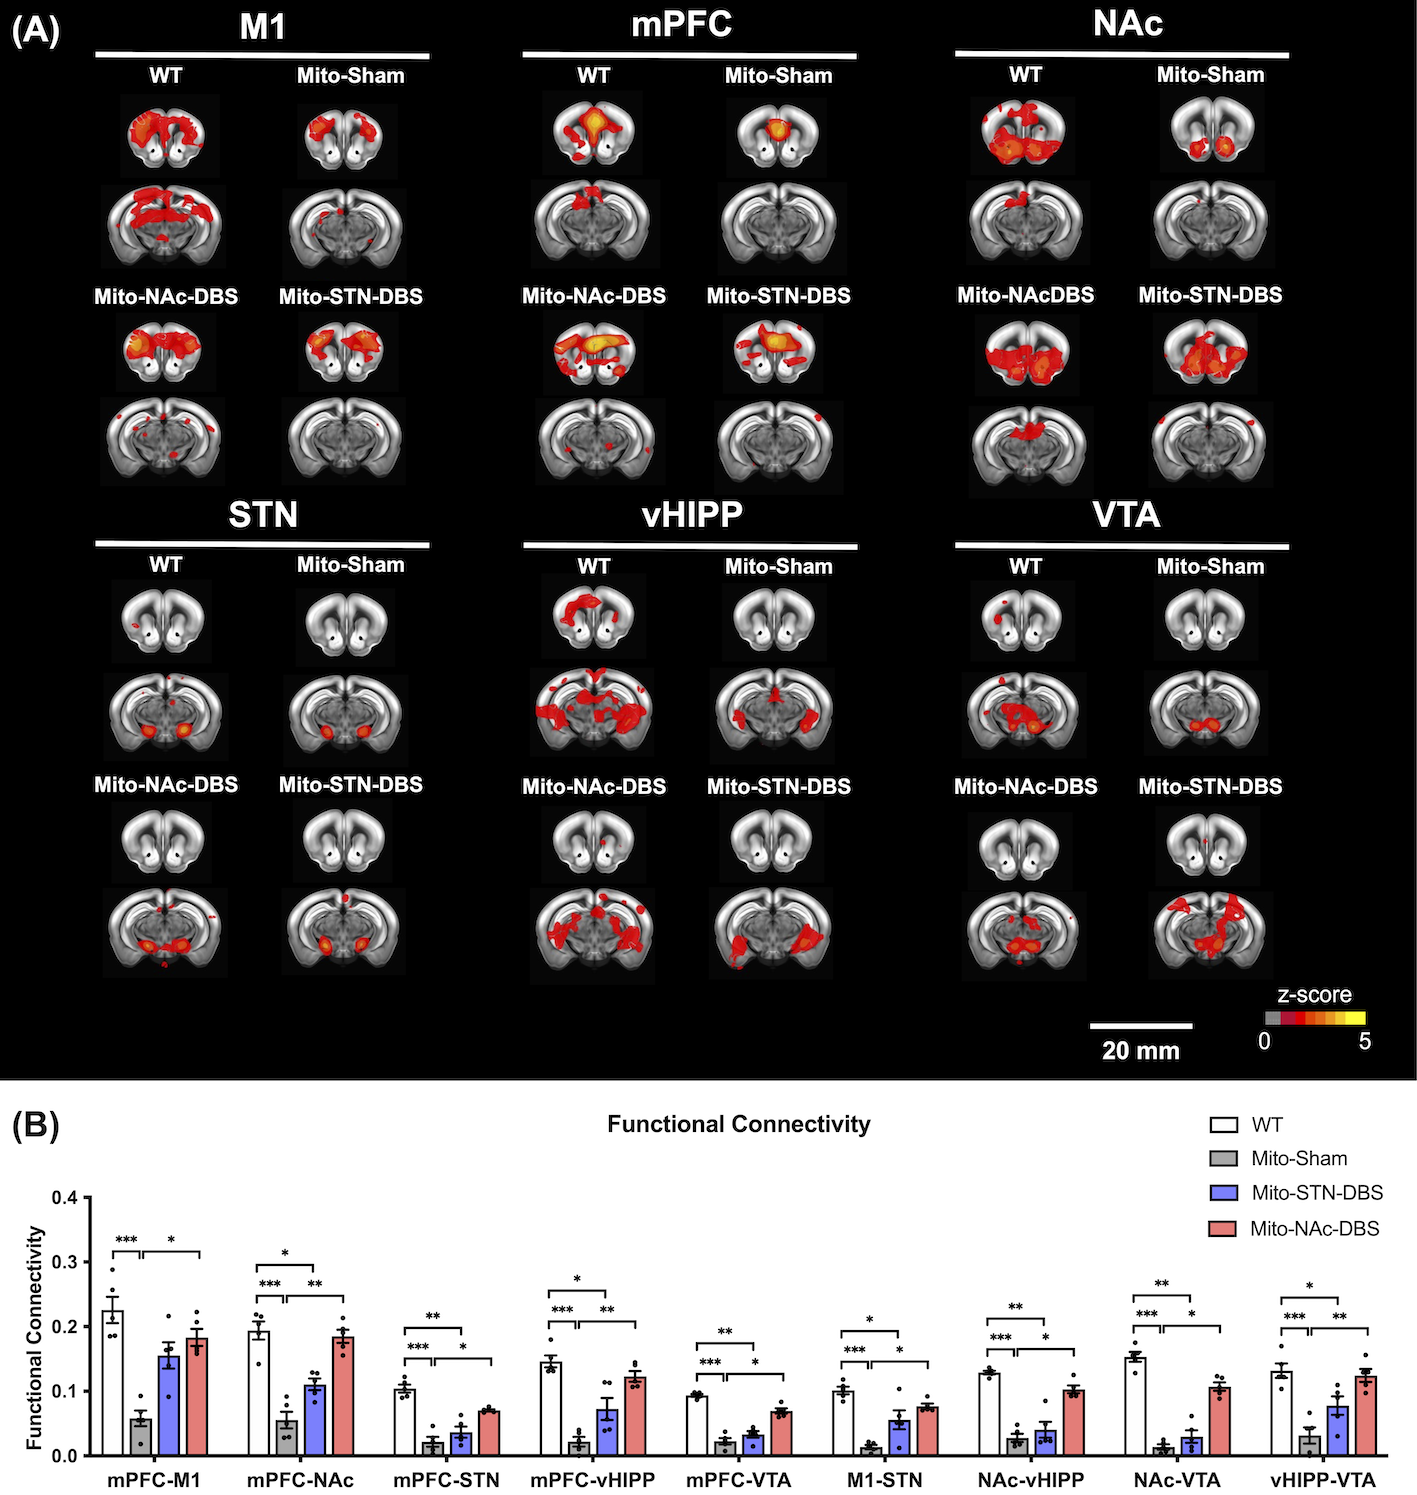
Figure 3. rsfMRI analysis. (A) The cross-correlation maps of each ROIs with whole brain voxels. (B) The Mito-Sham group showed decreased FC than the WT group. After NAc-DBS and STN-DBS, FC showed significant restoration compared with the Mito-Sham group. NAc-DBS showed higher FC values than STN-DBS *: p < 0.05; **: p < 0.01
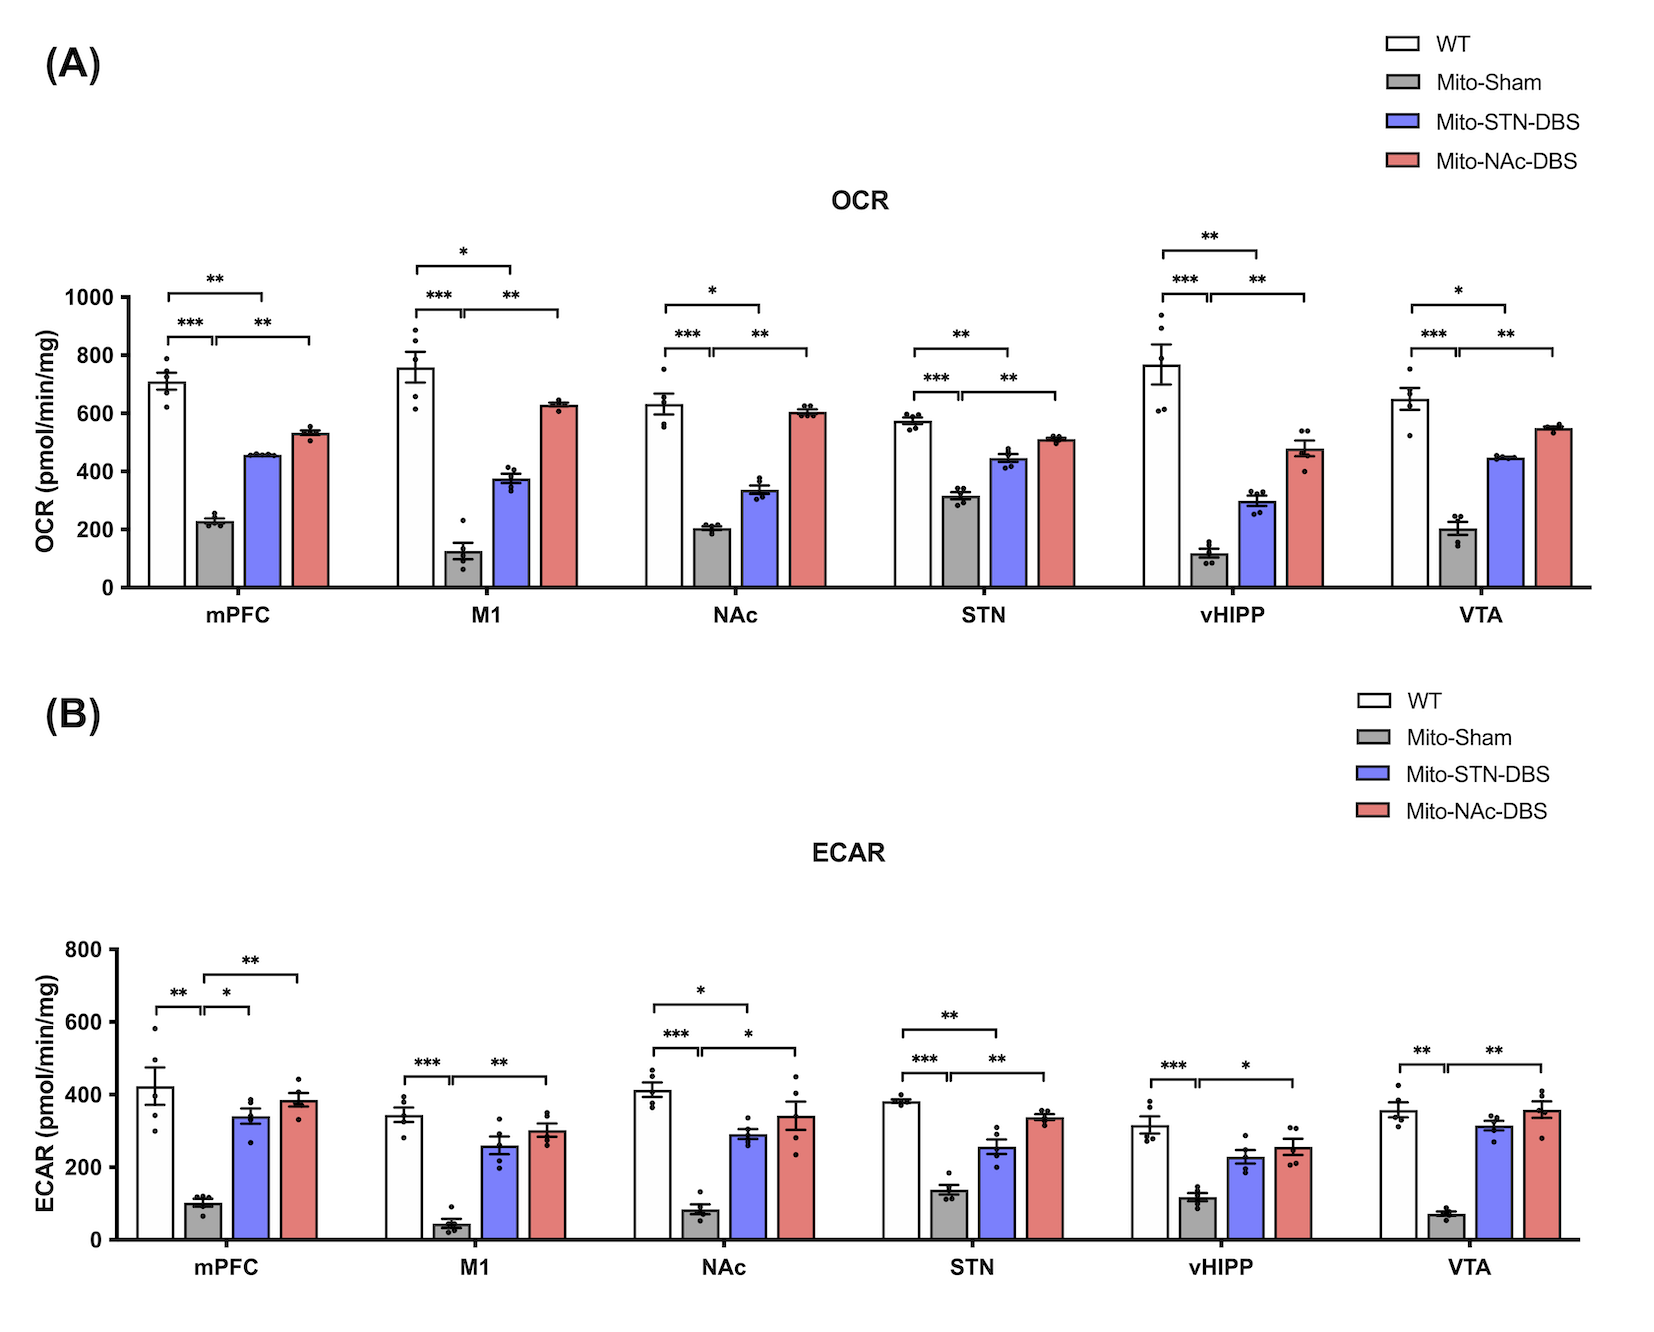
Figure 4. Bioenergetic analysis. (A) The Mito-Sham group showed lower OCR levels in ROIs than the WT group. Increased OCR level was found after NAc-DBS compared with the Mito-Sham group. (B) The Mito-Sham group showed decreased ECAR levels compared to the WT, the Mito-NAc-DBS group, and the Mito-STN-DBS group. *: p < 0.05; **: p < 0.01