3310
Gradient Echo Sampling of a Spin Echo (GESSE) linescans for human laminar fMRI at 7T: combining echoes to vary functional contrast and sensitivity1Harvard Medical School, Boston, MA, United States, 2Boston Children's Hospital, Boston, MA, United States, 3Athinoula A. Martinos Center for Biomedical Imaging, Massachusetts General Hospital, Charlestown, MA, United States, 4Department of Physics, Carleton University, Ottawa, ON, Canada, 5University of Ottawa Institute of Mental Health Research, Ottawa, ON, Canada, 6Department of Biomedical Engineering, Case Western Reserve University, Cleveland, OH, United States, 7Australian Institute for Bioengineering and Nanotechnology, University of Queensland, St Lucia, Australia, 8Harvard-MIT Division of Health Sciences and Technology, Massachusetts Institute of Technology, Cambridge, MA, United States
Synopsis
Keywords: fMRI Acquisition, High-Field MRI, Laminar fMRI, High-resolution fMRI
Motivation: Resolving distinct functional activation and connectivity within cerebral cortical layers requires high imaging resolutions and microvascular specificity along with sufficient sensitivity—a major challenge for current fMRI methodologies.
Goal(s): To measure capillary-weighted spin-echo-BOLD fMRI signals in human cerebral cortex, with 500-micron resolution in the radial direction (i.e., perpendicular to the cortical surface).
Approach: We used a novel “linescan” technique that samples a single spin echo with multiple gradient echoes.
Results: We provide the first demonstration of T2-weighted BOLD activation via linescan fMRI in humans and show that the multiple gradient echoes can be combined in various ways to manipulate functional contrast and sensitivity.
Impact: Our novel LS-GESSE technique allows for controlled trade-offs between sensitivity and specificity and should help enable the measurement of microvascular fMRI signals at spatial resolutions approaching the thickness of individual cortical layers, facilitating noninvasive studies of cortical dynamics and circuitry.
Introduction
Resolving distinct functional activation and connectivity within cerebral cortical layers requires high imaging resolutions and microvascular specificity along with sufficient sensitivity. In principle, spin-echo (SE) BOLD can provide weighting towards capillaries1–5, however in practice SE-EPI exhibits unwanted T2′ contamination6–8 and has voxel sizes well above the scale of cortical layers. Here we propose a linescan9–11 approach that addresses these issues, with ultra-high in-line resolution and short readouts that minimize T2′ contamination in the SE12–14 but that also incorporates multiple gradient echoes15,16 (GEs) that can be combined in various ways to manipulate functional contrast, and balance sensitivity and specificity17. This novel “LS-GESSE” approach provides an alternative to current GE-based linescan fMRI techniques18–22.Methods
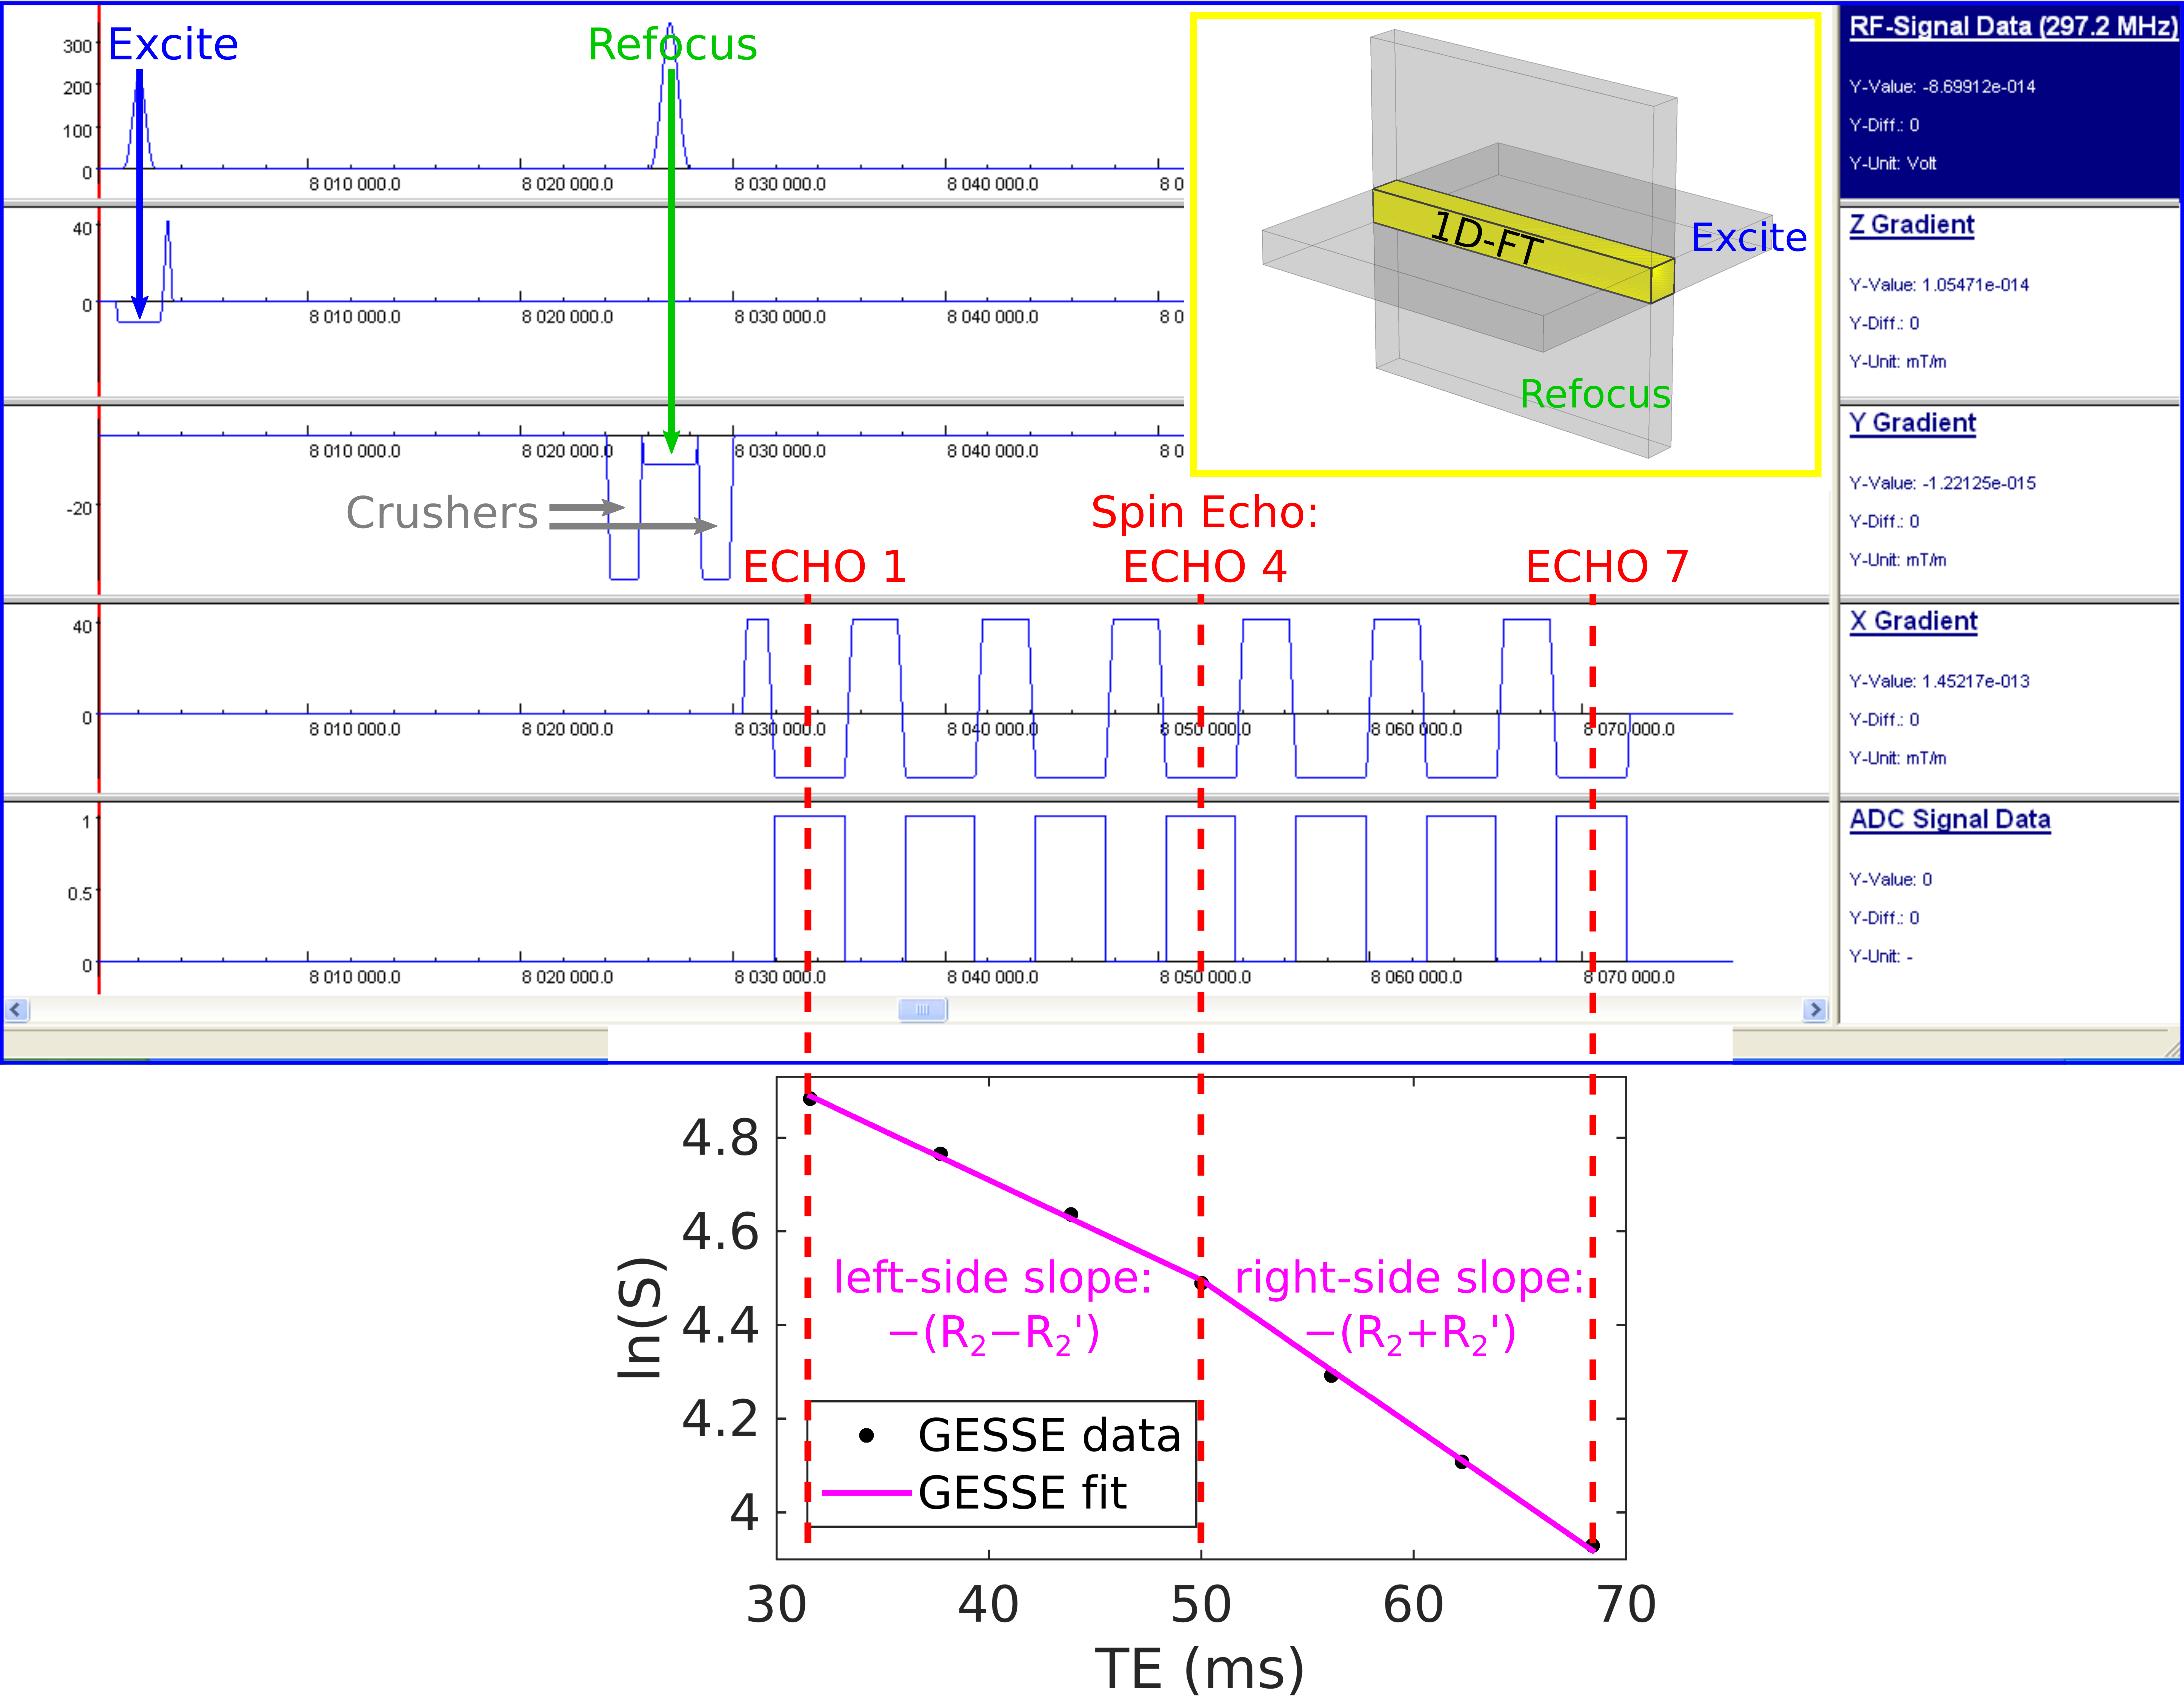
Fig. 1 shows the pulse sequence diagram for LS-GESSE16, with the resulting signals governed byS(t) = S0 exp( −R2 (t + τ) ) exp( −R2′|t − τ|) (1)
where τ is the time between the excitation and refocusing pulses, t is the time after the refocusing pulse, S0 includes the T1-weighted steady-state magnetization, and R2=1/T2 and R2′=1/T2′ are the irreversible and reversible transverse relaxation rates, respectively15,23,24.
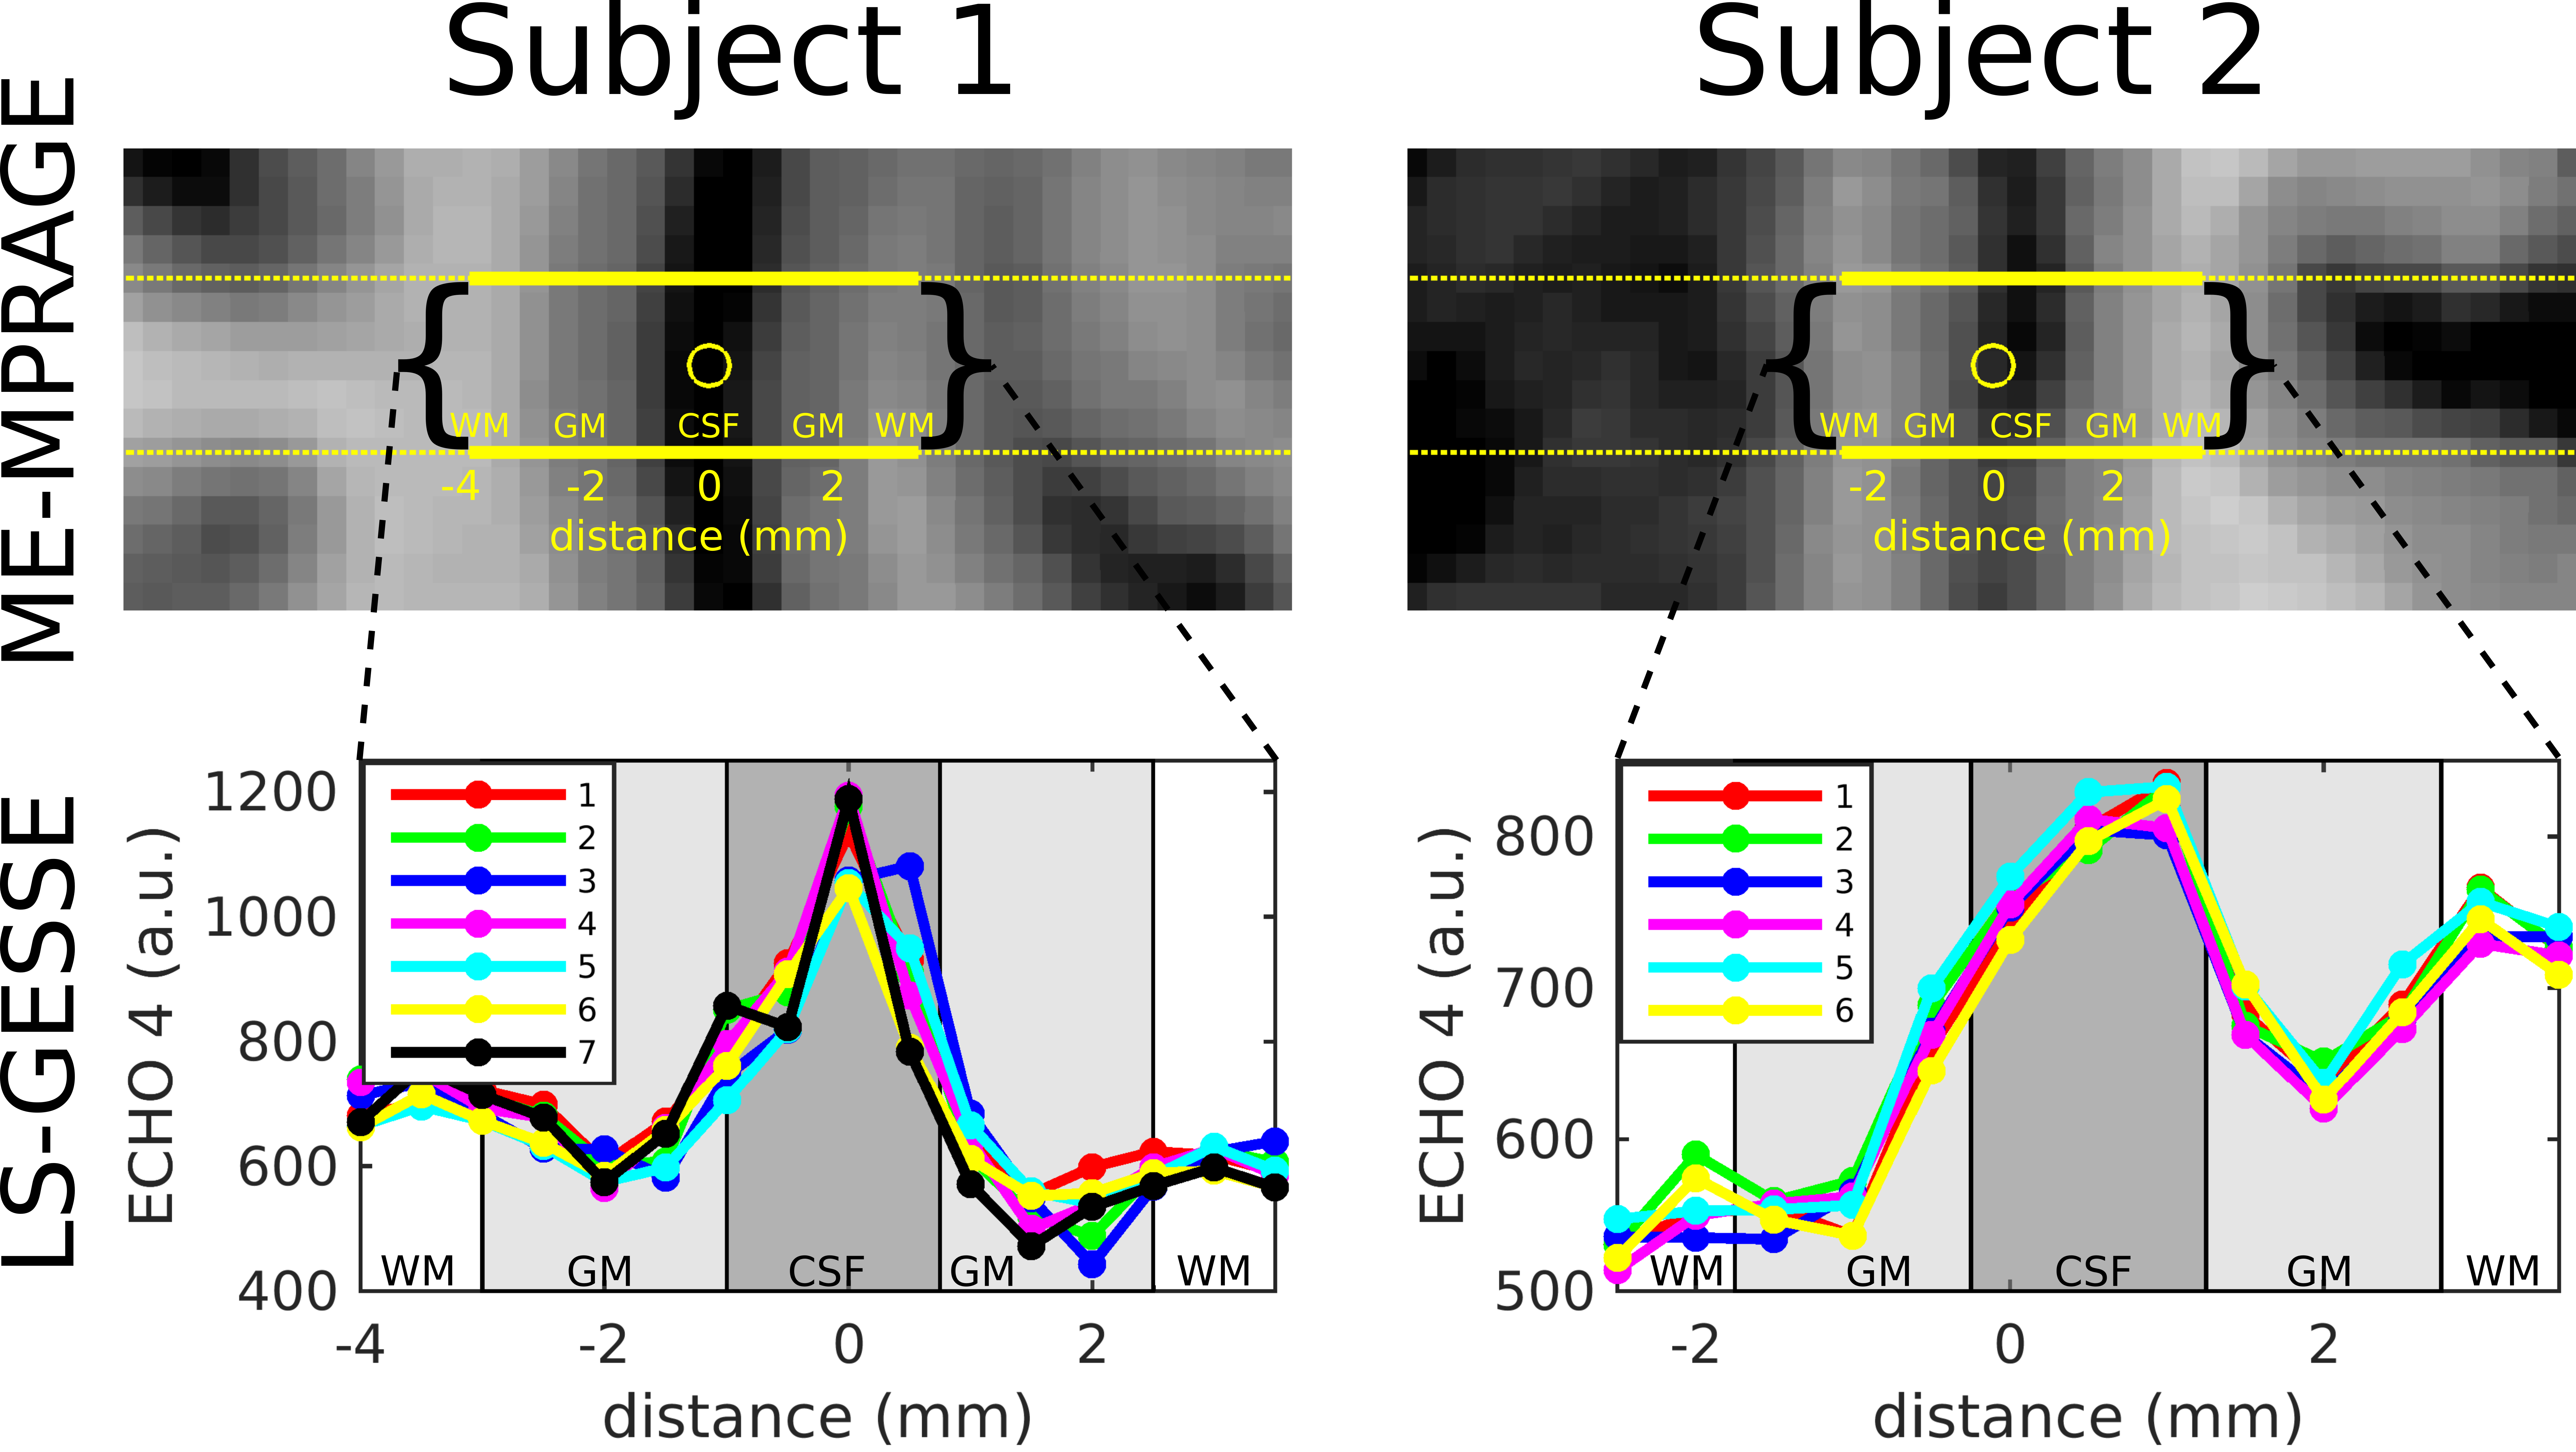
Two healthy volunteers (1F/1M, ages: 24–47 years), having given informed consent, were scanned on a Siemens Terra 7T scanner using an in-house-built 64-channel receive and birdcage-transmit head coil25. A 1×1×1 mm3 ME-MPRAGE scan26 was used to localize subsequent linescans, where a single line was prescribed perpendicularly to V1 (Fig. 2).
For each subject, 6-7 LS-GESSE fMRI runs were acquired with the following parameters: FAExcite = 90°, TR = 2 s, 135 TRs, 7 unipolar gradient echoes with the 4th gradient echo coinciding with the spin echo at TE = 50 ms (BW = 257 Hz/px). The voxel size along the line was 0.5 mm with a nominal line thickness of 3 mm.
For each run, a standard flashing “checkerboard” visual stimulus was presented in a block-design paradigm (six blocks of 16-s ON + 24-s OFF). Data were analyzed with a conventional GLM and canonical HRF and the runs were averaged with a fixed-effect analysis.
Results
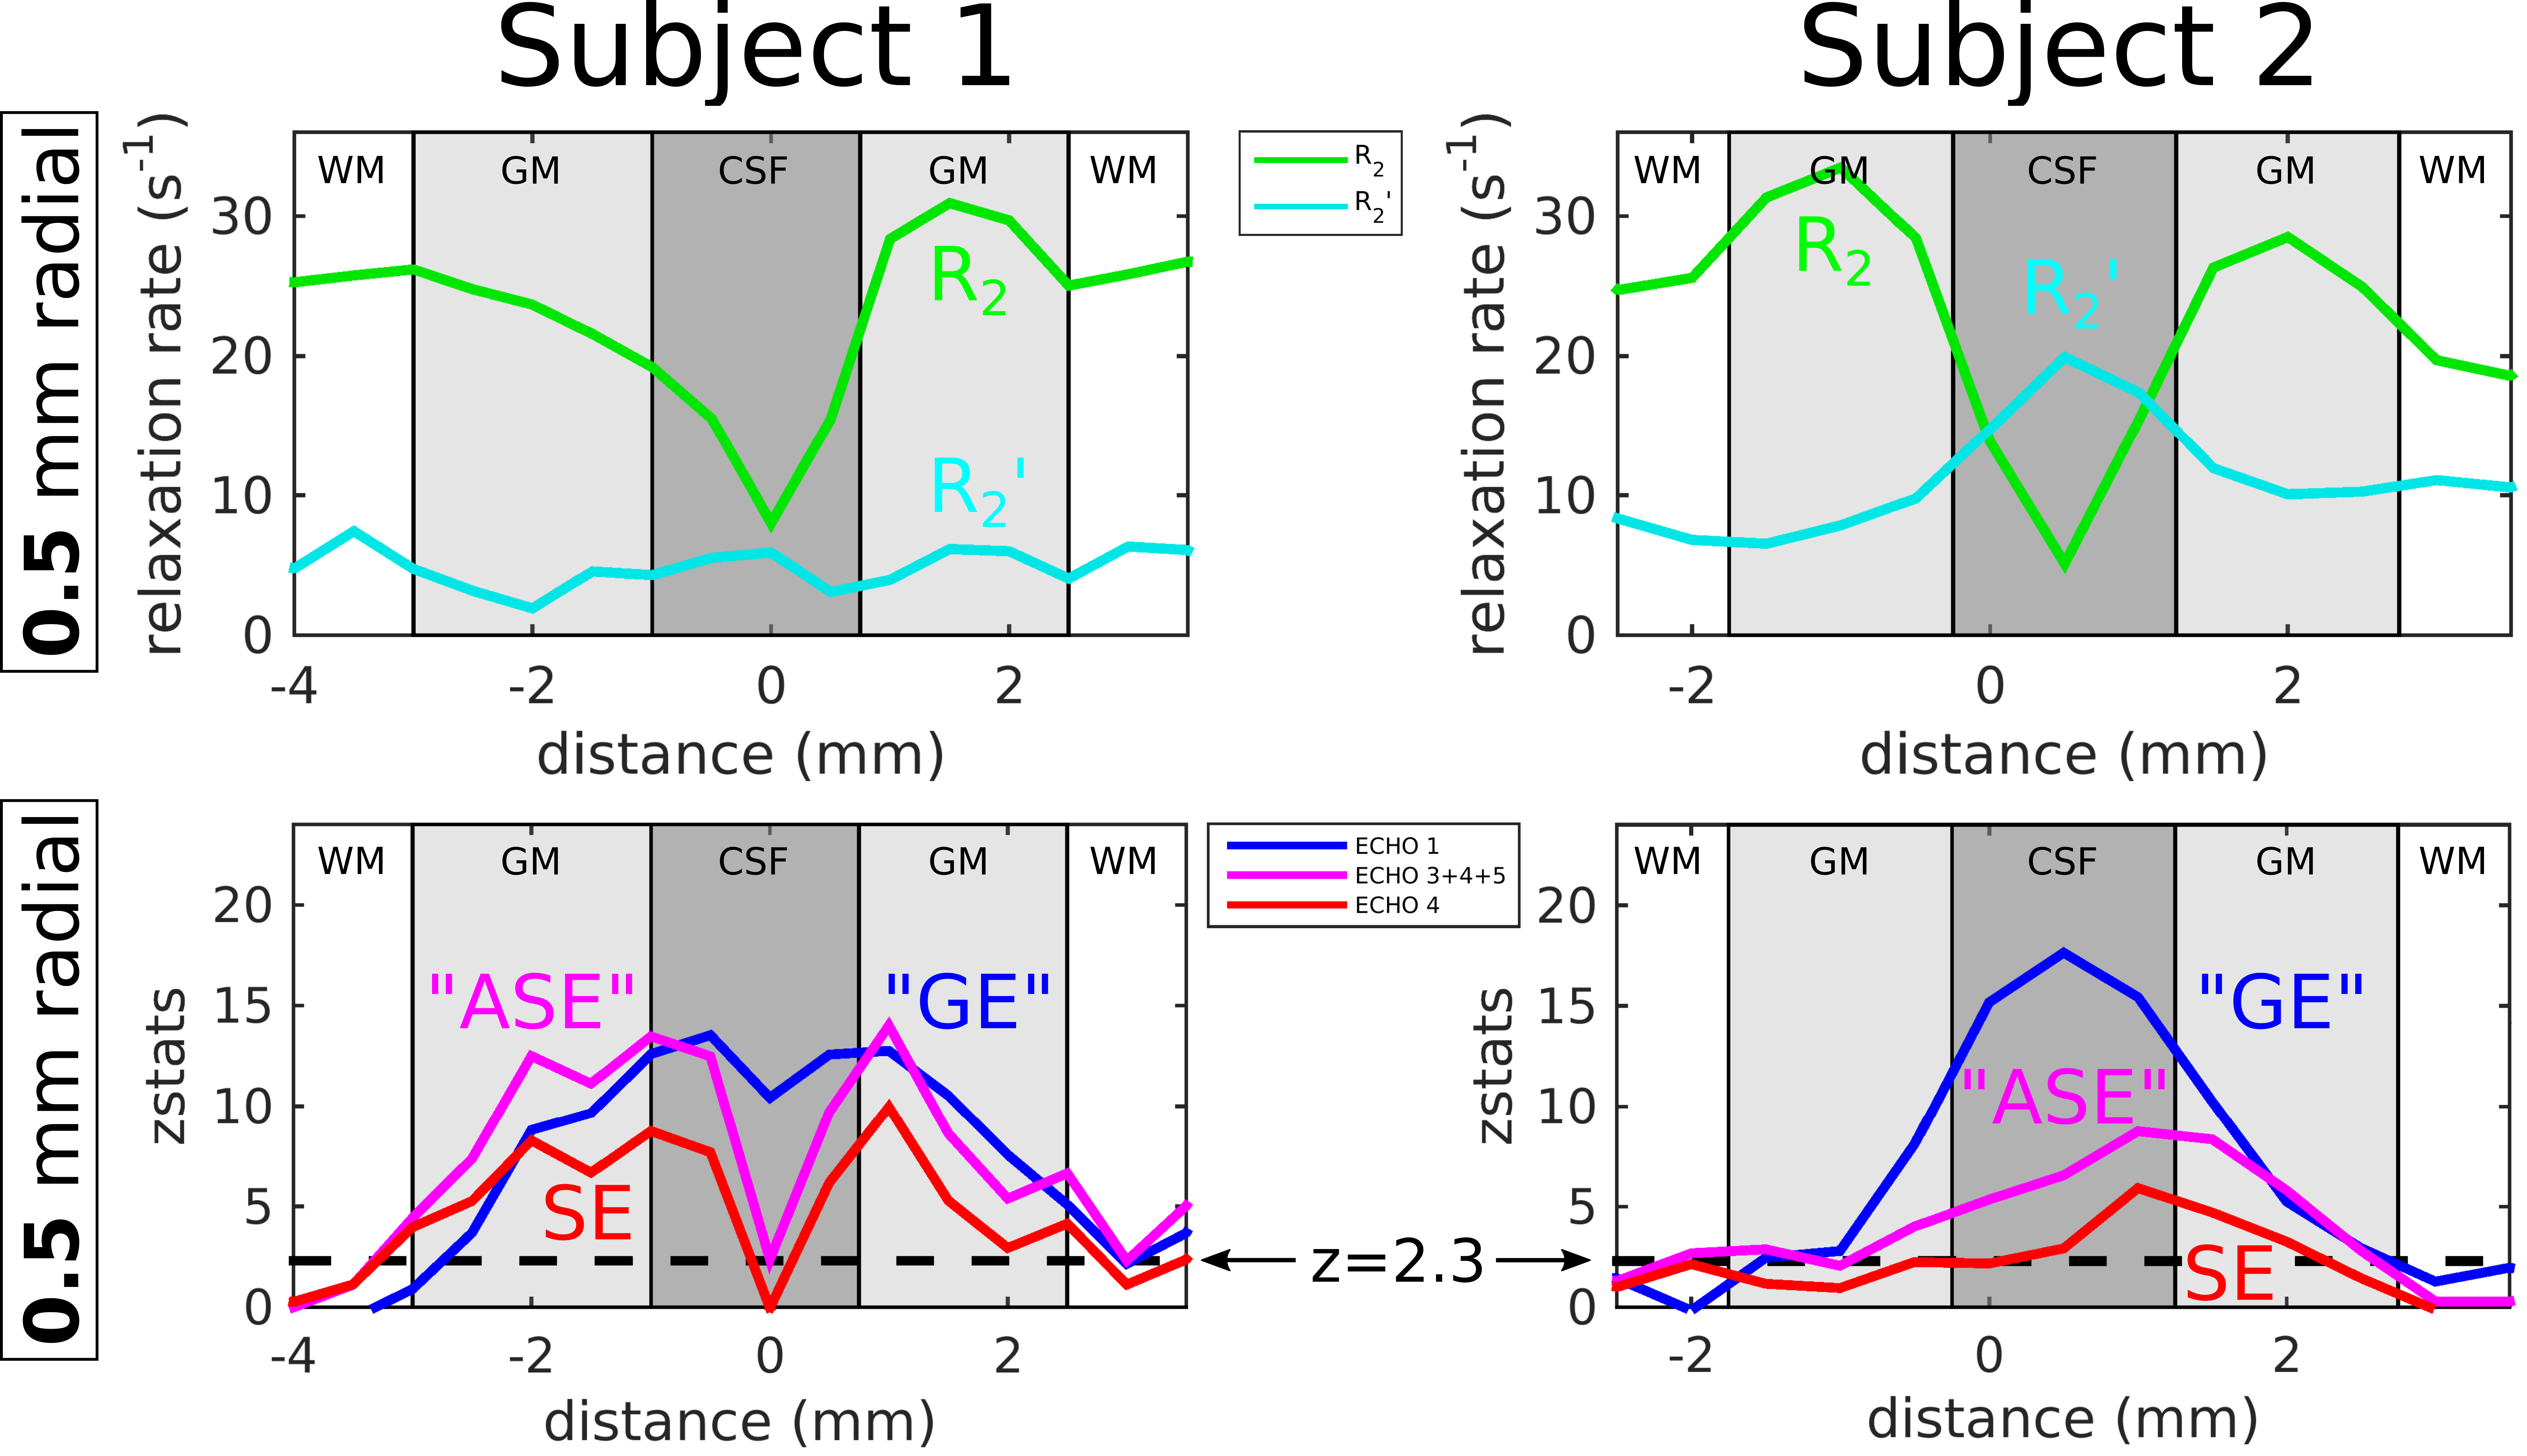
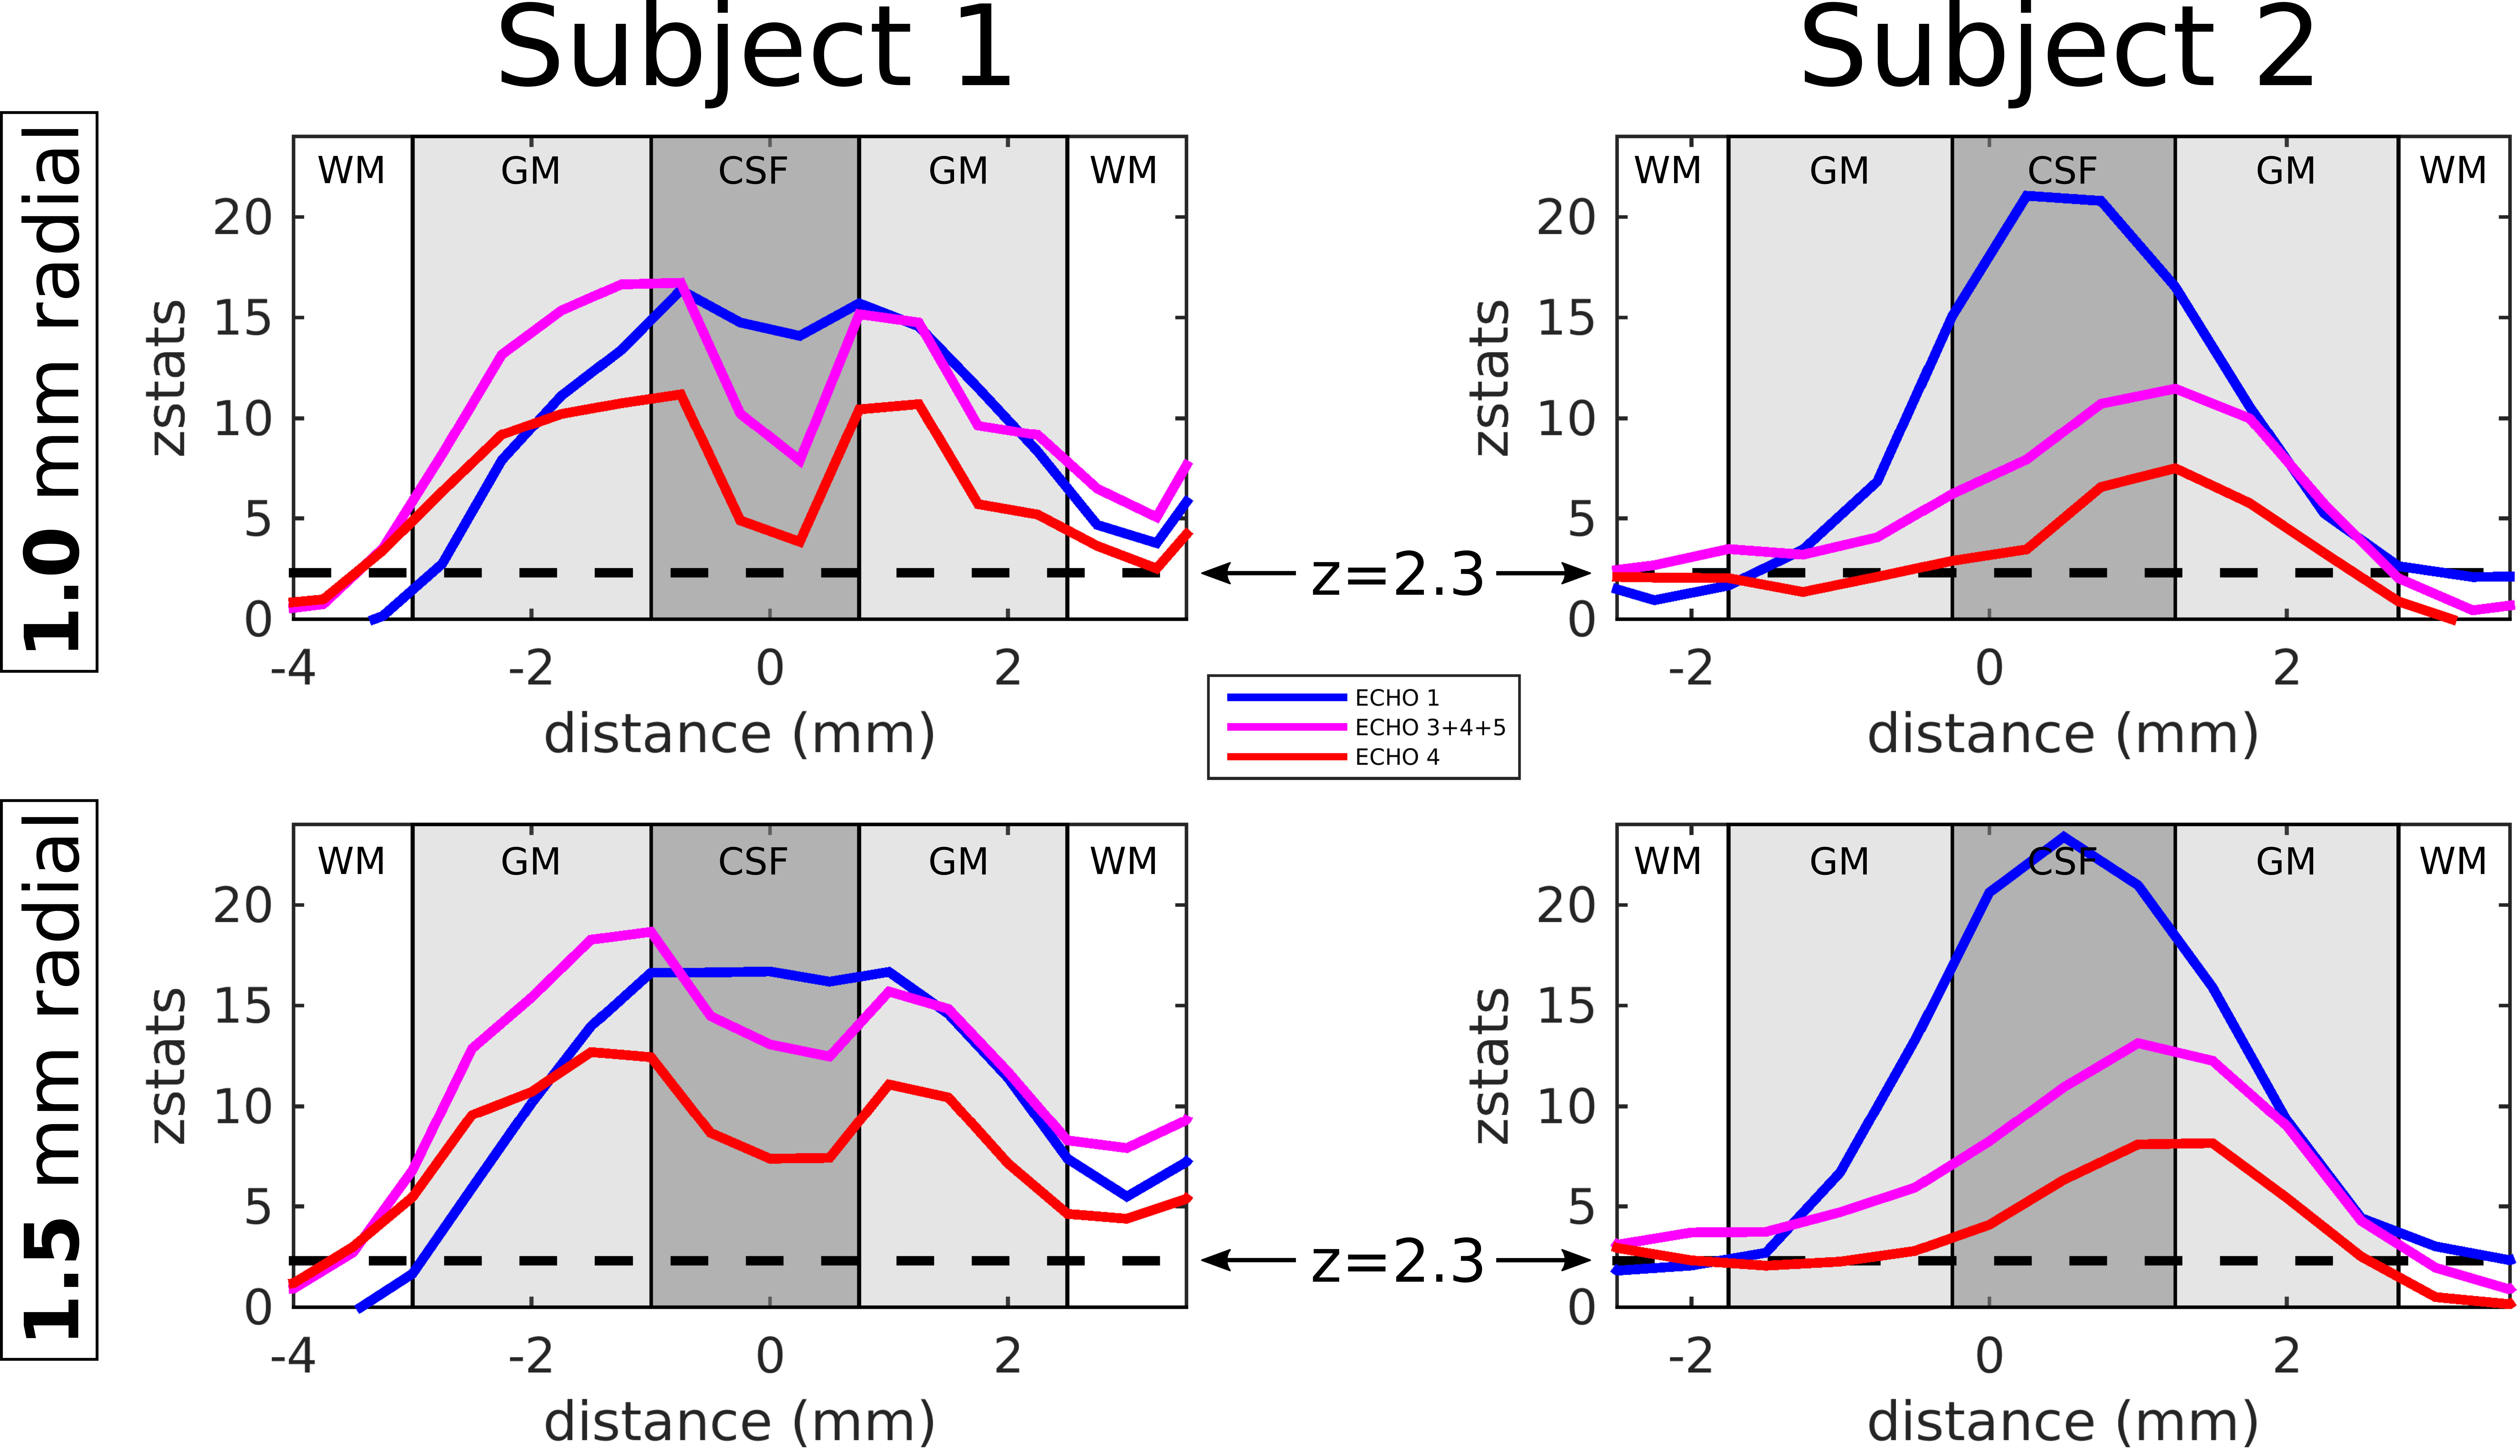
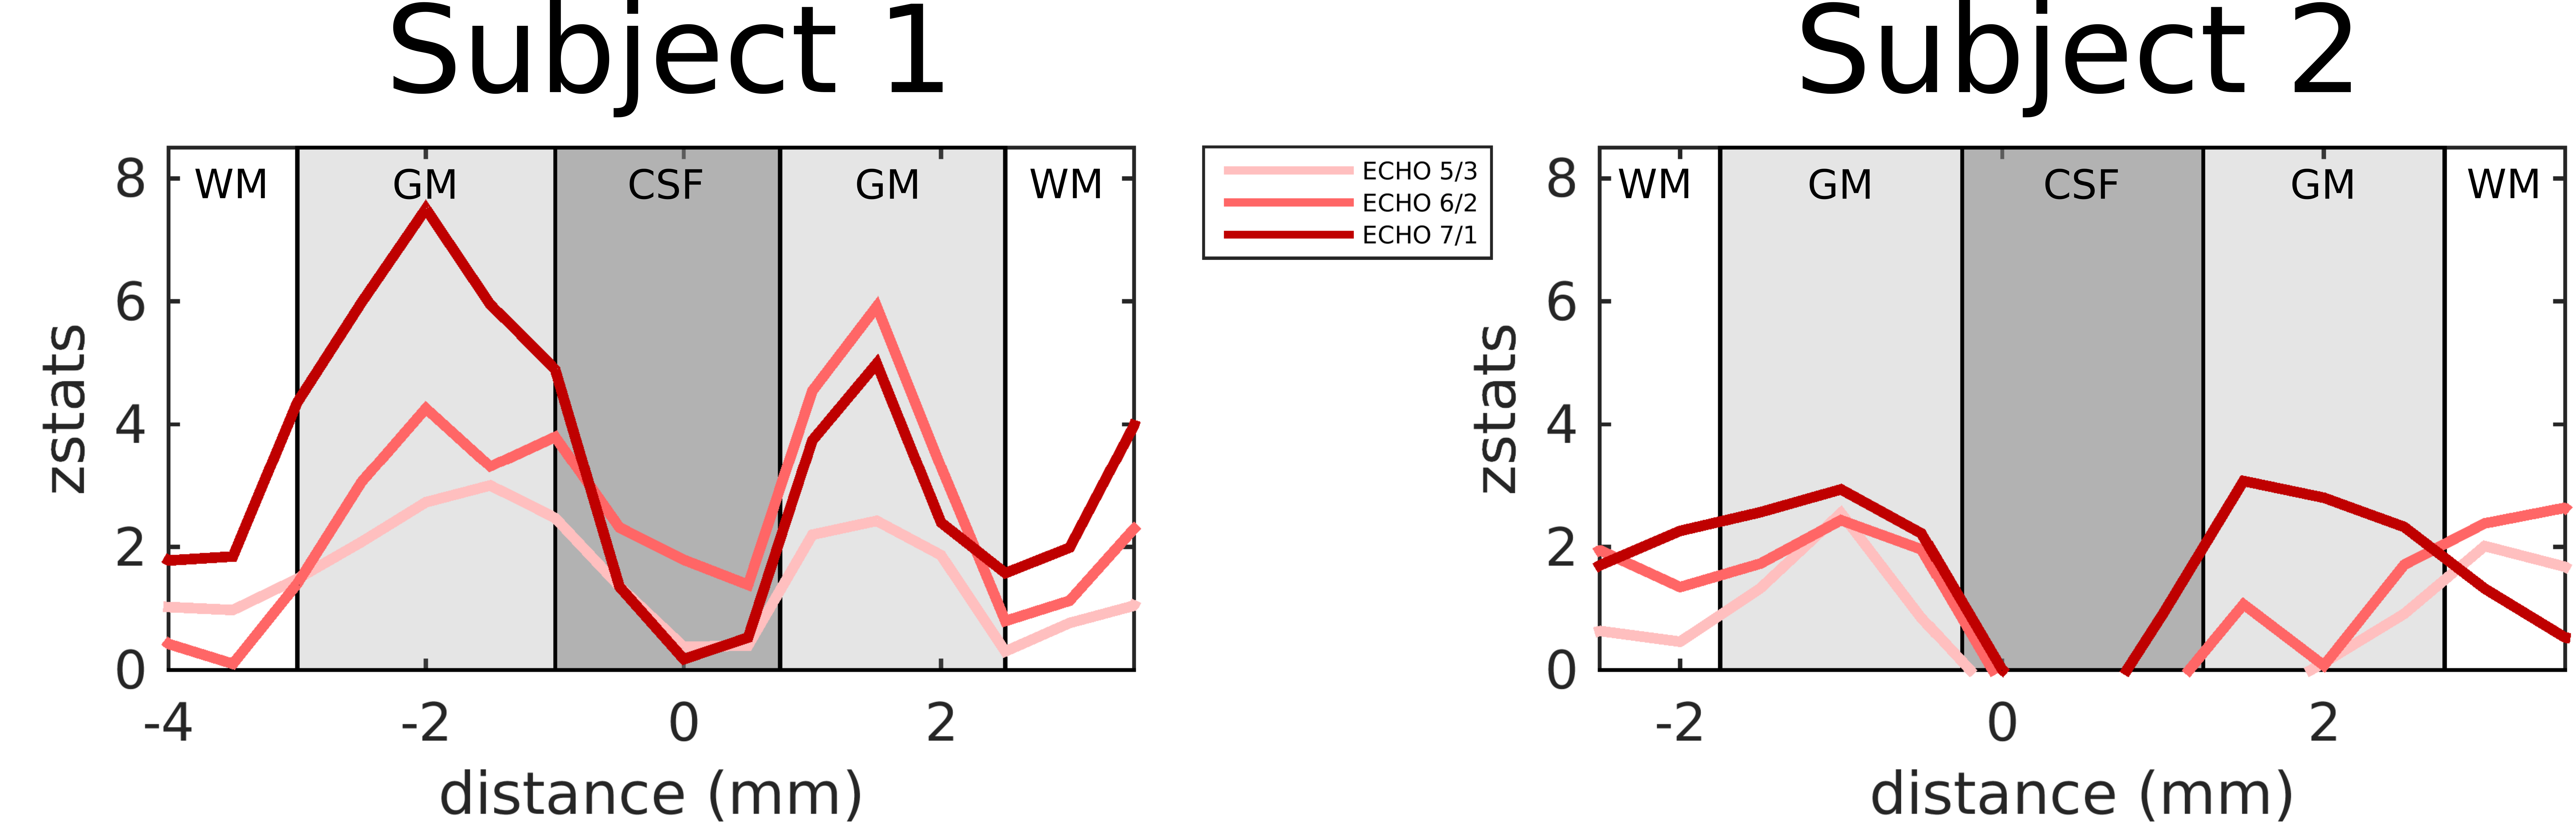
The top panel of Fig. 3 shows R2 and R2′ values versus position along the line, with similar cortical profiles to those seen in our prior anatomical study16, and the bottom panel shows the corresponding fMRI z-statistics. Robust activation is seen in Echo 1, which is the most like a gradient-echo acquisition, having approximately equal R2 and R2′ weighting17, with the z-statistics increasing from WM to the pial surface. Note the large peak in z-statistics within CSF in Subject 2 which, together with the R2′ peak shown above it, suggests the proximity of a large pial vein. Lower z-statistics are seen within cortex for the spin echo (Echo 4) however the values within CSF are far lower, indicating a marked reduction in macrovascular bias. Summing the signals from Echoes 3–5 introduces a controlled amount of R2′ weighting, similar to Asymmetric Spin Echo (ASE) fMRI27–29, increasing the z-statistics in GM relative to Echo 4, but without much of an increase in CSF, i.e., incurring only a small loss of specificity. Other linear combinations of the echoes are of course possible, and the amount of R2′ weighting can therefore be carefully “titrated” to achieve the desired sensitivity.Fig. 4 shows the result of smoothing the signals along the line, to facilitate comparison with signals obtained with typical EPI resolutions.
Fig. 5 shows z-statistics derived from taking the ratio of echoes “equidistant” from the spin echo, eliminating both the R2′ and the T1-weighted S0 contribution to the signal (see Eq. 1), resulting in intracortical peaks in both subjects.
Discussion
Although we have illustrated two particular ideas for combining echoes in a LS-GESSE laminar fMRI study (i.e., linear weightings and ratios), other combinations are possible: for multi-gradient-echo T2*-weighted fMRI signals, several strategies have been proposed21,30–35; these ideas could be adapted to LS-GESSE signals but with the presence of the refocusing RF pulse adding an extra dimension, allowing T2* to be separated into its reversible (T2′) and irreversible (T2) components.While we have shown the first demonstration of T2-weighted BOLD activation via linescan fMRI in humans, we used a radial resolution of 0.5 mm and a temporal resolution of 2 seconds here. Our longer-term goal is to push these resolutions to ~0.25 mm and ~300 ms, respectively. For a similar spatiotemporal resolution, Raimondo et al.12 failed to detect SE-BOLD activation in their single-echo linescan study. The ideas presented here, utilizing multiple echoes to increase sensitivity in a controlled manner, should help enable the measurement of SE-BOLD activations at these extremely high resolutions.
Acknowledgements
We thank Estee Perelgut, Sarah Richter and Kyle Droppa for their help with subject recruitment and MRI scanning support, Azma Mareyam for 7T hardware support, and Drs. Andre van der Kouwe, Robert Frost, Paul Wighton and Dylan Tisdall for helpful discussions. This work was supported in part by the NIH NIBIB (grants P41-EB030006, R01-EB019437 and R01-EB032746), by the BRAIN Initiative (NIH NIMH grant R01-MH111419 and NIH NINDS grant U19-NS123717), by ARC Future fellowship grant FT200100329 and by the MGH/HST Athinoula A. Martinos Center for Biomedical Imaging; and was made possible by the resources provided by NIH Shared Instrumentation Grants S10-OD023637.References
1. Ogawa S, Menon RS, Tank DW, et al. Functional brain mapping by blood oxygenation level-dependent contrast magnetic resonance imaging. A comparison of signal characteristics with a biophysical model. Biophys J. 1993;64(3):803-812. doi:10.1016/S0006-3495(93)81441-3
2. Boxerman JL, Hamberg LM, Rosen BR, Weisskoff RM. MR contrast due to intravascular magnetic susceptibility perturbations. Magn Reson Med. 1995;34(4):555-566.
3. Bandettini PA, Wong EC. Effects of biophysical and physiologic parameters on brain activation‐induced R 2 * and R 2 changes: Simulations using a deterministic diffusion model. Int J Imaging Syst Technol. 1995;6(2-3):133-152. doi:10.1002/ima.1850060203
4. Norris DG. Spin-echo fMRI: The poor relation? Neuroimage. 2012;62(2):1109-1115. doi:10.1016/j.neuroimage.2012.01.003
5. Koopmans PJ, Yacoub E. Strategies and prospects for cortical depth dependent T2 and T2* weighted BOLD fMRI studies. Neuroimage. 2019;197:668-676. doi:10.1016/j.neuroimage.2019.03.024
6. Birn R, Bandettini P. The effect of T2’ changes on spin-echo EPI-derived brain activation maps. Proc Intl Soc Mag Reson Med. 2002;10:1324. http://cds.ismrm.org/ismrm-2002/PDF5/1324.PDF. Accessed November 3, 2023.
7. Duyn J. Specificity of high‐resolution BOLD and CBF fMRI at 7 T. Magn Reson Med. 2004;51(3):644-645. doi:10.1002/mrm.20040
8. Goense JBM, Logothetis NK. Laminar specificity in monkey V1 using high-resolution SE-fMRI. Magn Reson Imaging. 2006;24(4):381-392. doi:10.1016/j.mri.2005.12.032
9. Mansfield P, Maudsley AA. Line scan proton spin imaging in biological structures by NMR. Phys Med Biol. 1976;21(5):847-852. doi:10.1088/0031-9155/21/5/013
10. Maudsley AA. Multiple-line-scanning spin density imaging. J Magn Reson. 1980;41(1):112-126.
11. Crooks LE. Selective irradiation line scan techniques for NMR imaging. IEEE Trans Nucl Sci. 1980;27(3):1239-1244.
12. Raimondo L, Heij J, Knapen T, Dumoulin SO, van der Zwaag W, Siero JCW. Towards functional spin-echo BOLD line-scanning in humans at 7T. MAGMA. 2023;36(2):317-327. doi:10.1007/s10334-022-01059-7
13. Choi S, Hike D, Pohmann R, Avdievich N, Scheffler K, Yu X. Alpha-180 spin-echo based line-scanning method for high resolution laminar-specific fMRI. bioRxiv. 2023. doi:doi:10.1101/2023.05.09.540065
14. Choi S, Yu X, Scheffler K, Herz K. Simultaneous acquisition of GRE- and SE-type resting-state fMRI signals with GRASE-based line-scanning in the human brain. Proc Intl Soc Mag Reson Med. 2022;30:1105. https://cds.ismrm.org/protected/22MPresentations/abstracts/1105.html. Accessed November 3, 2023.
15. Yablonskiy DA, Haacke EM. An MRI method for measuring T2 in the presence of static and RF magnetic field inhomogeneities. Magn Reson Med. 1997;37(6):872-876.
16. Balasubramanian M, Mulkern R V, Polimeni JR. In vivo irreversible and reversible transverse relaxation rates in human cerebral cortex via line scans at 7 T with 250 micron resolution perpendicular to the cortical surface. Magn Reson Imaging. 2022;90:44-52.
17. Wang F, Dong Z, Wald LL, Polimeni JR, Setsompop K. Simultaneous pure T2 and varying T2′-weighted BOLD fMRI using Echo Planar Time-resolved Imaging for mapping cortical-depth dependent responses. Neuroimage. 2021;245:118641. doi:10.1016/j.neuroimage.2021.118641
18. Yu X, Qian C, Chen D yow, Dodd SJ, Koretsky AP. Deciphering laminar-specific neural inputs with line-scanning fMRI. Nat Methods. 2014;11(1):55-58.
19. Albers F, Schmid F, Wachsmuth L, Faber C. Line scanning fMRI reveals earlier onset of optogenetically evoked BOLD response in rat somatosensory cortex as compared to sensory stimulation. Neuroimage. 2018;164:144-154.
20. Raimondo L, Knapen T, Oliveira ĹAF, et al. A line through the brain: implementation of human line-scanning at 7T for ultra-high spatiotemporal resolution fMRI. J Cereb Blood Flow Metab. 2021;41(11):2831-2843.
21. Raimondo L, Priovoulos N, Passarinho C, et al. Robust high spatio-temporal line-scanning fMRI in humans at 7T using multi-echo readouts, denoising and prospective motion correction. J Neurosci Methods. 2023;384:109746. doi:10.1016/j.jneumeth.2022.109746
22. Choi S, Zeng H, Chen Y, Sobczak F, Qian C, Yu X. Laminar-specific functional connectivity mapping with multi-slice line-scanning fMRI. Cerebral Cortex. 2022;32(20):4492-4501. doi:10.1093/cercor/bhab497
23. Ma J, Wehrli FW. Method for image-based measurement of the reversible and irreversible contribution to the transverse-relaxation rate. J Magn Reson B. 1996;111(1):61-69.
24. Mulkern R V, Balasubramanian M, Mitsouras D. On the Lorentzian versus Gaussian character of time-domain spin-echo signals from the brain as sampled by means of gradient-echoes: Implications for quantitative transverse relaxation studies. Magn Reson Med. 2015;74(1):51-62.
25. Mareyam A, Kirsch J, Chang Y, Madan G, Wald L. A 64-Channel 7T array coil for accelerated brain MRI. Proc Intl Soc Mag Reson Med. 2020;0764.
26. van der Kouwe AJW, Benner T, Salat DH, Fischl B. Brain morphometry with multiecho MPRAGE. Neuroimage. 2008;40(2):559-569.
27. Stables LA, Kennan RP, Gore JC. Asymmetric spin-echo imaging of magnetically inhomogeneous systems: theory, experiment, and numerical studies. Magn Reson Med. 1998;40(3):432-442. http://www.ncbi.nlm.nih.gov/pubmed/9727947. Accessed February 4, 2017.
28. Bandettini PA, Wong EC. Echo-planar magnetic resonance imaging of human brain activation. In: Schmitt F, Stehling MK, Turner R, eds. Echo-Planar Imaging: Theory, Technique and Application. Berlin: Springer-Verlag; 1997:493-530.
29. Boxerman JL, Bandettini PA, Kwong KK, et al. The intravascular contribution to fMRI signal change: Monte Carlo modeling and diffusion-weighted studies in vivo. Magn Reson Med. 1995;34(1):4-10. http://www.ncbi.nlm.nih.gov/pubmed/7674897.
30. Kundu P, Voon V, Balchandani P, Lombardo M V., Poser BA, Bandettini PA. Multi-echo fMRI: A review of applications in fMRI denoising and analysis of BOLD signals. Neuroimage. 2017;154:59-80. doi:10.1016/j.neuroimage.2017.03.033
31. Poser BA, Norris DG. Investigating the benefits of multi-echo EPI for fMRI at 7 T. Neuroimage. 2009;45(4):1162-1172. doi:10.1016/j.neuroimage.2009.01.007
32. Posse S, Wiese S, Gembris D, et al. Enhancement of BOLD-contrast sensitivity by single-shot multi-echo functional MR imaging. Magn Reson Med. 1999;42(1):87-97. doi:10.1002/(SICI)1522-2594(199907)42:1<87::AID-MRM13>3.0.CO;2-O
33. Lynch CJ, Power JD, Scult MA, Dubin M, Gunning FM, Liston C. Rapid Precision Functional Mapping of Individuals Using Multi-Echo fMRI. Cell Rep. 2020;33(12):108540. doi:10.1016/j.celrep.2020.108540
34. Pilmeyer J, Hadjigeorgiou G, Lamerichs RMJN, Breeuwer M, Aldenkamp AP, Zinger S. Spatial and Temporal Quality of Brain Networks for Different Multi-Echo fMRI Combination Methods. IEEE Access. 2023;11:114536-114549. doi:10.1109/ACCESS.2023.3324183
35. Glover GH, Lemieux SK, Drangova M, Pauly JM. Decomposition of inflow and blood oxygen level‐dependent (BOLD) effects with dual‐echo spiral gradient‐recalled echo (GRE) fMRI. Magn Reson Med. 1996;35(3):299-308. doi:10.1002/mrm.1910350306
Figures