3309
Using PINS pulses to investigate Inflow effects in SE-BOLD fMRI at 3T and 7T1Centre for Advanced Imaging, The University of Queensland, Brisbane, Australia, 2ARC Training Centre for Innovation in Biomedical Imaging Technology, The University of Queensland, Brisbane, Australia, 3School of Electrical Engineering and Computer Science, The University of Queensland, Brisbane, Australia, 4Department of Radiology, Harvard Medical School, Boston, MA, United States, 53Athinoula A. Martinos Center for Biomedical Imaging, Massachusetts General Hospital, Charlestown, MA, United States, 6Harvard-MIT Division of Health Sciences and Technology, Massachusetts Institute of Technology, Cambridge, MA, United States
Synopsis
Keywords: fMRI Acquisition, fMRI, inflow effects
Motivation: Most fMRI techniques infer neuronal activity from signal changes created by a complex interplay between hemodynamics and sequence design parameters.
Goal(s): Investigate inflow effects in SE-BOLD fMRI signals at different field strengths and resolutions.
Approach: We placed PINS pulses to saturate the magnetization in all slice gaps. By turning them on or off, inflow contributions to the SE-BOLD signal were modulated. Both 3- and 1.5-mm data were collected using a visual stimulation paradigm at 3T and 7T.
Results: Inflow contributions to SE-BOLD varied by field strength and partial voluming effects. Even at 7T, non-negligible inflow contributions were observed.
Impact: Saturating the magnetization in slice-gaps allows investigation of inflow effects in SE-BOLD fMRI. Low-resolution 3T-data revealed differences in onset timing. Comparing low- and high-resolution 7T-data with and without slice-gap saturation, increased resolution retained more activation, suggesting reduced sensitivity to inflow.
Introduction
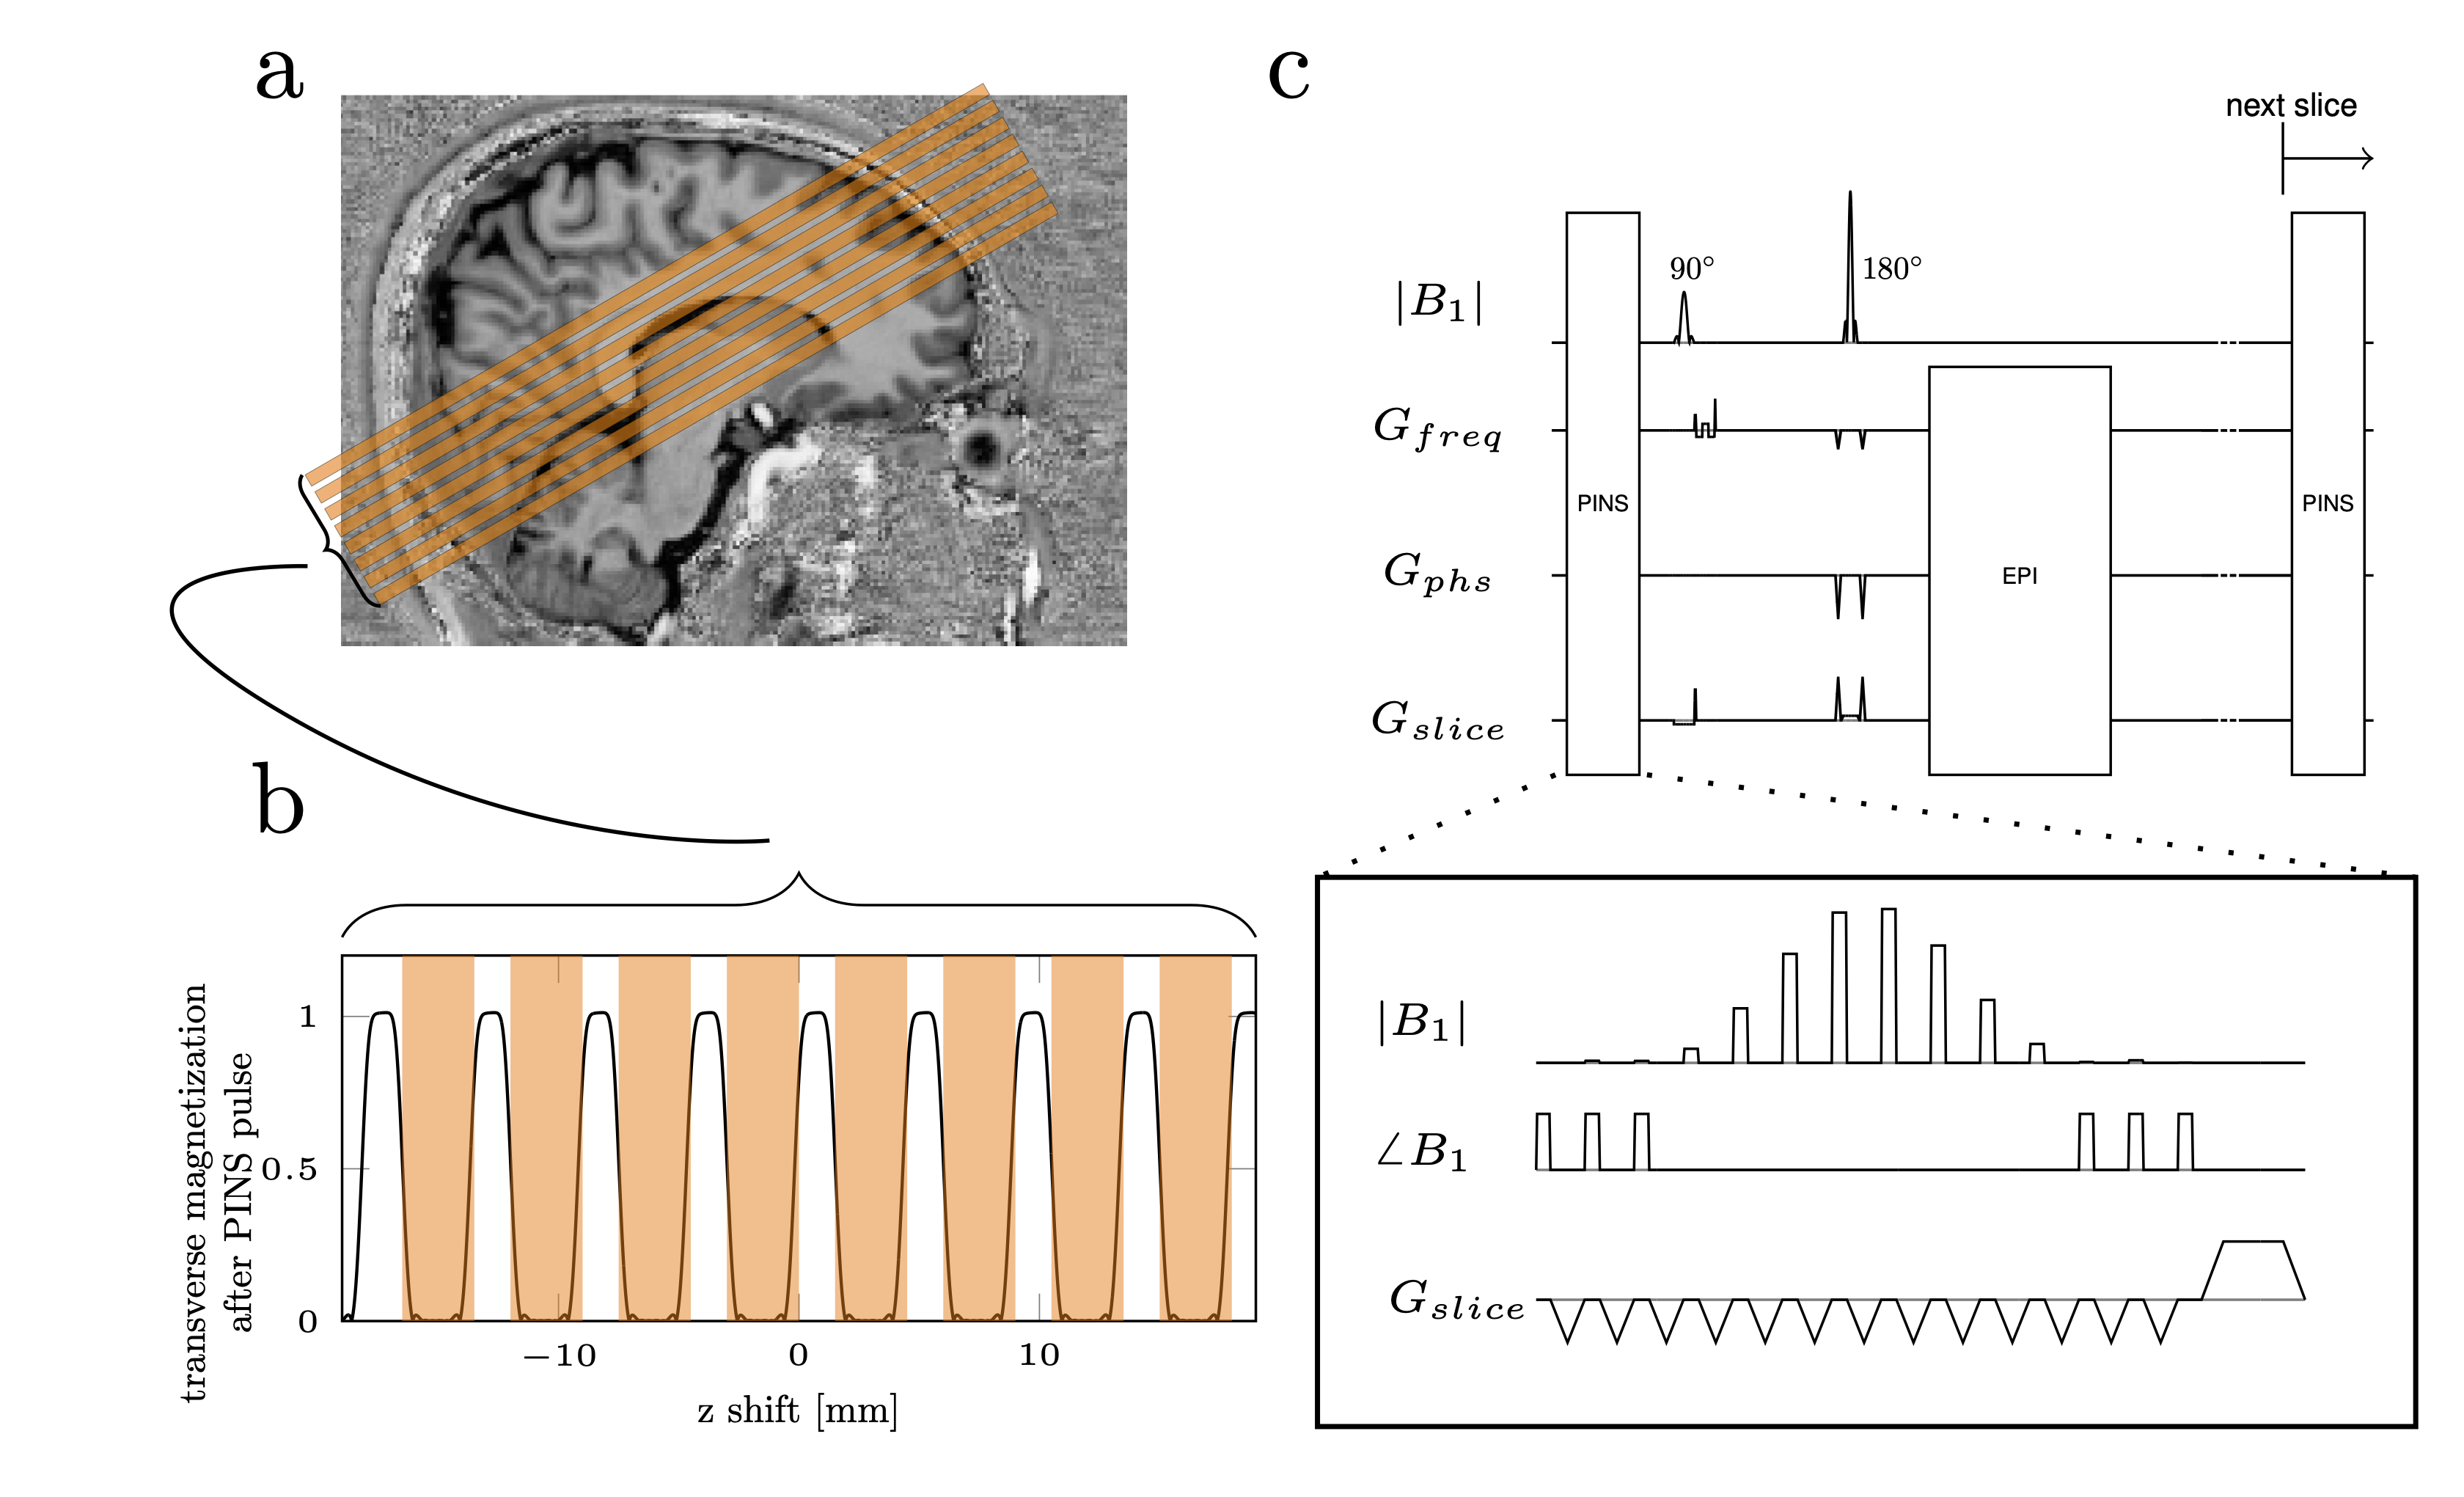
Multi-slice spin echo (SE) based acquisitions often employ slice gaps to avoid cross-talk between adjacent slices1. However, unsaturated magnetization residing in these gaps can flow into the imaging slice. In functional MRI (fMRI), such inflow effects can complicate the interpretation of fMRI signals2,3 and even result in artifacts4. The effect of inflow on Blood-Oxygenation-Level-Dependent (BOLD) fMRI can be studied by comparing fMRI signals obtained from different T1 weightings2 or using nonselective saturation pulses5. However, these approaches also affect signal produced by stationary spins. Last year, we demonstrated that Power Independent of Number of Slices (PINS) pulse6 can be used to efficiently mitigate inflow effects by saturating the magnetization in the slice gaps without affecting the stationary spins in the imaging slice7. In this study, we used PINS pulses to investigate how inflow shapes the fMRI contrast and temporal features of the BOLD-weighted response at 3T and 7T and different imaging resolutions.Methods
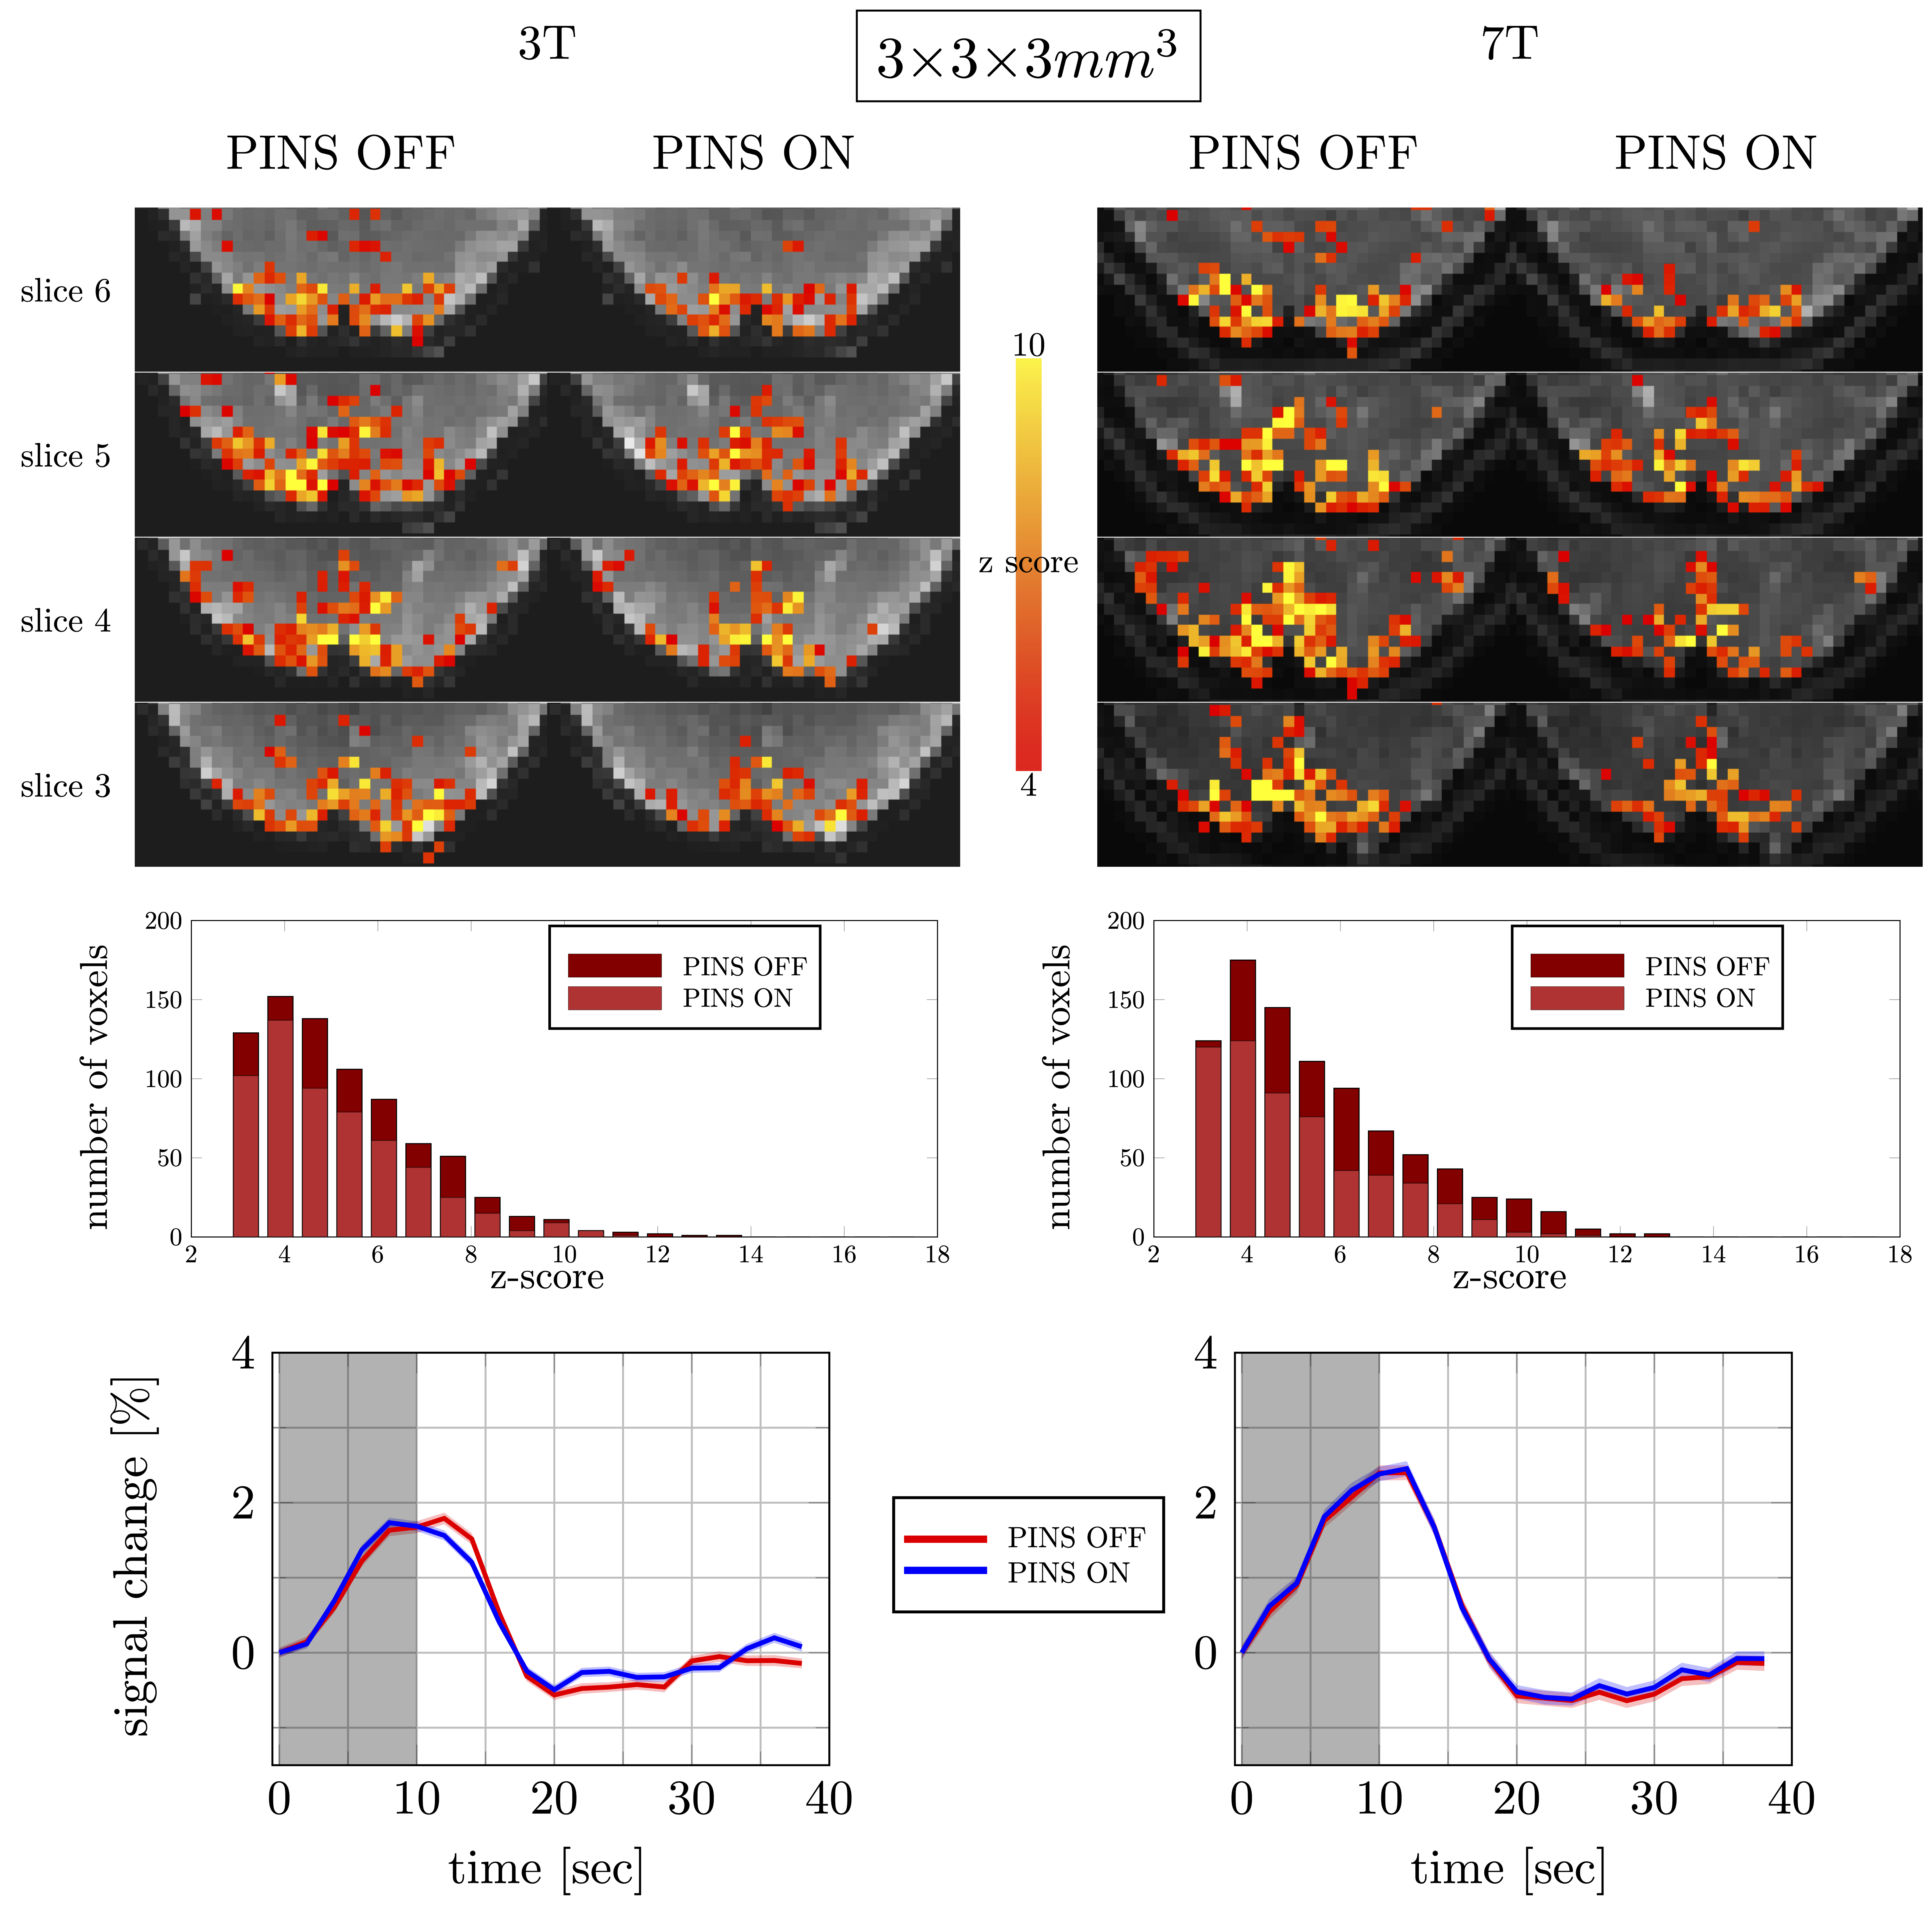
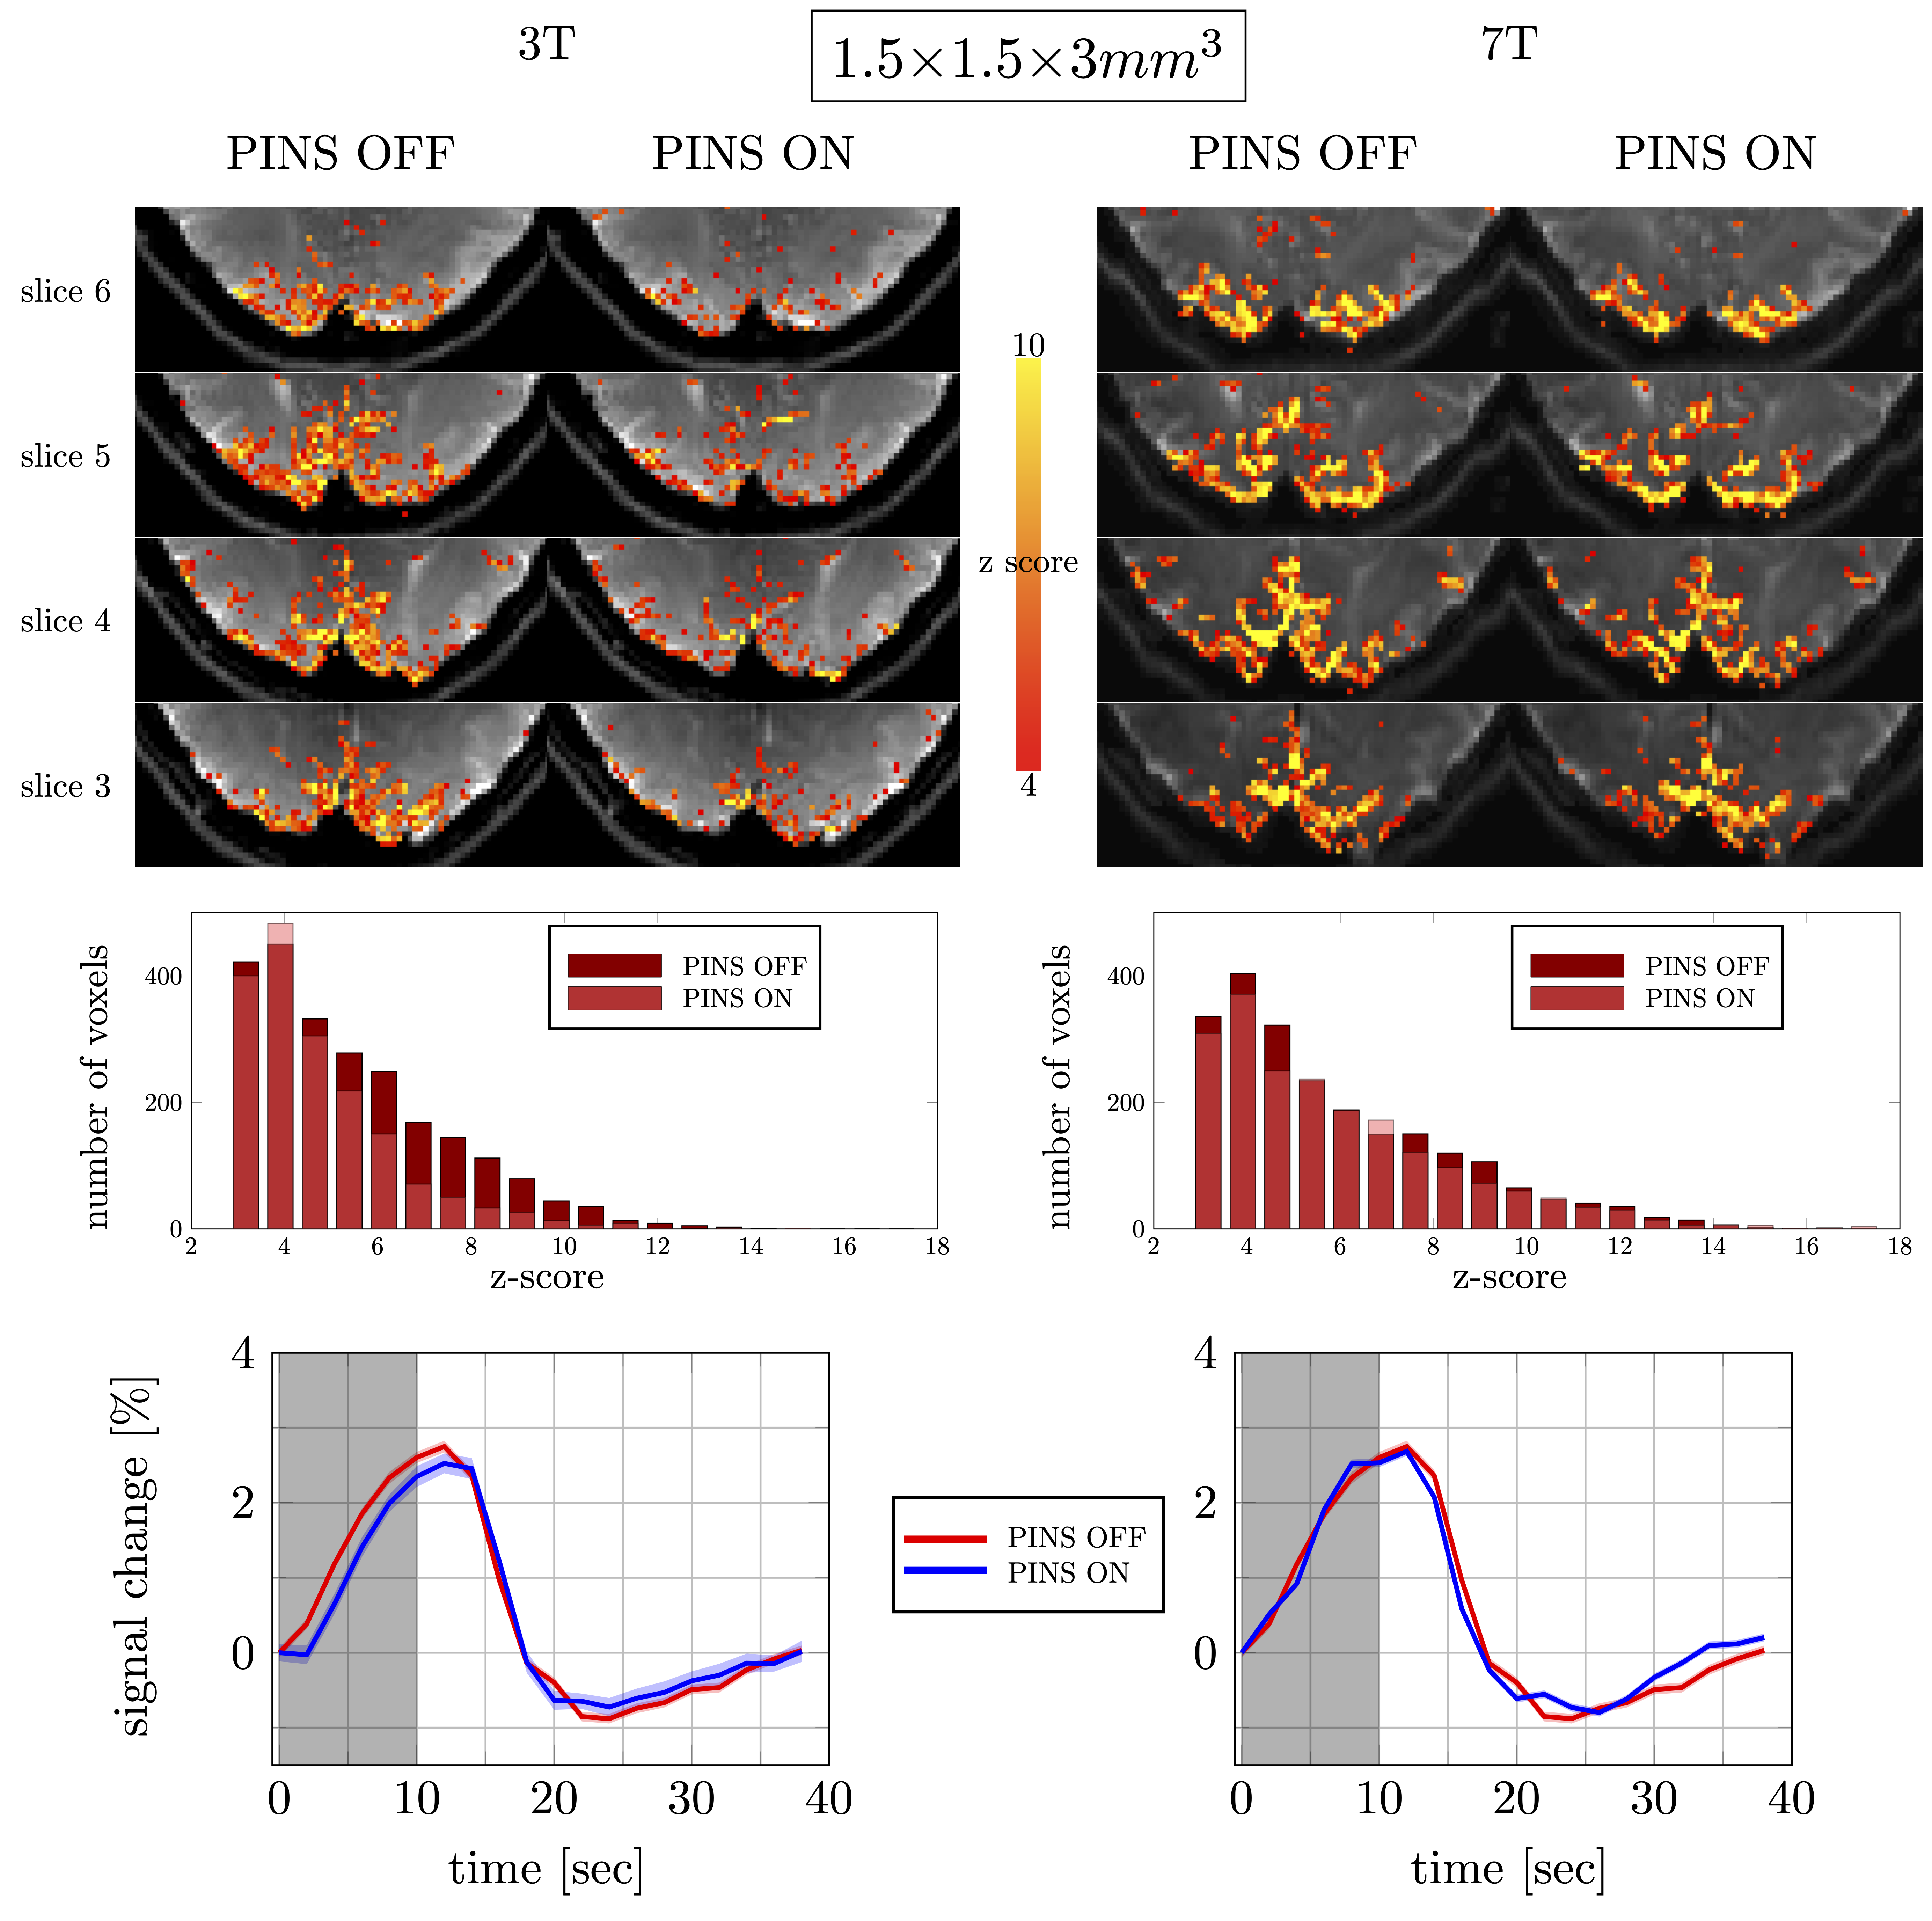
A healthy volunteer was scanned, having provided written informed consent, at 3T MAGNETOM Prisma and 7T MAGNETOM Terra (Siemens Healthcare, Erlangen, Germany) with a 64-Ch head coil and 32-Ch head coil (Nova Medicals, USA) respectively. At each field strength, functional data with different spatial resolutions (3×3×3mm3 and 1.5×1.5×3mm3) were acquired using SE-EPI sequence with and without an inflow-saturation PINS pulse (Figure 1). The sequence parameters are shown in Figure 2. Partial Fourier data were reconstructed using POCS8 with 8 iterations. The PINS pulse parameters were: number of sub peaks = 14, flip angle= 90°, BW = 427.35 Hz, periodicity = 4.5 mm, slice thickness = 1 mm, pulse duration = 7 ms (Figure 1). The voltage of the PINS pulse was set to 0 V to turn off the PINS pulse without affecting sequence timing. The PINS-SE-EPI sequence diagram and the inflow saturation profiles can be seen in Figure 1. Visual stimulation consisted of a flickering checkerboard (8 Hz: 10/30 s ON/OFF). Each functional run lasted 8.5 min. Slice timing and motion were corrected using SPM129. Data acquired with PINS pulse were coregistered to the one acquired without PINS pulse using rigid transformation, and both were analyzed in the same space. GLM analysis (FSL feat10) was performed to create activation maps. Voxels with a z-score above 4.0 were selected to compute trial-average responses.Results
Figure 3 shows the results acquired with a low spatial resolution. As seen in the activation maps and associated z-score histograms, a substantial number of voxels was influenced by inflow effects. However, interestingly, the inflow contributions did not alter the SE-BOLD response dynamics seen in the trial-averaged response.Figure 4 shows the results acquired with higher spatial resolution. At 3T many voxels remain influenced by inflow effects. However, at 7T, the number of voxels influenced by inflow becomes smaller. The trial-averaged response measured with and without PINS pulses showed a difference in response onset time at 3T, but not in 7T.
Discussion
The increased resolution reduces partial voluming effects, which changes voxel composition. Therefore, high-resolution data have a better chance of isolating individual voxels dominated by inflow effects from voxels dominated by more local BOLD effects in capillaries where the flow rate is low. This suggests that the onset timing difference seen in high-resolution data at 3T might be caused by inflow effects from small vessels such as arterioles or venules. It is expected that the intravascular components are much smaller at 7T compared to 3T11. The reduced intravascular contributions might explain why no change in onset time was observed at 7T. To further investigate this theory, data with even finer resolution from more subjects are necessary.At 7T, it is often assumed that venous intravascular components do not contribute to the BOLD response due to the short T2 of blood in the venules. However, simulations11 and a recent study12 reported evidence of intravascular BOLD at 7T, which could explain the non-negligible inflow contributions seen in our 7 T data (Figure 3 and Figure 4 right).
Conclusion
Our study showed that PINS pulse can be used to modulate inflow contributions in SE-BOLD fMRI. Substantial inflow contributions were seen in activation maps at both 3 and 7T. The amount of inflow contributions to SE-BOLD not only depends on the field strength but also on imaging parameters such as voxel size.Acknowledgements
This work was supported by the Australian government through the Australian Research Council (ARC) Future fellowship grant FT200100329, by the NIH NIBIB (grants P41-EB030006 and R01-EB019437), and by the BRAIN Initiative (NIH NINDS grant U19-NS123717). The authors acknowledge the facilities of the National Imaging Facility at the Centre for Advanced Imaging.References
- Howseman, A. M., Grootoonk, S., Porter, D. A., Ramdeen, J., Holmes, A. P., & Turner, R. (1999). The effect of slice order and thickness on fMRI activation data using multislice echo-planar imaging. Neuroimage, 9(4), 363-376.
- Gao, J. H., & Liu, H. L. (2012). Inflow effects on functional MRI. Neuroimage, 62(2), 1035-1039.
- Duyn, J. H., Moonen, C. T., van Yperen, G. H., de Boer, R. W., & Luyten, P. R. (1994). Inflow versus deoxyhemoglobin effects in BOLD functional MRI using gradient echoes at 1.5 T. NMR in Biomedicine, 7(1‐2), 83-88.
- Hodono, S., Rideaux, R., van Kerkoerle, T., Cloos, A.M. (2023). Initial experiences with Direct Imaging of Neuronal Activity (DIANA) in humans. Imaging Neuroscience, 1(1), 1-11.
- Yacoub, E., Duong, T.Q., Van De Moortele, P.F., Lindquist, M., Adriany, G., Kim, S.G., Uğurbil, K. and Hu, X., 2003. Spin‐echo fMRI in humans using high spatial resolutions and high magnetic fields. Magnetic Resonance in Medicine: An Official Journal of the International Society for Magnetic Resonance in Medicine, 49(4), 655-664.
- Norris, D. G., Koopmans, P. J., Boyacioğlu, R., & Barth, M. (2011). Power independent of number of slices (PINS) radiofrequency pulses for low power simultaneous multislice excitation. Magnetic resonance in medicine, 66(5), 1234-1240.
- Hodono, S., Wu, C., Dixon, C., Maillet, D., Jin, J., Polimeni, J., Cloos, M. (2022). Using PINS pulses to saturate inflow effects from slice gaps in functional MRI. In Proc. of the 32nd Annual Meeting of ISMRM. Toronto, Canada. #3844.
- Haacke, E.M., Lindskogj, E.D. and Lin, W., 1991. A fast, iterative, partial-Fourier technique capable of local phase recovery. Journal of Magnetic Resonance (1969), 92(1), pp.126-145.
- Penny WD, Friston KJ, Ashburner JT, Kiebel SJ, Nichols TE, editors. Statistical parametric mapping: the analysis of functional brain images. Elsevier; 2011.5.
- M.W. Woolrich, B.D. Ripley, J.M. Brady and S.M. Smith. Temporal Autocorrelation in Univariate Linear Modelling of FMRI Data. NeuroImage 14:6(1370-1386) 2001.6.
- Uludağ, K., Müller-Bierl, B. and Uğurbil, K., 2009. An integrative model for neuronal activity-induced signal changes for gradient and spin echo functional imaging. Neuroimage, 48(1), pp.150-165.
- Varadarajan, D., Wighton, P., Jingyuan, C., Proulx, S., Frost, R., van der Kouwe, A., Berman, A., Polimeni, J.R., (2023), Measuring individual vein and artery BOLD responses to visual stimuli in humans with multi-echo single-vessel functional MRI at 7T. In Proc. of the 32nd Annual Meeting of ISMRM. Toronto, Canada. #3663.
Figures