3307
Characterizing Zero Echo Time fMRI in a Mouse Model1Georgia Institute of Technology/Emory University, Atlanta, GA, United States
Synopsis
Keywords: fMRI Acquisition, fMRI
Motivation:
Zero-TE fMRI offers researchers a valuable tool for enabling more efficient and effective awake animal imaging. However, this has yet to be tested and validated in mice, a popular species in fMRI studies.
Goal(s): The goal of this study is to validate using zero-TE fMRI in a mouse model, through signal analysis and characterization, and later connectivity comparisons/analyses.
Approach: 10 anesthetized (1.1%iso) mice were scanned for resting-state and stimulation-based fMRI at 9.4T, acquired using EPI and ZTE; the reconstructed data were then characterized.
Results: This study presents evidence that though ZTE signal differs from EPI signal, there is still sufficient overlap in connectivity.
Impact: This study presents evidence that ZTE is an effective alternative to EPI in fMRI studies. If employed, this will address several issues researchers currently face (motion artifacts, signal loss, etc.), while still ensuring functional contrast is produced.
Introduction
Functional MRI (fMRI) has long benefitted from the BOLD effect, exploiting this physiological change in magnetic susceptibility to act as an indirect measure of neural activity. However, the BOLD mechanism is not the only method for producing functional contrast in neuroimaging; recently, researchers in the field have begun exploring using zero echo time sequences (ZTE, MBSWIFT) to capture functional neuroimages, due to its suitability for use in multi-modal set-ups, and awake animal scanning. Despite the promising aspects of zero echo time sequences (minimal acoustic noise, insensitivity to motion artifacts, lack of susceptibility mismatch artifacts), there are still significant gaps in our understanding of these sequences that warrant further studies. These gaps include how different conditions (resting-state vs stimulation-based) affect ZTE signal acquired, how spatiotemporal patterns translate, and compatibility with a mouse model – all currently published studies have only employed a rat model. Understanding the mechanism behind a pulse sequence is crucial to accurately interpreting its acquired signal. The preprocessing stage provides a unique opportunity, in that it is typically several necessary and complicated steps in fMRI studies when EPI is the primary sequence used: motion correction, temporal filtering, spatial smoothing, realignment, top-up correction, non/linear registration, and so many other variations. However, ZTE signal is dependent on a different mechanism, and therefore is likely not characterized the same as EPI – and as such, will not require the same processing steps. Testing what parameters are ideal for most precise connectivity results will allow us to learn more about the ZTE signal, and potentially, ZTE itself. To do so, this study analyzes resting-state and stimulation-based fMRI data from 10 anesthetized mice, acquired with both EPI, the conventional BOLD sequence, and ZTE, a zero echo time sequence known to produce functional contrast.Methods
All data was acquired at Emory University Whitehead Bruker 9.4T Biospin small-animal MRI, on a cohort of 10 C57BL/6 mice [TITL-VSFPBxcreeGFP(-), tTA(-)], anesthetized for the entire scan duration at 1.1% isoflurane. Resting-state fMRI from these mice were acquired using an echo planar imaging (EPI) sequence [TE=msec, TR=2000msec, flip angle = 90] and zero echo time (ZTE) [TE=0msec, TR=2000msec, FOV = 64x64]. Stimulation-based fMRI was also acquired from the same mice (in the same scanning session) with the above parameters, and 5-Hz forepaw stimulation. Reconstructed data was initially characterized by tSNR, global signal detection, intensity distribution and power spectral analysis. Data was then preprocessed using several methods (to ensure fidelity), among which include the RABIES pipeline, and an in-house preprocessing pipeline, using the Allen atlas. The preprocessed data were tested for signal quality, and z-scored for static functional connectivity.Results and Discussion
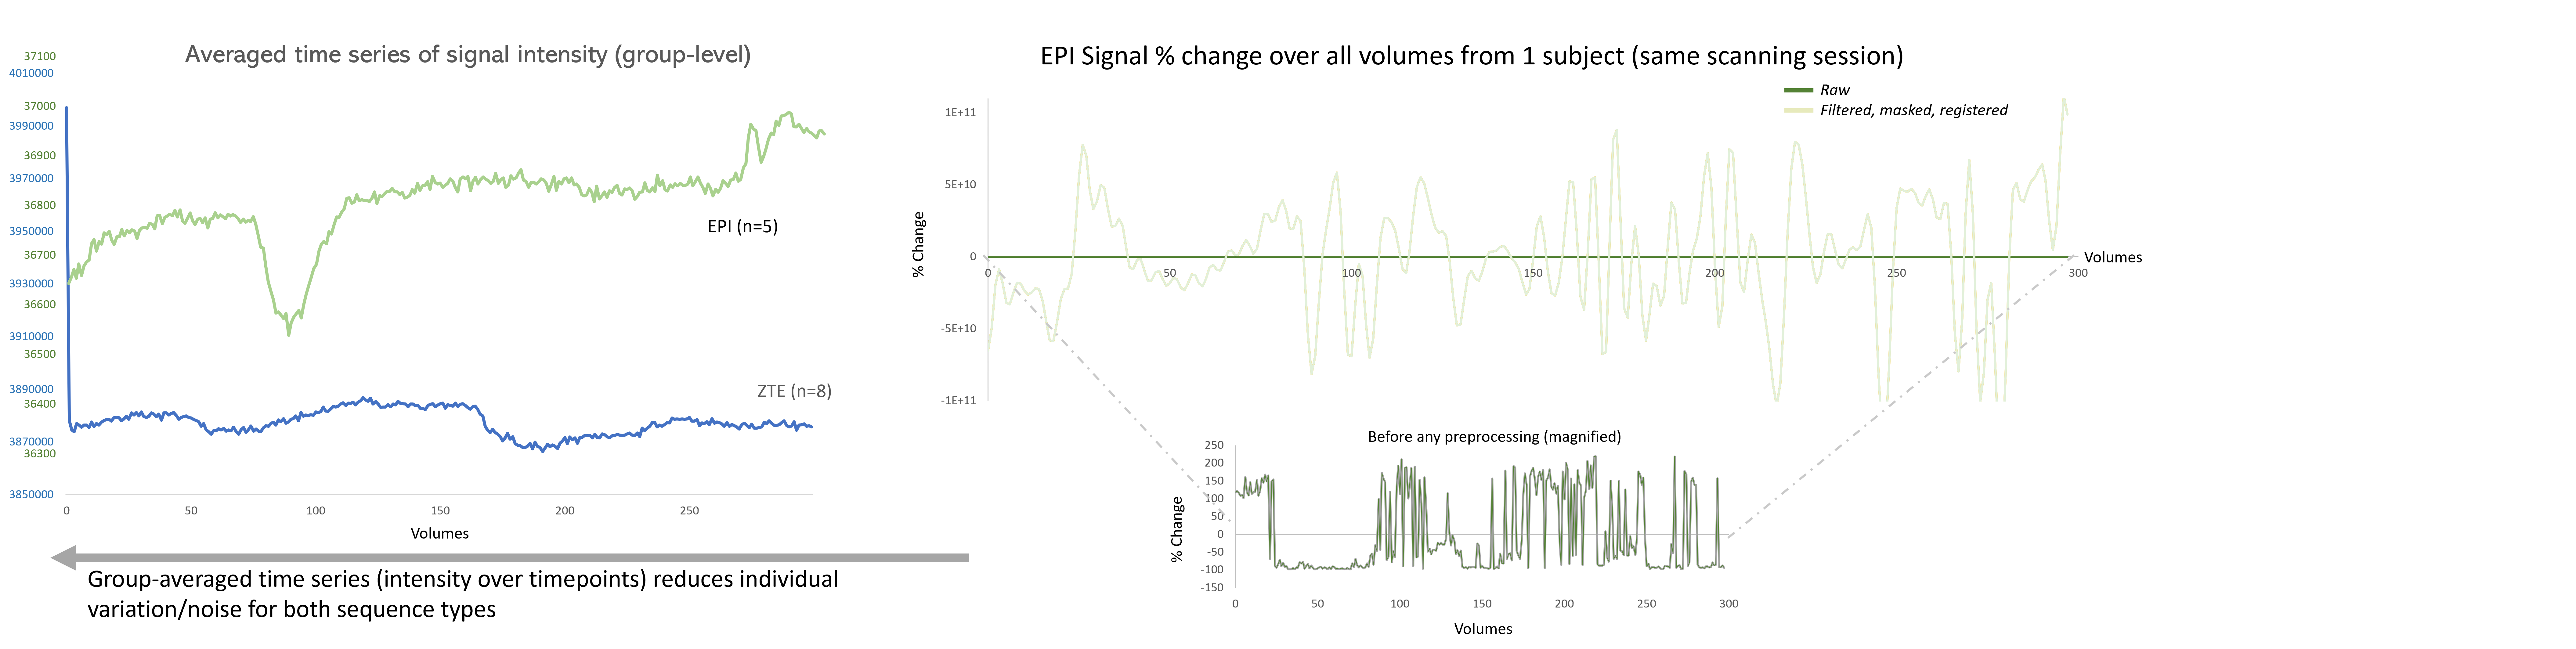
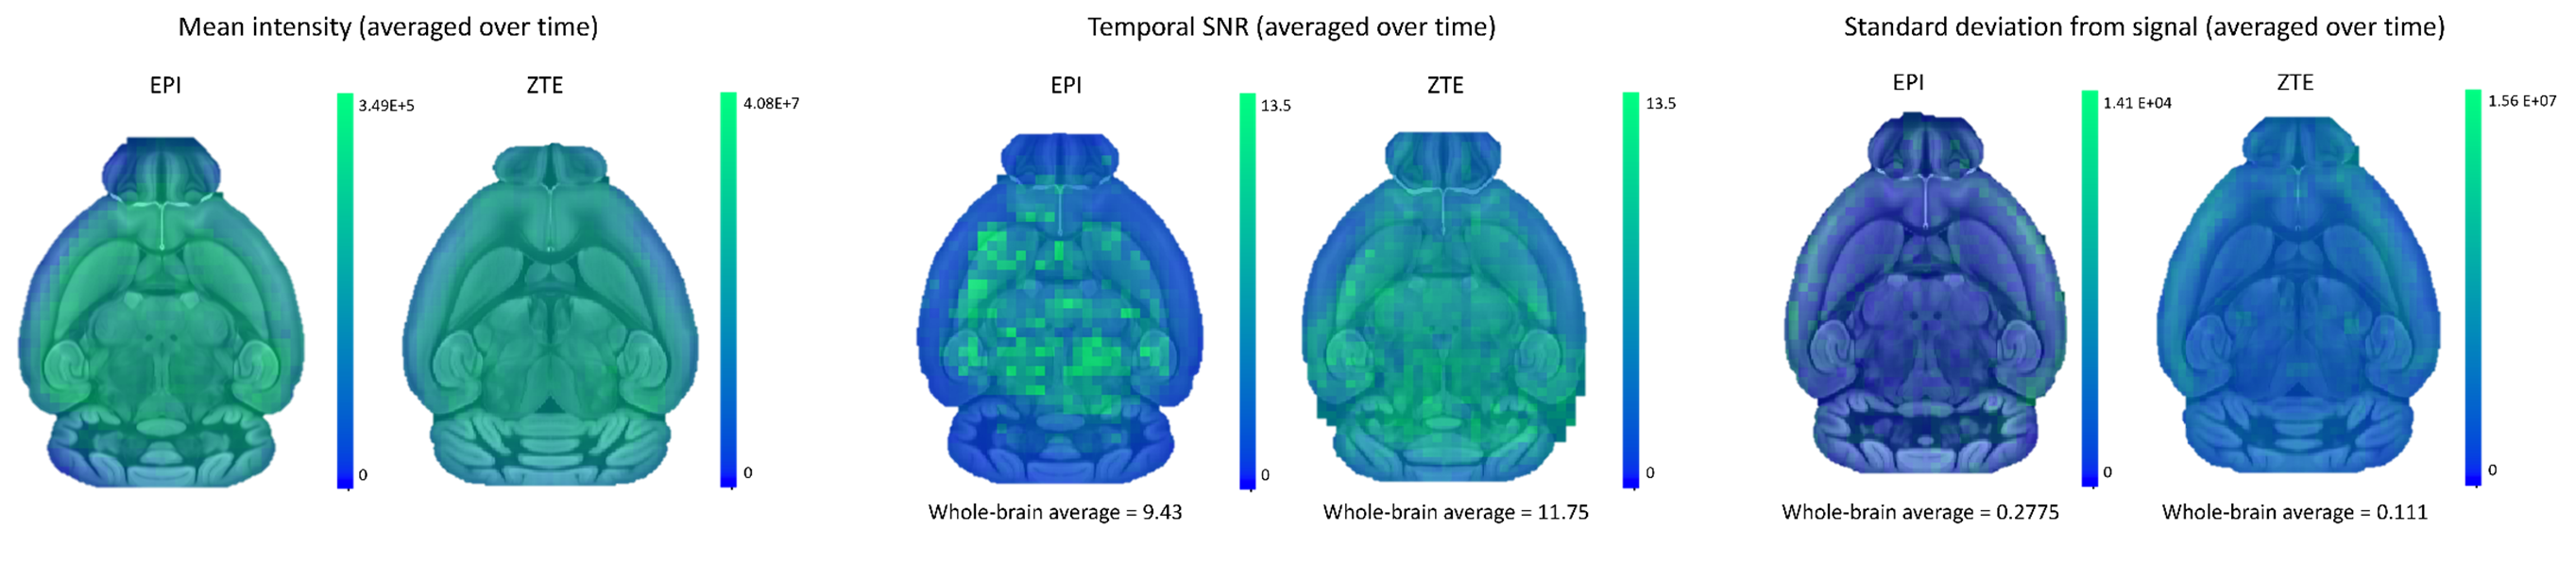
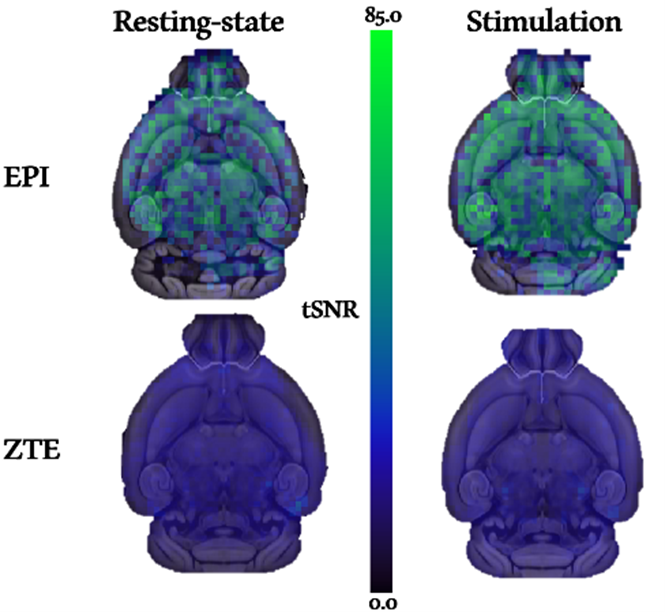
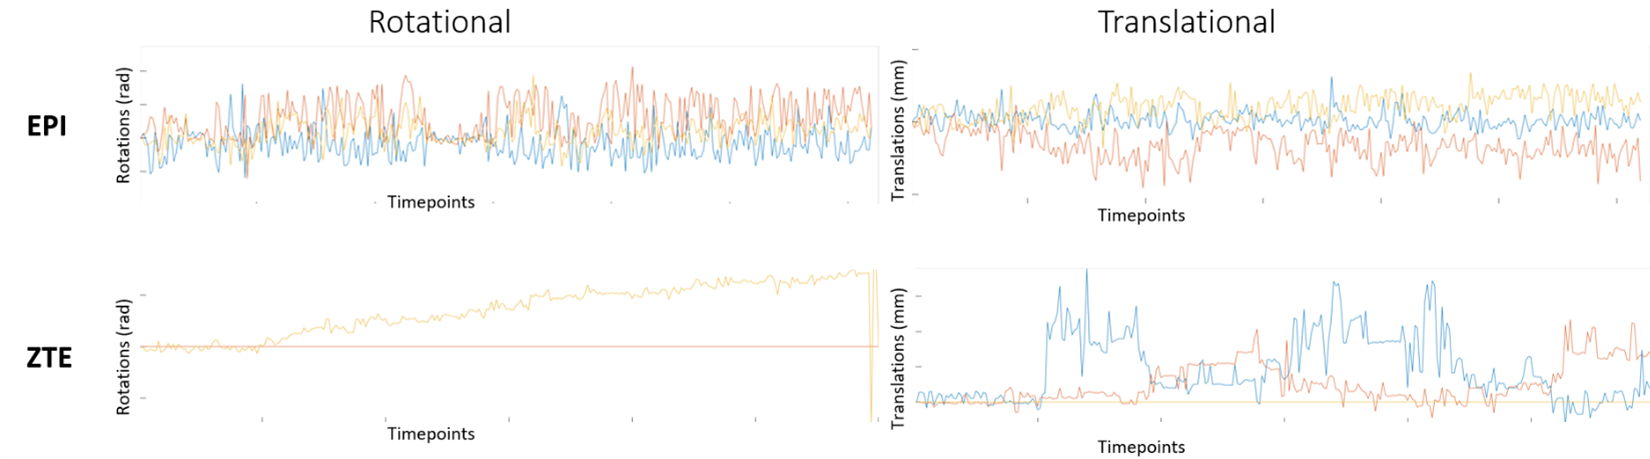
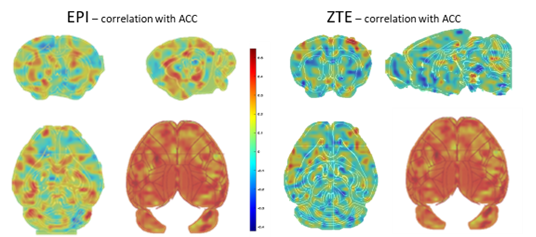
In many fMRI studies that employ EPI (and therefore BOLD), the BOLD signal change is quantified as % change over time. Figure 1 both demonstrates how this value changes at group-level (whole-brain), and individual-subject level (voxel-based). The individual scan includes before and after preprocessing for EPI and ZTE. Already the difference in produced contrast is demonstrated, alongside the importance of adequate processing. This trend is seen in figures 2 and 3 as well, which summarizes quality parameters. Seen in figure 2, the mean intensity of whole-brain voxels produced from both sequences is relatively similar, but tSNR and standard deviation reveal some variation. While ZTE average tSNR is less strong throughout the entire brain, it has fewer areas (particularly near the edges) of signal loss compared to EPI, also seen with standard deviation. Figure 3 is one individual subject’s tSNR map across conditions, and again interesting trends are revealed; the tSNR of ZTE appears constant if not nearly identical across conditions, while EPI is more variable. Figure 4 presents translational and rotational motion displacements for both sequences, and as expected, there is significantly more motion present in EPI data, and certain outliers/peaks correspond to poor-quality images. The same cannot be said about ZTE data, as very little motion was detected, nor were any noticeable outliers present. Observing connectivity with the ACC in figure 5, there is minimal difference between the level of activation between sequences. Although noisier, ZTE activation matches several key nodes seen from EPI data.Ultimately, zero echo time fMRI will offer researchers more flexibility in their acquisition set-ups, as it offers solutions to several existing problems (sensitivity to motion, low reproducibility, complex processing pipelines, low tSNR), and has demonstrated cross-species, at several field strengths and in different scanner systems, that it is capable of functional contrast, sufficient enough to replace EPI/BOLD. This would be especially helpful in the case of awake animal imaging – the most analogous to clinical imaging.
Acknowledgements
No acknowledgement found.References
Chen, Way Cherng, and Sarah Herrmann. "Towards silent and distortion-free fMRI with Zero Echo Time MRI."
Ljungberg, Emil, et al. "Silent zero TE MR neuroimaging: current state-of-the-art and future directions." Progress in Nuclear Magnetic Resonance Spectroscopy 123 (2021): 73-93.
Paasonen, Jaakko, et al. "Whole-brain studies of spontaneous behavior in head-fixed rats enabled by zero echo time MB-SWIFT fMRI." NeuroImage 250 (2022): 118924.
Desrosiers-Gregoire, Gabriel, et al. "Rodent Automated Bold Improvement of EPI Sequences (RABIES): A standardized image processing and data quality platform for rodent fMRI." bioRxiv (2022): 2022-08.
Nan Xu, Leo Zhang+, Sam Larson+, Zengmin Li, Nmachi Anumba, Lauren Daley, Wen-Ju Pan, Kai-Hsiang Chuang, Shella Keilholz. (2023). Rodent Whole-Brain fMRI Data Preprocessing Toolbox. Aperture Neuro, 3, 1-3. https://doi.org/10.52294/001c.85075. (+ equal contributions)
Weiger, M., and K. P. Pruessmann. "MRI with zero echo time." eMagRes (2007).
Figures