3300
Evaluating the reproducibility of parallel transmission in fMRI at 7T1Centre for Advanced Imaging, The University of Queensland, Brisbane, Australia, 2ARC Training Centre for Innovation in Biomedical Imaging Technology, The University of Queensland, Brisbane, Australia, 3School of Electrical Engineering and Computer Science, The University of Queensland, Brisbane, Australia, 4Siemens Healthcare Pty Ltd, Brisbane, Australia
Synopsis
Keywords: fMRI Acquisition, Parallel Transmit & Multiband
Motivation: While pTx has been shown to improve the temporal signal-to-noise ratio (tSNR) in fMRI, it is not clear how variations in pulse fidelity between scans modulate tSNR and how this impacts fMRI studies using pTx.
Goal(s): To study whether the improved tSNR obtained with pTx in fMRI is reproducible across multiple scans of the same subject.
Approach: We scanned and rescanned two subjects using both traditional and pTx excitations, and examined the variation in tSNRs between the scans.
Results: Traditional and pTx excitations demonstrated comparable reproducibility in tSNR.
Impact: The improved tSNRs obtained using pTx were consistent across scans of the same subject, demonstrating inter-scan variations comparable with traditional single channel excitations. Collectively, these preliminary results suggest that pTx can be used with reproducibility confidence in fMRI studies.
Introduction
Ultra-high field (UHF) strengths improve the signal-to-noise ratio (SNR) and enhance the sensitivity to blood oxygenation level dependent signal variations in functional Magnetic Resonance Imaging (fMRI)1,2. However, non-uniformities in the transmit field (B1+) lead to spatially varied SNR and contrast3. One way to mitigate this artifact is using parallel transmission (pTx)4-7. When the temporal SNR (tSNR) is not yet dominated by physiological noise8, the increased SNR obtained using pTx translates into better tSNR in fMRI9,10. However, unlike the conventional singe-channel measurements using the Circularly Polarized (CP) mode, pTx pulses are tailored to each scan. Therefore, pTx performance may vary, even between scans on the same subject. Here we investigated the reproducibility of pTx in a scan-rescan, whole-brain task-based fMRI study at 7T.Methods
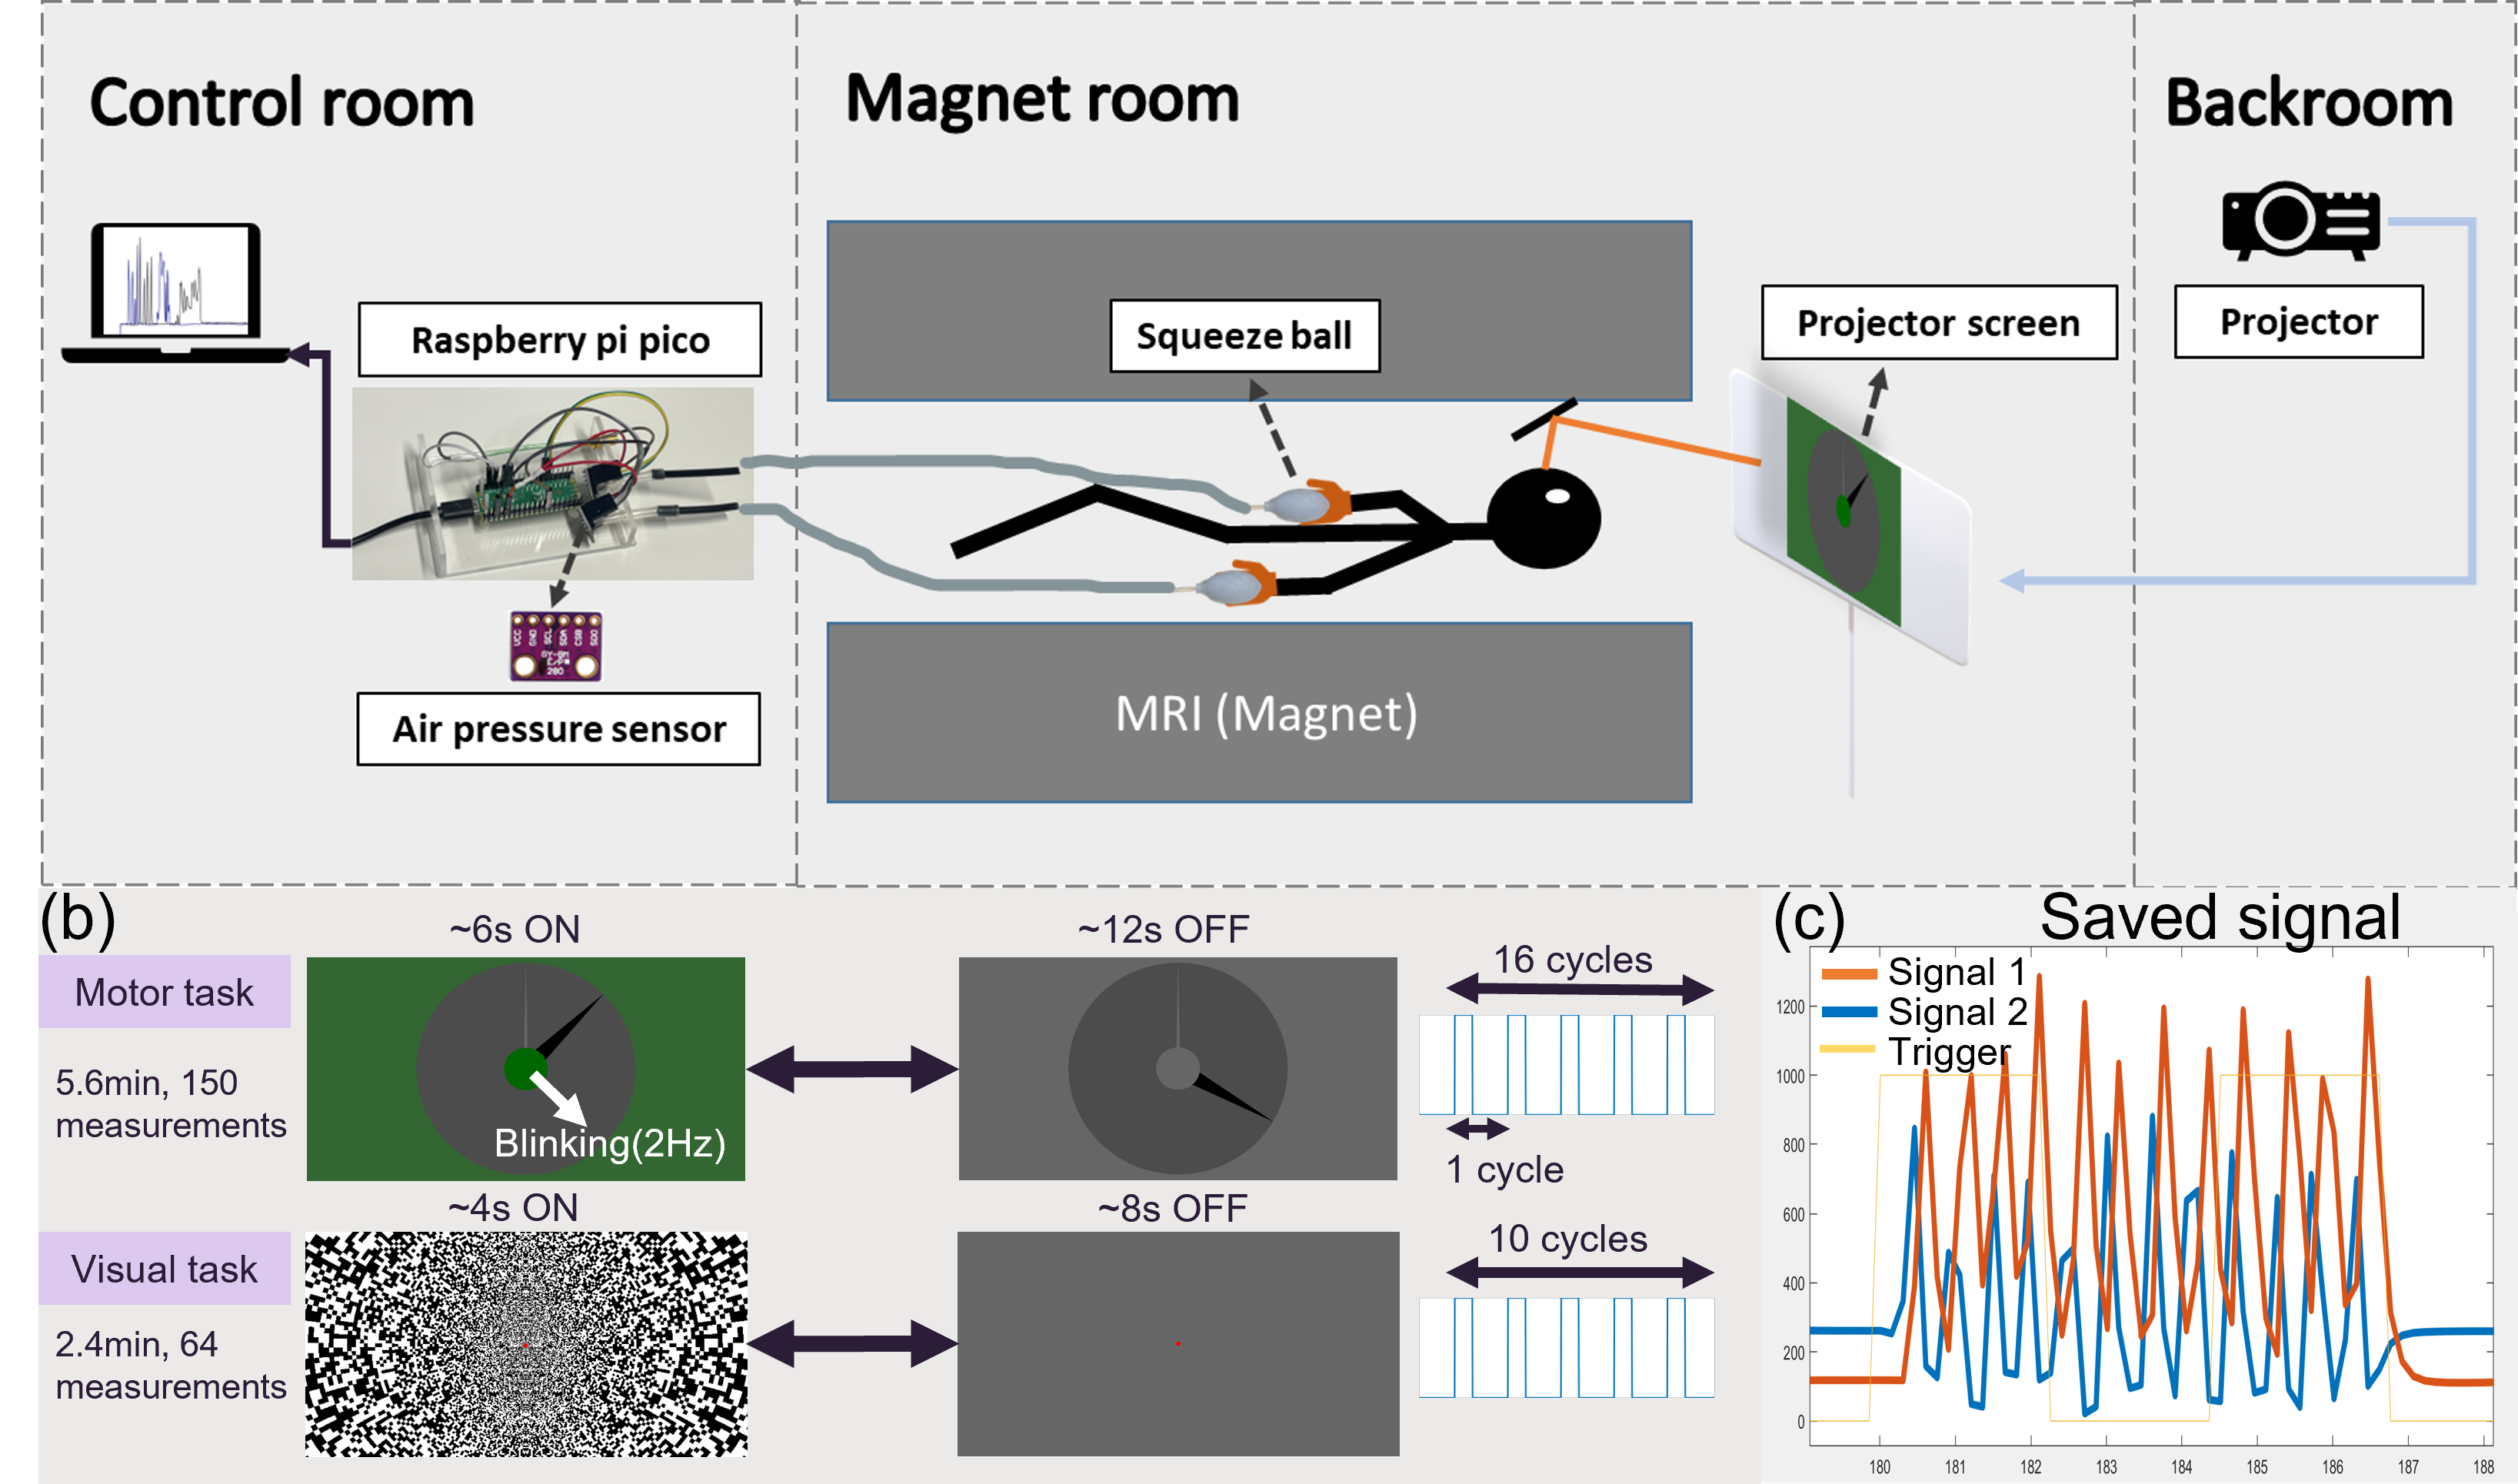
Paradigm: The study, approved by the local human research ethics committee, involved two healthy subjects who provided written informed consent. Each subject underwent two scans one week apart (±3days). In each scan they performed motor and visual tasks. For the motor task, subjects followed a visual cue to rhythmically (2Hz) squeeze their left and right hand asynchronously (Fig.1a). Task performance was recorded using squeeze balls (Fig.1c). The visual task alternated between a flashing noise pattern (8Hz, 4s) and a grey background (8s) (Fig.1b). Motor and visual tasks lasted 5.6min and 2.4min in each run.Data acquisition: Experiments were performed using a 7 Tesla whole-body MRI scanner (Siemens Healthcare, Erlangen, Germany) with an 8tx/32rx coil (Nova Medical, Wilmington, MA, USA). Calibration data was collected using an SA2RAGE11 (TRoverall/TE/TD1/TD2=2400/2.2/10/1700ms, 4x4x4mm3) and a 2D interleaved GRE (TR/TE=300/3ms, 4x4x4mm3). T2*-weighted images (TR/TE=1420/12ms, 2x2x2mm3) were collected to make brain masks (BET12, Brain Extraction Tool, FMRIB’s software library, www.fmrib.ox.ac.uk/fsl, version 6.0.4). Non-selective water excitation kT-points7,13 using sixteen 60µs sub-pulses, were designed using the magnitude least square spatial domain method14,15. Anatomical data was acquired using an MP2RAGE16 (TR/TI1/TI2/TE=4300/840/2450/1.99ms, 0.75x0.75x0.75mm3, FOV=156x225x240mm3). Functional data was collected using a research 3D GRE-EPI17,18, twice using CP pulses, and twice using pTx pulses (Sagittal acquisition, TRvol/TR/TE=2257/37/19ms, flip angle=12°, 1.5x1.5x1.5mm3, FOV=180x240x240mm3).
Pre-processing: Motion correction (SPM19, Statistical Parametric Mapping, www.fil.ion.ucl.ac.uk/spm, version 12) and brain extraction (FSL-BET12) were performed on functional and anatomical images. Smoothing (FWHM=3mm, SPM19) was applied to functional images. tSNR was calculated as the mean image divided by the time series standard deviation and registered to an MNI152-1mm standard brain. SNR was estimated from the mean image over the standard deviation of background signals (outside the head). Co-registered tSNRs were averaged across subjects to calculate the tSNR improvement (%) in pTx. Mean SNRs/tSNRs within selected ROIs (from FSL atlas) were computed to assess variation between runs/scans.
Results & Discussion
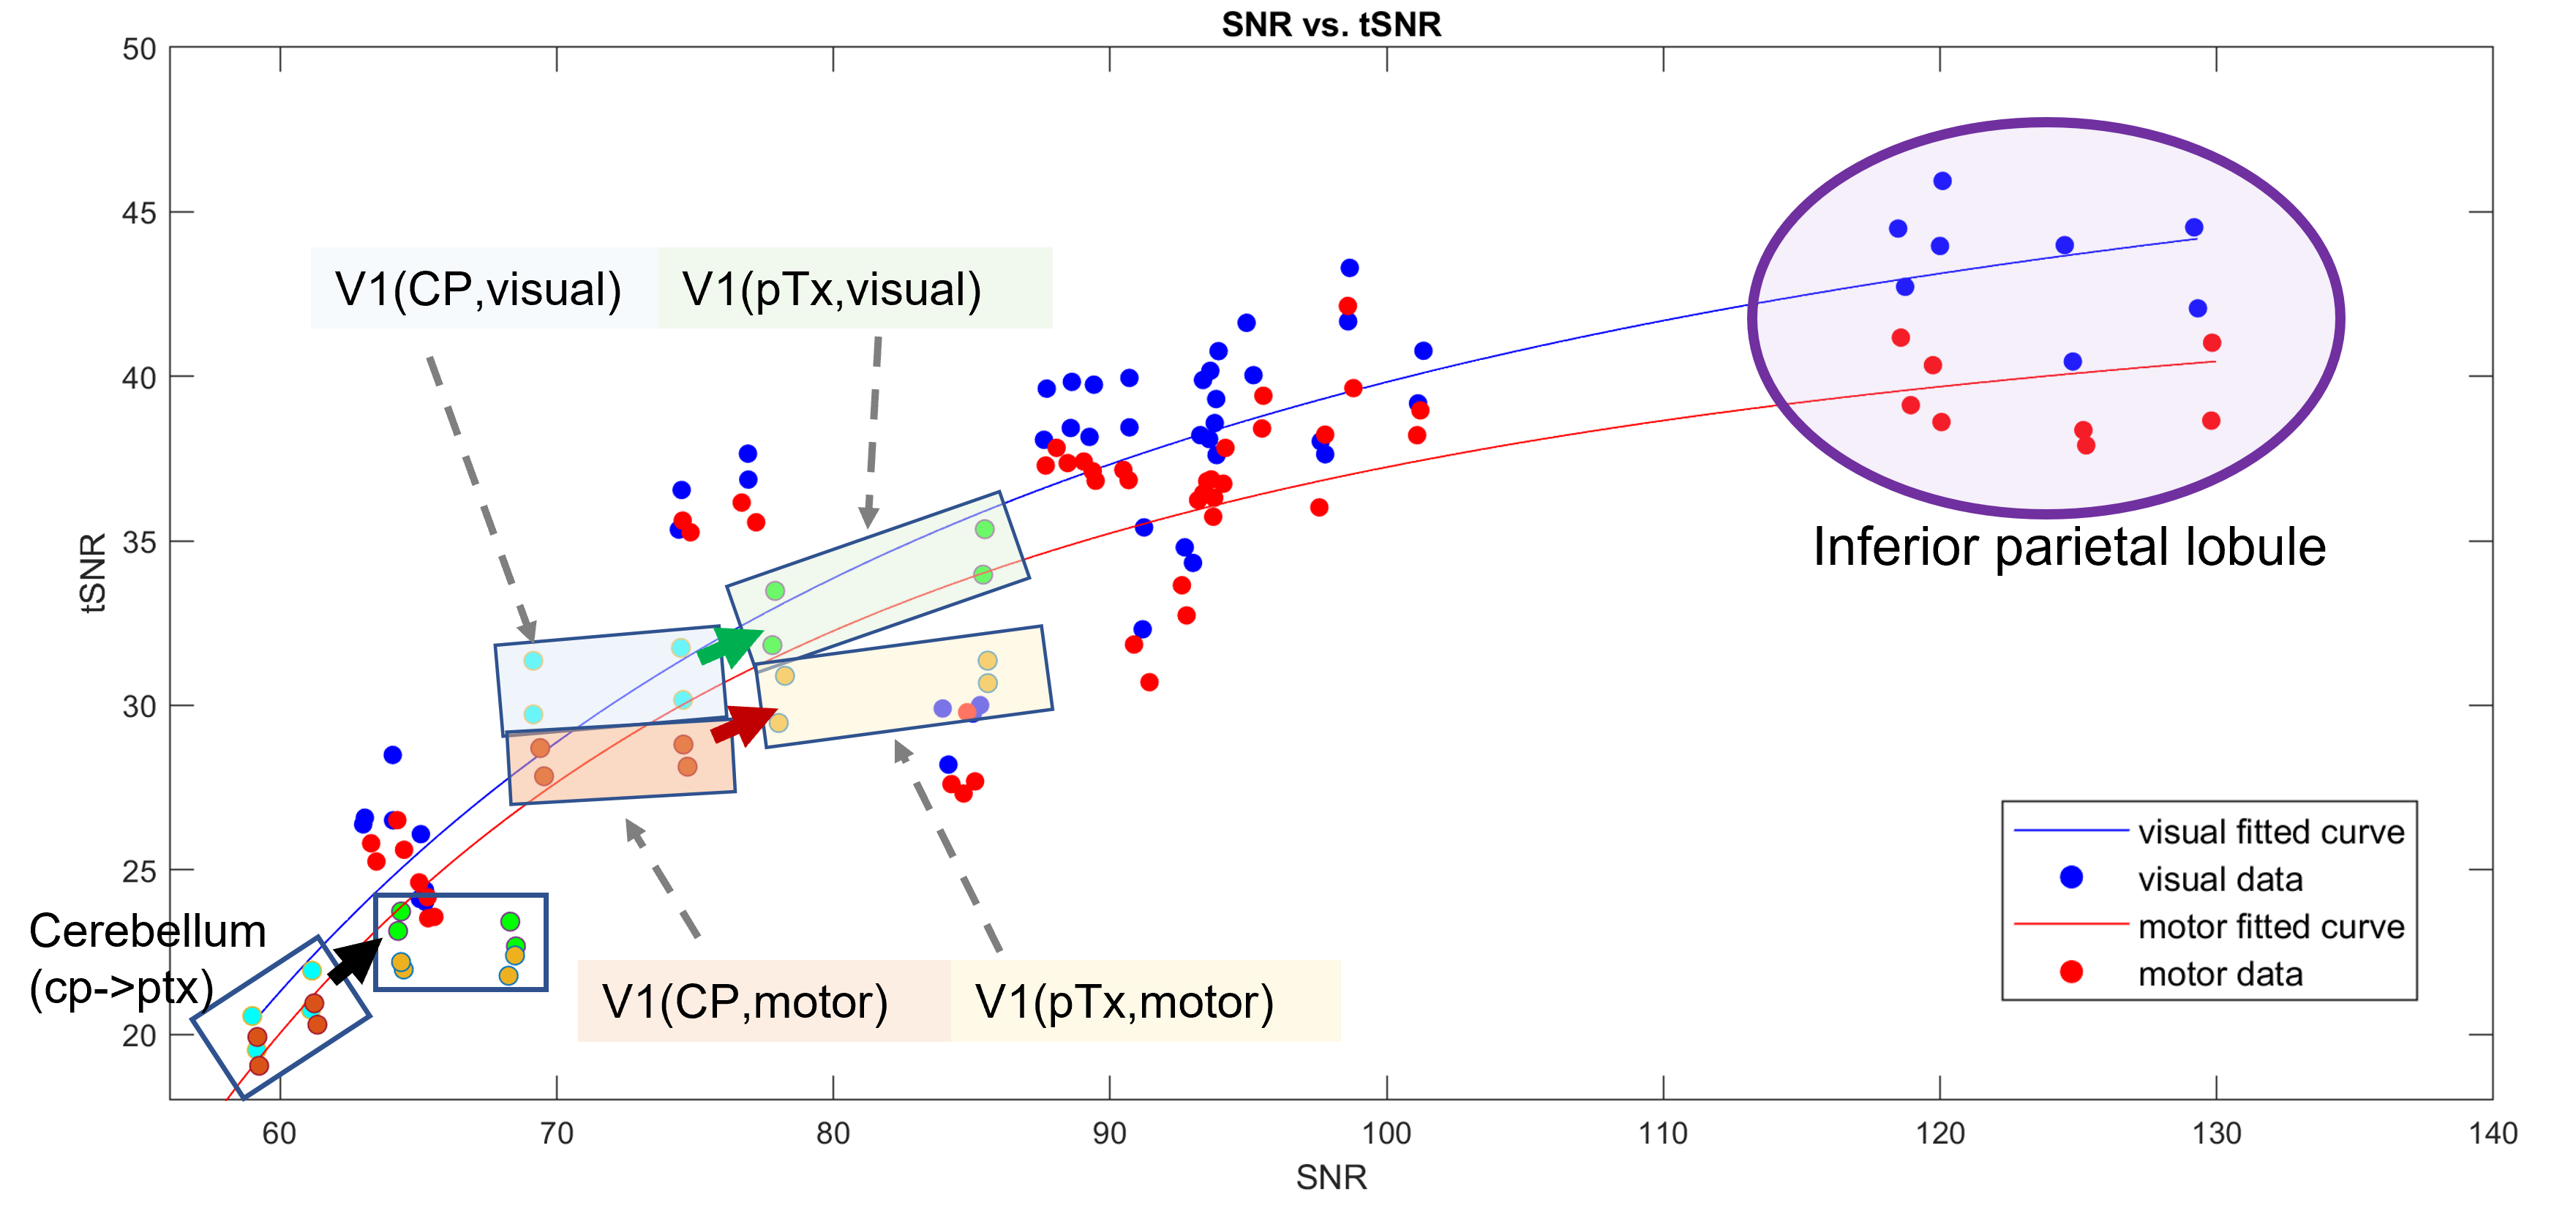
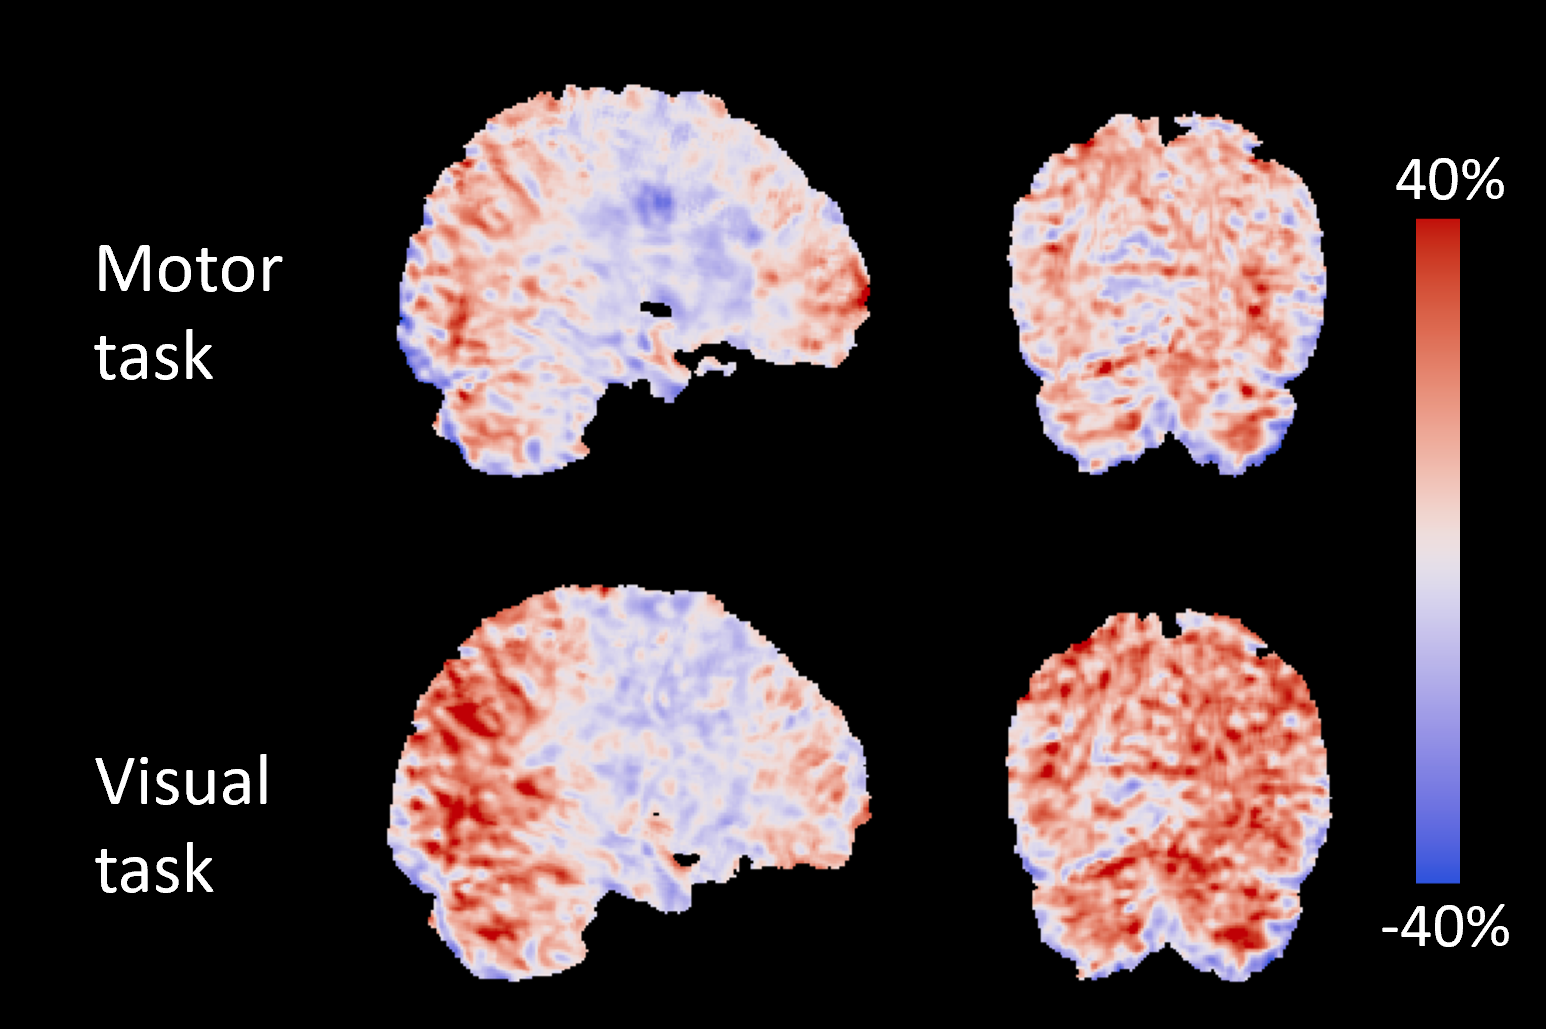
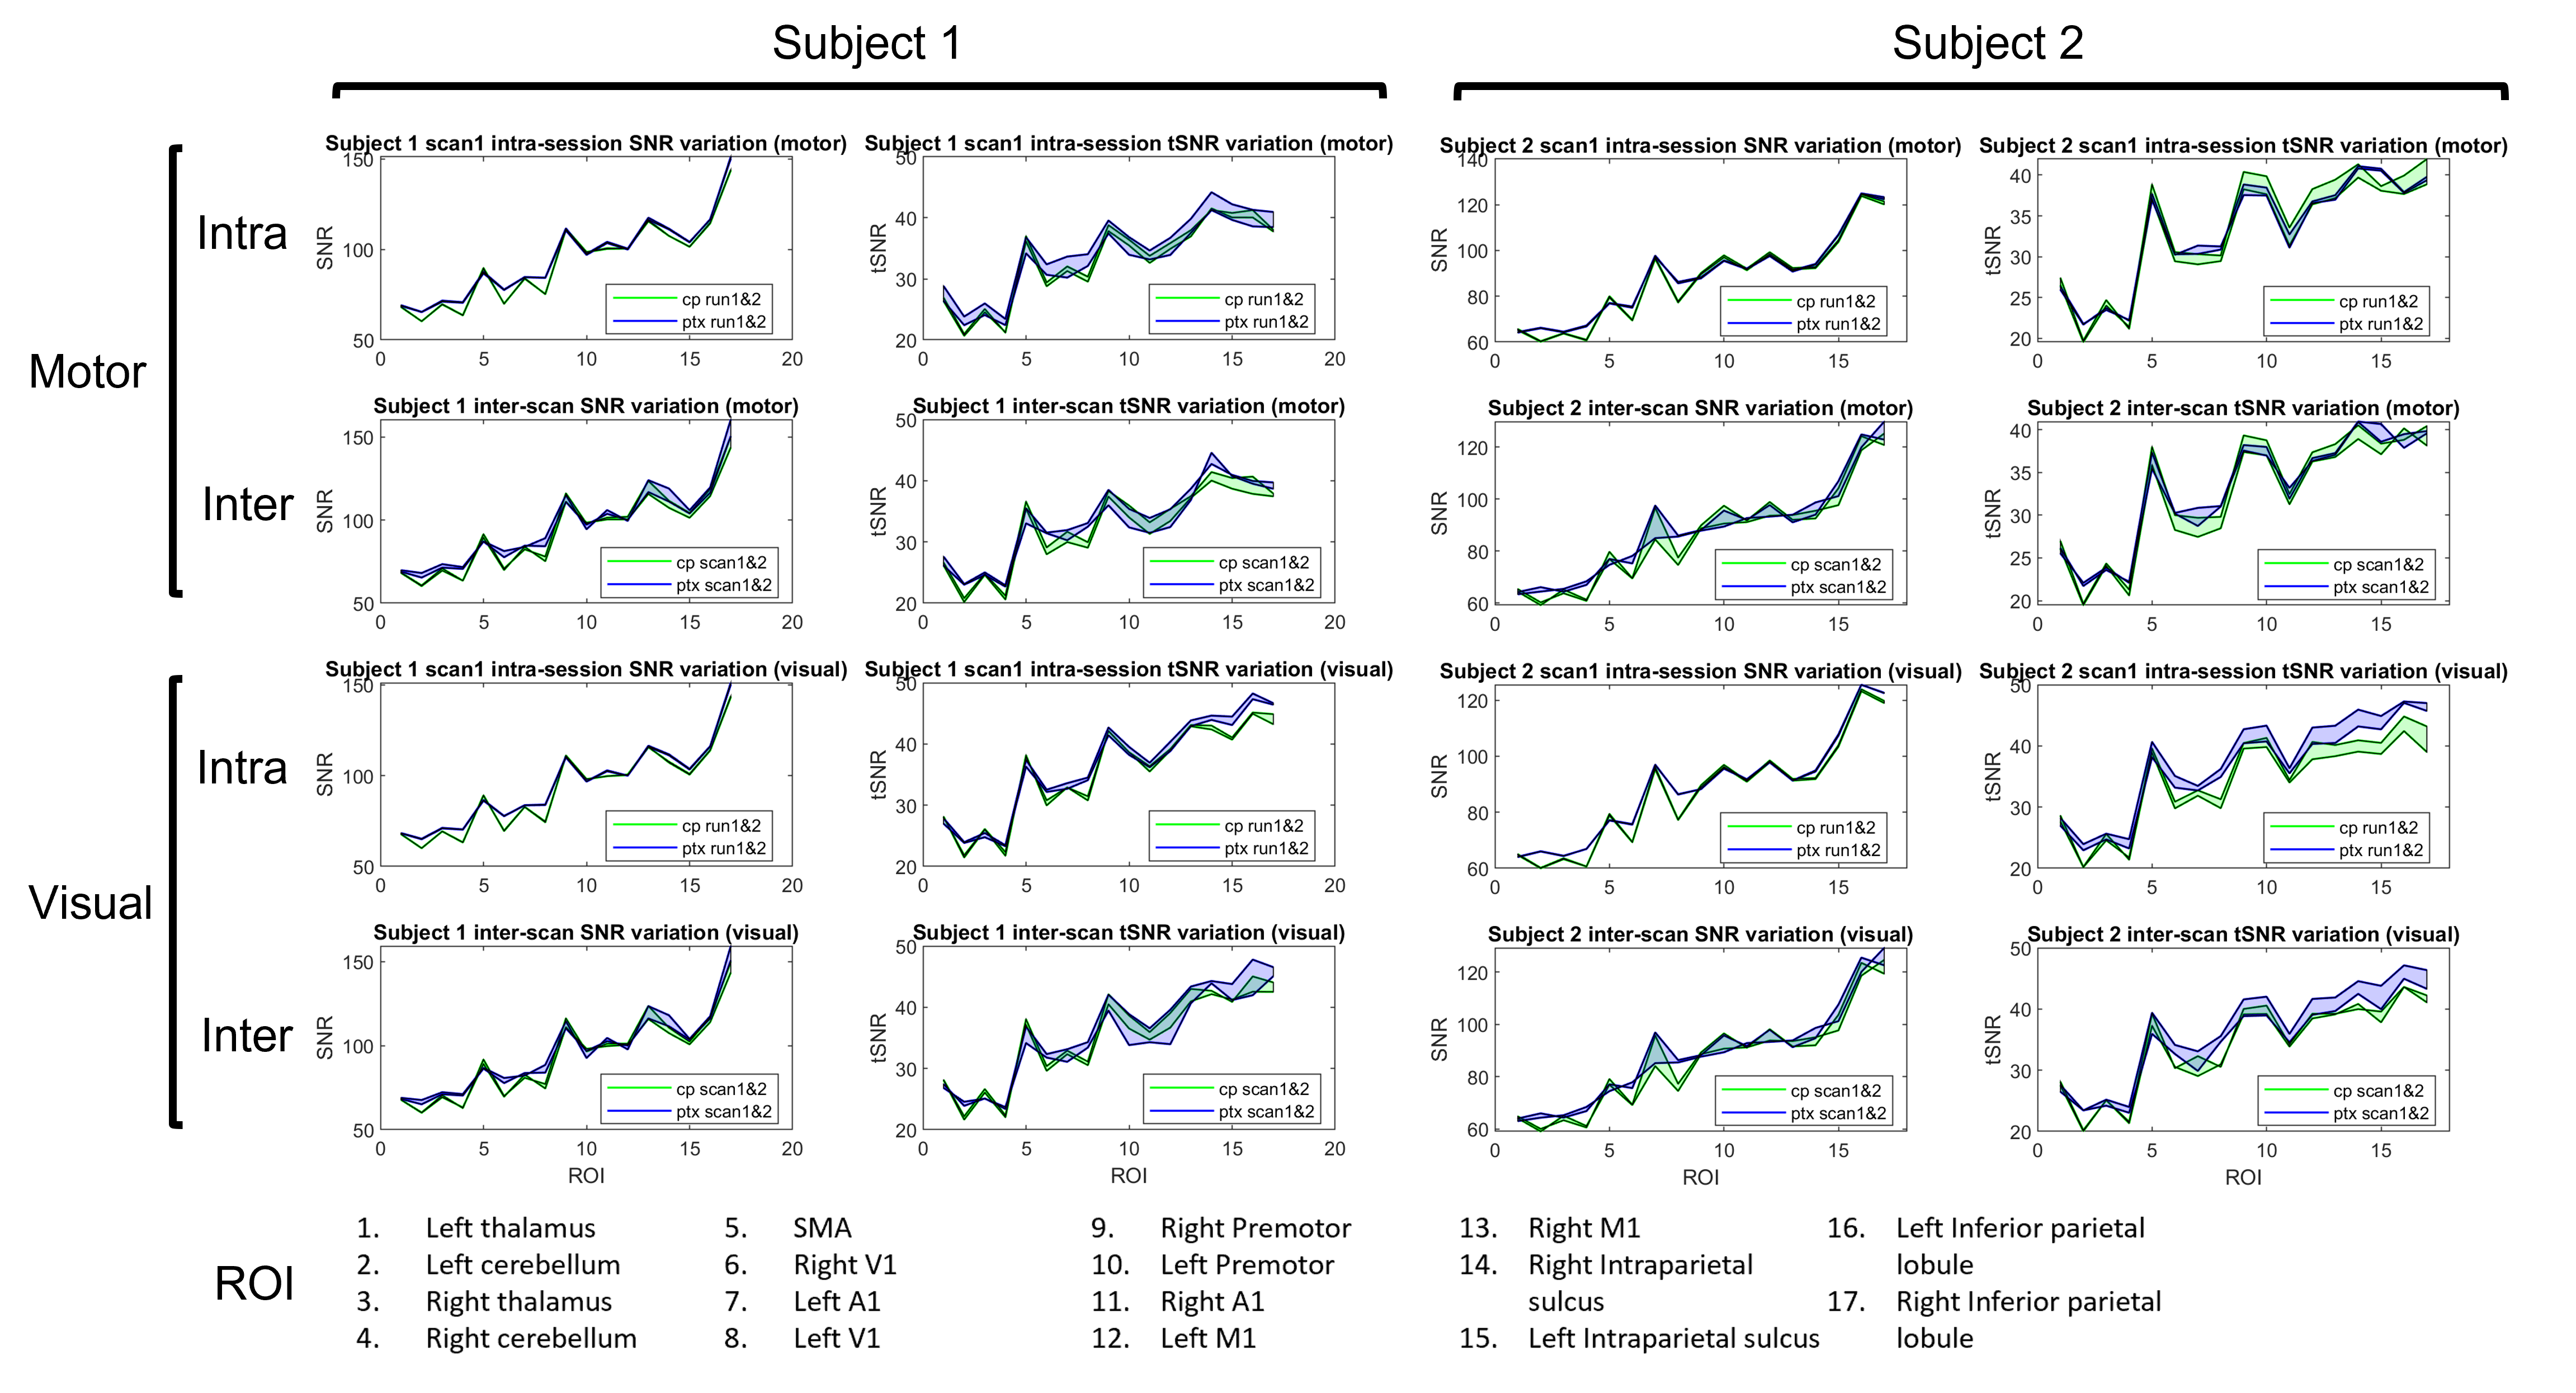
pTx improved the SNR in areas like the cerebellum and the primary visual cortex (V1), shifting their tSNRs along the asymptotic curve towards the physiological noise dominated regime (Fig.2). In ROIs with high baseline SNRs (~130), the tSNR improvements diminished (i.e., physiological noise dominated regime). For visual runs with less motion, the fitted curve positioned higher and exhibited a slightly steeper slope than motor runs. Figure 2 also demonstrates tSNR was not yet saturated in key areas, indicating the SNR gain with pTx still resulted in improved tSNR. Figure 3 shows pTx improved tSNR by up to 30% in the cerebellum during motor runs and up to 40% in V1 during visual runs, enhancing brain activity detection. In contrast, areas like thalamus showed slightly higher SNR and tSNR in CP due to high B1+ and lower T1. Therefore, pTx can evidently improve tSNR only when the SNR is greatly improved and the tSNR is not saturated.Figure 4 presents SNR/tSNRs for intra-session and inter-session runs. Intra-session runs in both CP and pTx maintained consistent SNR, with tSNR variations primarily attributable to physiological noise. Inter-scan SNR differences were higher than intra-scan due to subject relocation and different pTx pulse designs. Notably, inter-scan tSNR variations in CP and pTx were more pronounced in inferior brain regions (e.g., inferior parietal lobule ~13% with visual tasks) than the cerebellum (~3% with either task). These variations were comparable to intra-scan variations (motor) and might be influenced by ROI size or proximity to brain edges. In summary, no significant differences in inter-scan tSNR variations were observed between CP and pTx for both subjects.
Conclusion
These initial findings suggest pTx can provide improved tSNRs with reproducibility similar to conventional single channel solutions. However, it should be appreciated that the tSNR improvements in pTx is only achieved when far from the physiological noise dominated regime. Further studies with more subjects are needed to confirm these findings hold true across a larger subject set.Acknowledgements
This work was supported by ARC Future fellowship grant FT200100329. The authors acknowledge the facilities of the National Imaging Facility at the Centre for Advanced Imaging.References
1. Yacoub E, Shmuel A, Pfeuffer J, et al. Imaging brain function in humans at 7 Tesla. Magn Reson Med. 2001;45(4):588-594.
2. Uğurbil K. Magnetic resonance imaging at ultrahigh fields. IEEE Trans Biomed Eng. 2014;61(5):1364-1379.
3. Vaughan JT, Garwood M, Collins CM, et al. 7T vs. 4T: RF power, homogeneity, and signal-to-noise comparison in head images. Magn Reson Med. 2001;46(1):24-30.
4. Zhu Y. Parallel excitation with an array of transmit coils. Magn Reson Med. 2004;51(4):775-784.
5. Katscher U, Börnert P, Leussler C, van den Brink JS. Transmit SENSE. Magn Reson Med. 2003;49(1):144-150.
6. Padormo F, Beqiri A, Hajnal JV, Malik SJ. Parallel transmission for ultrahigh-field imaging. NMR Biomed. 2016;29(9):1145-1161.
7. Cloos MA, Boulant N, Luong M, et al. kT -points: short three-dimensional tailored RF pulses for flip-angle homogenization over an extended volume. Magn Reson Med. 2012;67(1):72-80.
8. Triantafyllou C, Hoge RD, Krueger G, et al. Comparison of physiological noise at 1.5 T, 3 T and 7 T and optimization of fMRI acquisition parameters. Neuroimage. 2005;26(1):243-250.
9. Wu X, Auerbach EJ, Vu AT, et al. Human Connectome Project-style resting-state functional MRI at 7 Tesla using radiofrequency parallel transmission. Neuroimage. 2019;184:396-408.
10. Ding B, Dragonu I, Rua C, et al. Parallel transmit (pTx) with online pulse design for task-based fMRI at 7 T. Magn Reson Imaging. 2022;93:163-174.
11. Eggenschwiler F, Kober T, Magill AW, et al. SA2RAGE: a new sequence for fast B1+ -mapping. Magn Reson Med. 2012;67(6):1609-1619.
12. Smith SM. Fast robust automated brain extraction. Hum Brain Mapp. 2002;17(3):143-155.
13. Löwen D, Pracht ED, Stirnberg R, et al. Interleaved binomial kt-points for water-selective imaging at 7T. Magn Reson Med. 2022;88(6):2564-2572.
14. Setsompop K, Wald LL, Alagappan V, et al. Magnitude least squares optimization for parallel radio frequency excitation design demonstrated at 7 Tesla with eight channels. Magn Reson Med. 2008;59(4):908-915.
15. Grissom W, Yip CY, Zhang Z, et al. Spatial domain method for the design of RF pulses in multicoil parallel excitation. Magn Reson Med. 2006;56(3):620-629.
16. Marques JP, Kober T, Krueger G, et al. MP2RAGE, a self bias-field corrected sequence for improved segmentation and T1-mapping at high field. Neuroimage. 2010;49(2):1271-1281.
17. Jin J, Tourell M, Sati P, et al. Segmented 3D EPI with CAIPIRINHA for Fast, High-Resolution T2*-Weighted Imaging. Proc. Annu. Meeting ISMRM, 2021;Abstract #4190.
18. Tourell M, Jin J, Stewart A, et al. Submillimeter, Sub-Minute Quantitative Susceptibility Mapping using a Multi-Shot 3D-EPI with 2D CAIPIRINHA Acceleration. Proc. Annu. Meeting ISMRM, 2021;Abstract #0787.
19. Friston K, et al. Statistical Parametric Mapping: The Analysis of Functional Brain Images. London: Academic Press 2011.
Figures