3285
POSE: POSition Encoding for accelerated MRI1Martinos Center for Biomedical Imaging, Harvard Medical School, Charlestown, MA, United States
Synopsis
Keywords: New Trajectories & Spatial Encoding Methods, New Trajectories & Spatial Encoding Methods
Motivation: Quantitative MRI requires multiple acquisitions to sufficiently characterize a biophysical-model of interest, resulting in long scan times.
Goal(s): Propose a new general strategy for accelerating MRI using subvoxel-shifting as a means of encoding.
Approach: POSition Encoding (POSE) applies unique subvoxel-shifts along the acquisition parameter dimension, which is combined with a biophysical-model to generate accelerated and enhanced resolution biophysical-parameter maps. Using T1 quantification as an application, POSE was validated both numerically and experimentally.
Results: Results show that POSE 1) generates quantitative maps that agree well with the reference method, 2) has robust noise performance and 3) is applicable to any biophysical-model of interest.
Impact: POSE combines subvoxel-scale spatial encoding with biophysical-models to achieve enhanced resolution with acceleration. Its ease of implementation, robust noise performance and versatility makes it an attractive framework applicable to any quantitative biophysical-model of interest.
Introduction
There has been a perpetual effort to increase the acquisition efficiency of MRI1,2,3,4,5. Quantitative MRI necessitates multiple acquisitions to characterize the biophysical model of interest. Model-based reconstruction6,7 employs MR-physics models to exploit multi-coil data redundancy and accelerate quantitative estimation whereas MR-fingerprinting8 uses the concept of pattern recognition. Although different in approach, both methods accomplish acceleration mostly in-plane. Through-plane acceleration methods such as simultaneous-multi-slice9,10 and super-resolution11,12 have unique advantages and can complement in-plane acceleration methods. However, they often require specialized sequence components and modifications which are nontrivial. Here we present a new method of encoding combining subvoxel-scale spatial encoding with biophysical-models to achieve enhanced resolution with acceleration called POSition Encoding (POSE).Theory
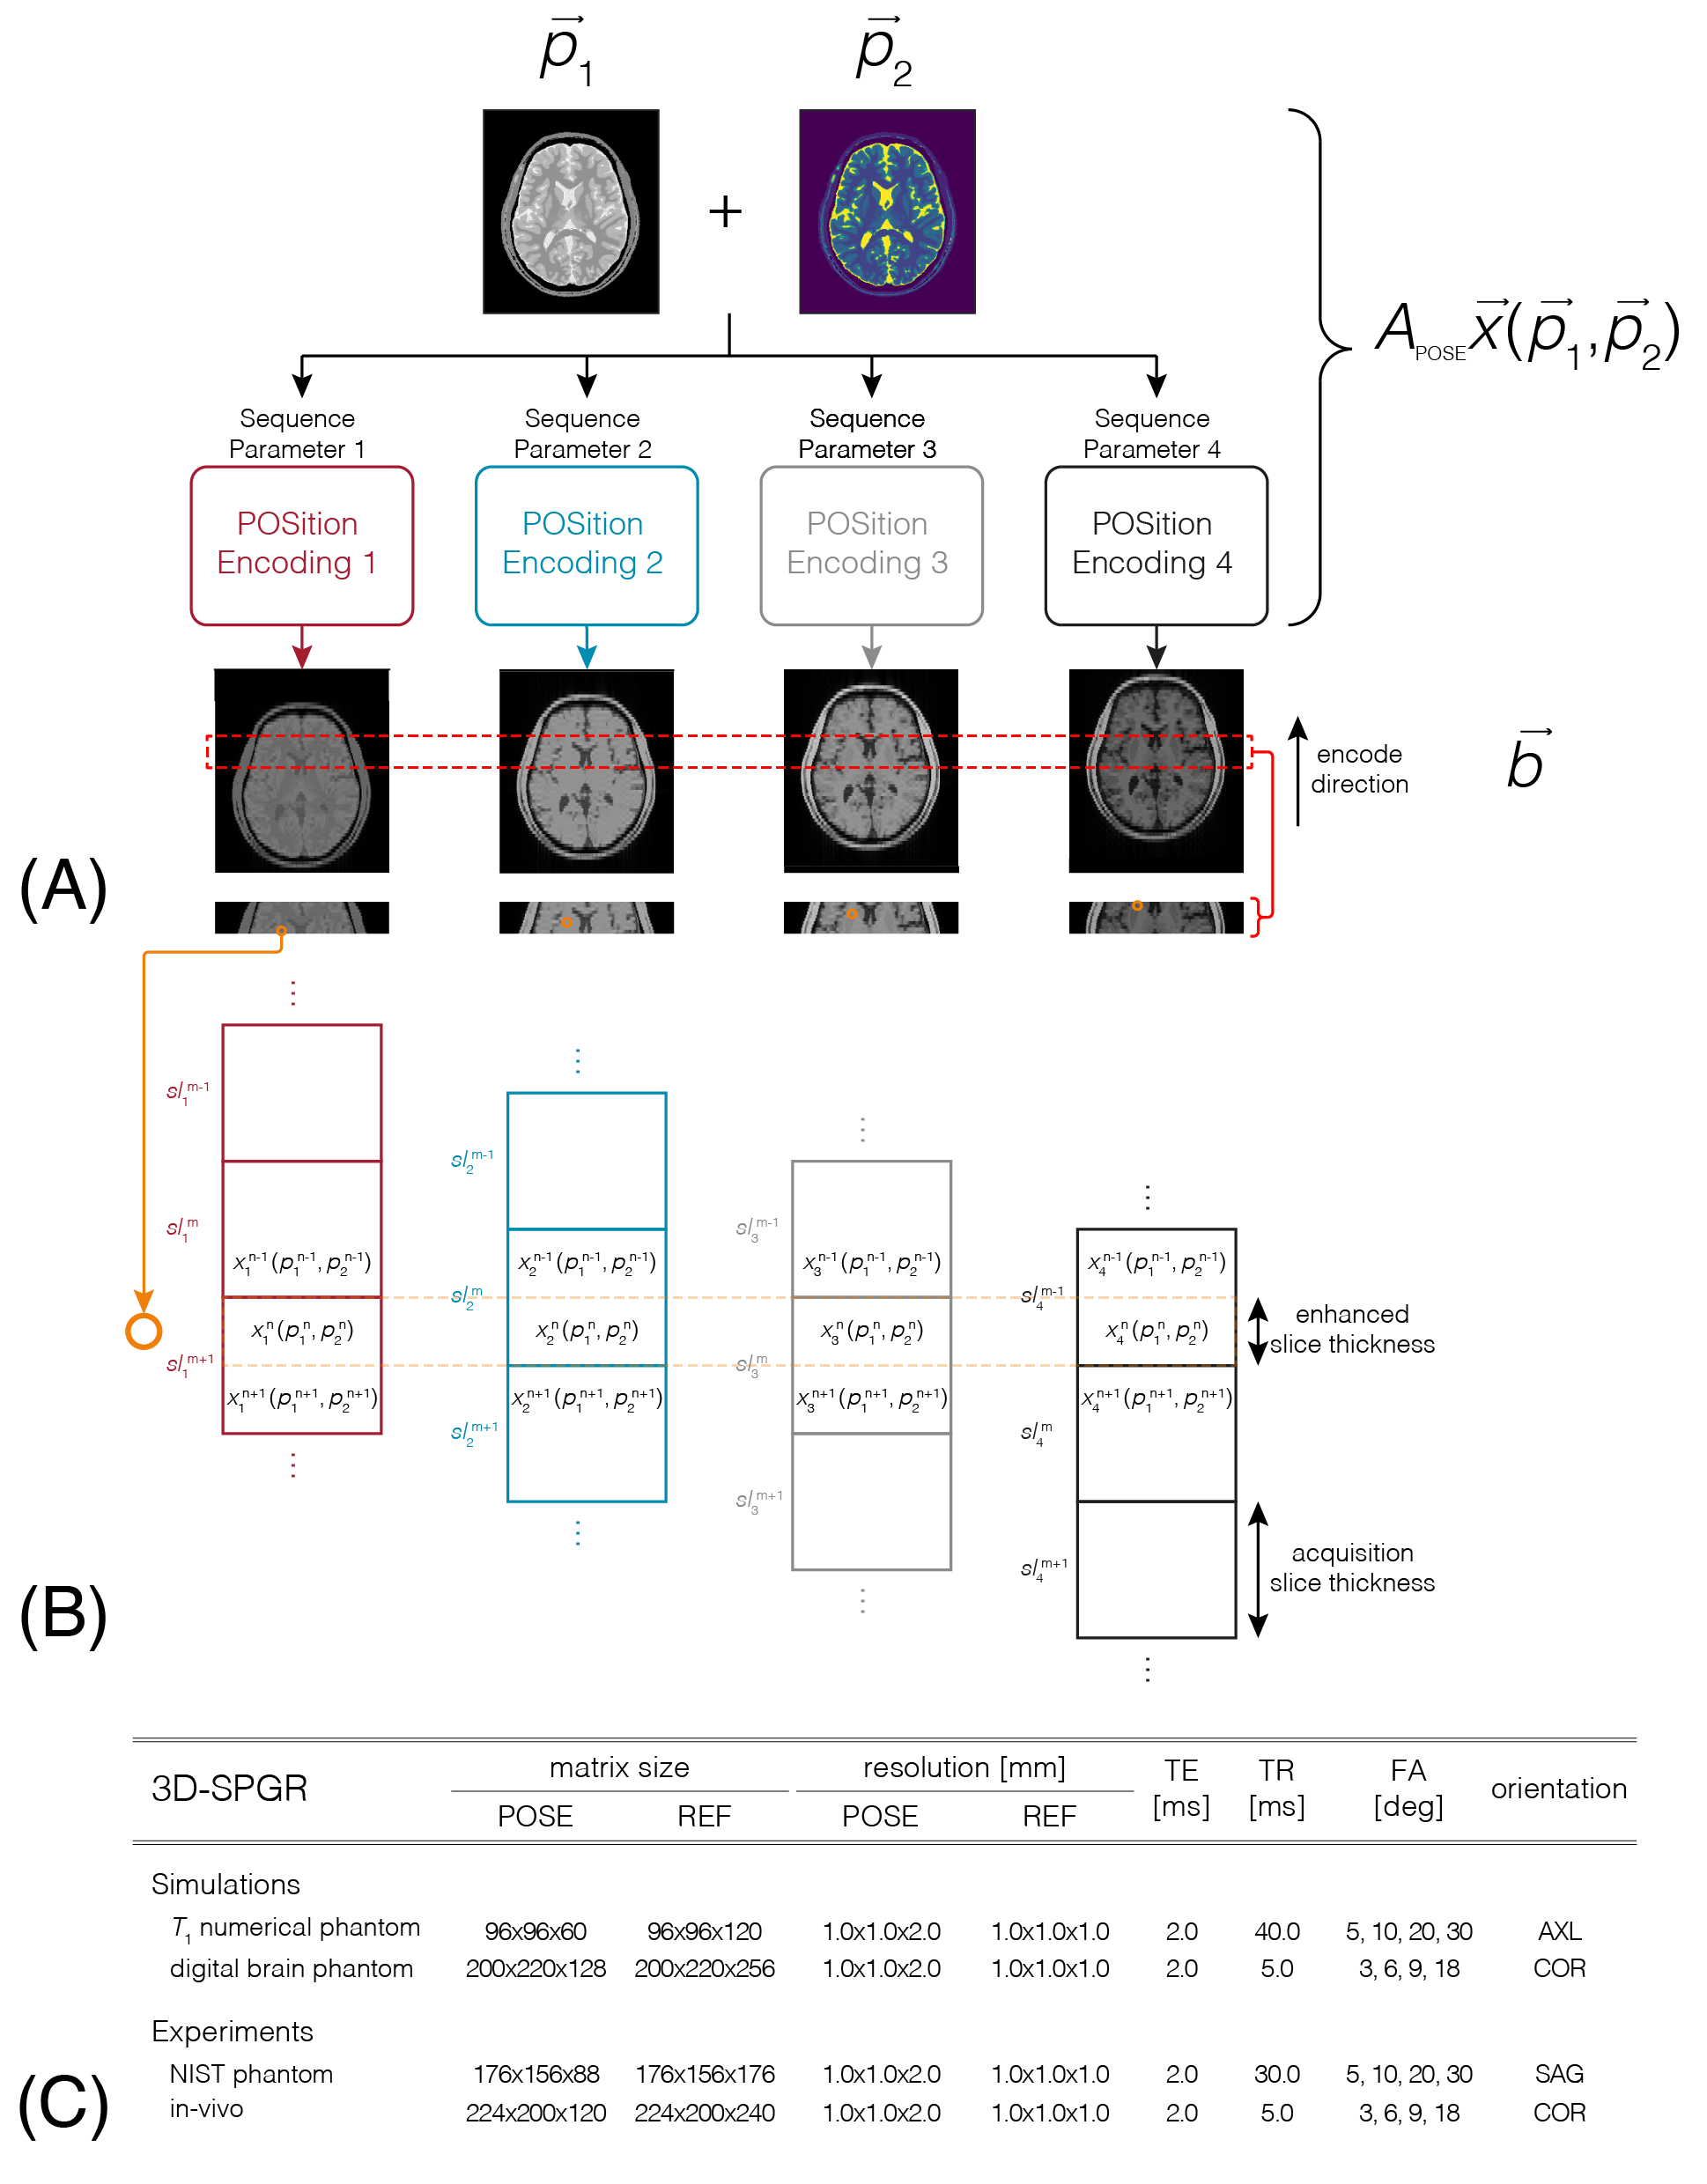
POSE leverages the multi-acquisition required for biophysical-parameter estimation by introducing subvoxel-shifts as additional encoding. Referring to FIG1A, POSE applies unique subvoxel-shifts along an arbitrary direction (in this case anterior-posterior direction) at each acquisition. Combining different contrast acquisitions with unique subvoxel-shifts, the governing biophysical-model $$$\overrightarrow{x}(\overrightarrow{p}_1,\overrightarrow{p}_2)$$$ is employed to extract subvoxel biophysical-parameter information. Simply, by strategically positioning subvoxel spins as a constitute of different voxels for each acquisition (FIG1B), the known biophysical-model, acquisition parameters and voxel where each subvoxel is positioned is utilized to extract the spin’s biophysical-parameter. In its general form, this is expressed $$$\overrightarrow{y}_k=A_\text{POSE}^k\overrightarrow{x}_k(\overrightarrow{p})+\overrightarrow{\eta}_k$$$, where $$$\overrightarrow{x}_k(\overrightarrow{p})$$$ is the length $$$n_x$$$ enhanced biophysical-model image obtained from spatially dependent biophysical-parameters $$$\overrightarrow{p}$$$ and acquisition parameter $$$k$$$, $$$A_\text{POSE}^k$$$ is the POSition Encoding matrix for acquisition parameter $$$k$$$, $$$\overrightarrow{y}_k$$$ is the length $$$n_y$$$ acquired image (<$$$n_x$$$) and $$$\overrightarrow{\eta}_k$$$ is noise of same length. $$$\overrightarrow{p}$$$ can consist of multiple parameters, each length $$$n_x$$$, resulting in length $$$n_pn_x$$$, where $$$n_p$$$ is the number of parameters. The L2 norm of the residuum of the above equation can be invoked to estimate $$$\overrightarrow{p}$$$ that minimizes the resulting cost function.Methods
POSE was validated using the vFA signal-model13 $$$\overrightarrow{x}_k^\text{vFA}=\overrightarrow{\rho}\frac{1-e^{-TR/\overrightarrow{T}_1}}{1-e^{-TR/\overrightarrow{T}_1}\text{cos}(\alpha_k)}\text{sin}(\alpha_k)$$$ as a vehicle with shifts applied along the slice-dimension, where Bloch-simulations and experiments, both ex-vivo and in-vivo, were performed using a 3D-SPGR sequence with 4 flip angle (FA) acquisitions, detailed in FIG1C. For all POSE simulations/acquisitions, 0.0/1.0/2.0/3.0mm shifts were applied along the slice FOV for each FA. Additional reference (REF) simulations/acquisitions were executed using identical sequence parameters but omitting shifts and doubling the slice resolution and simulation/acquisition time. Bloch-simulations: A numerical $$$\overrightarrow{T}_1$$$ phantom composed of 5 $$$\rho/T_1$$$ combinatory compartments reflecting white/grey matter was simulated14 to validate the feasibility of POSE. To validate POSE for in-vivo situations, a realistic numerical brain phantom15 consisting of 10 tissue compartments was also simulated. Experiments: NIST phantom16 experiments were performed to validate POSE for multicoil acquisition. in-vivo human brain experiments were conducted on a healthy volunteer. 3T Siemens Prisma with 20-channel head coil was used for all experiments. Noise Performance: Monte-Carlo simulations with noise generated using the pseudo-multiple-replica-method17 added to in-vivo data was executed to investigate POSE's noise performance. The g-factor was evaluated using18 $$$g_{\rho,T_1}=\frac{\sigma_\text{REF}^{\rho,T_1}}{\sigma_\text{POSE}^{\rho,T_1}\sqrt{acc}}$$$, where $$$\sigma_\text{REF}^{\rho,T_1}/\sigma_\text{POSE}^{\rho,T_1}$$$ are the standard deviations of $$$\rho,T_1$$$ using REF/POSE measured from Monte-Carlo simulations ($$$N$$$=100) and $$$acc$$$ the acceleration factor. For comparison, Monte-Carlo simulations were executed for through-plane GRAPPA ($$$acc$$$=2) and in-plane GRAPPA followed by POSE reconstruction ($$$acc$$$=4).Results and Discussion
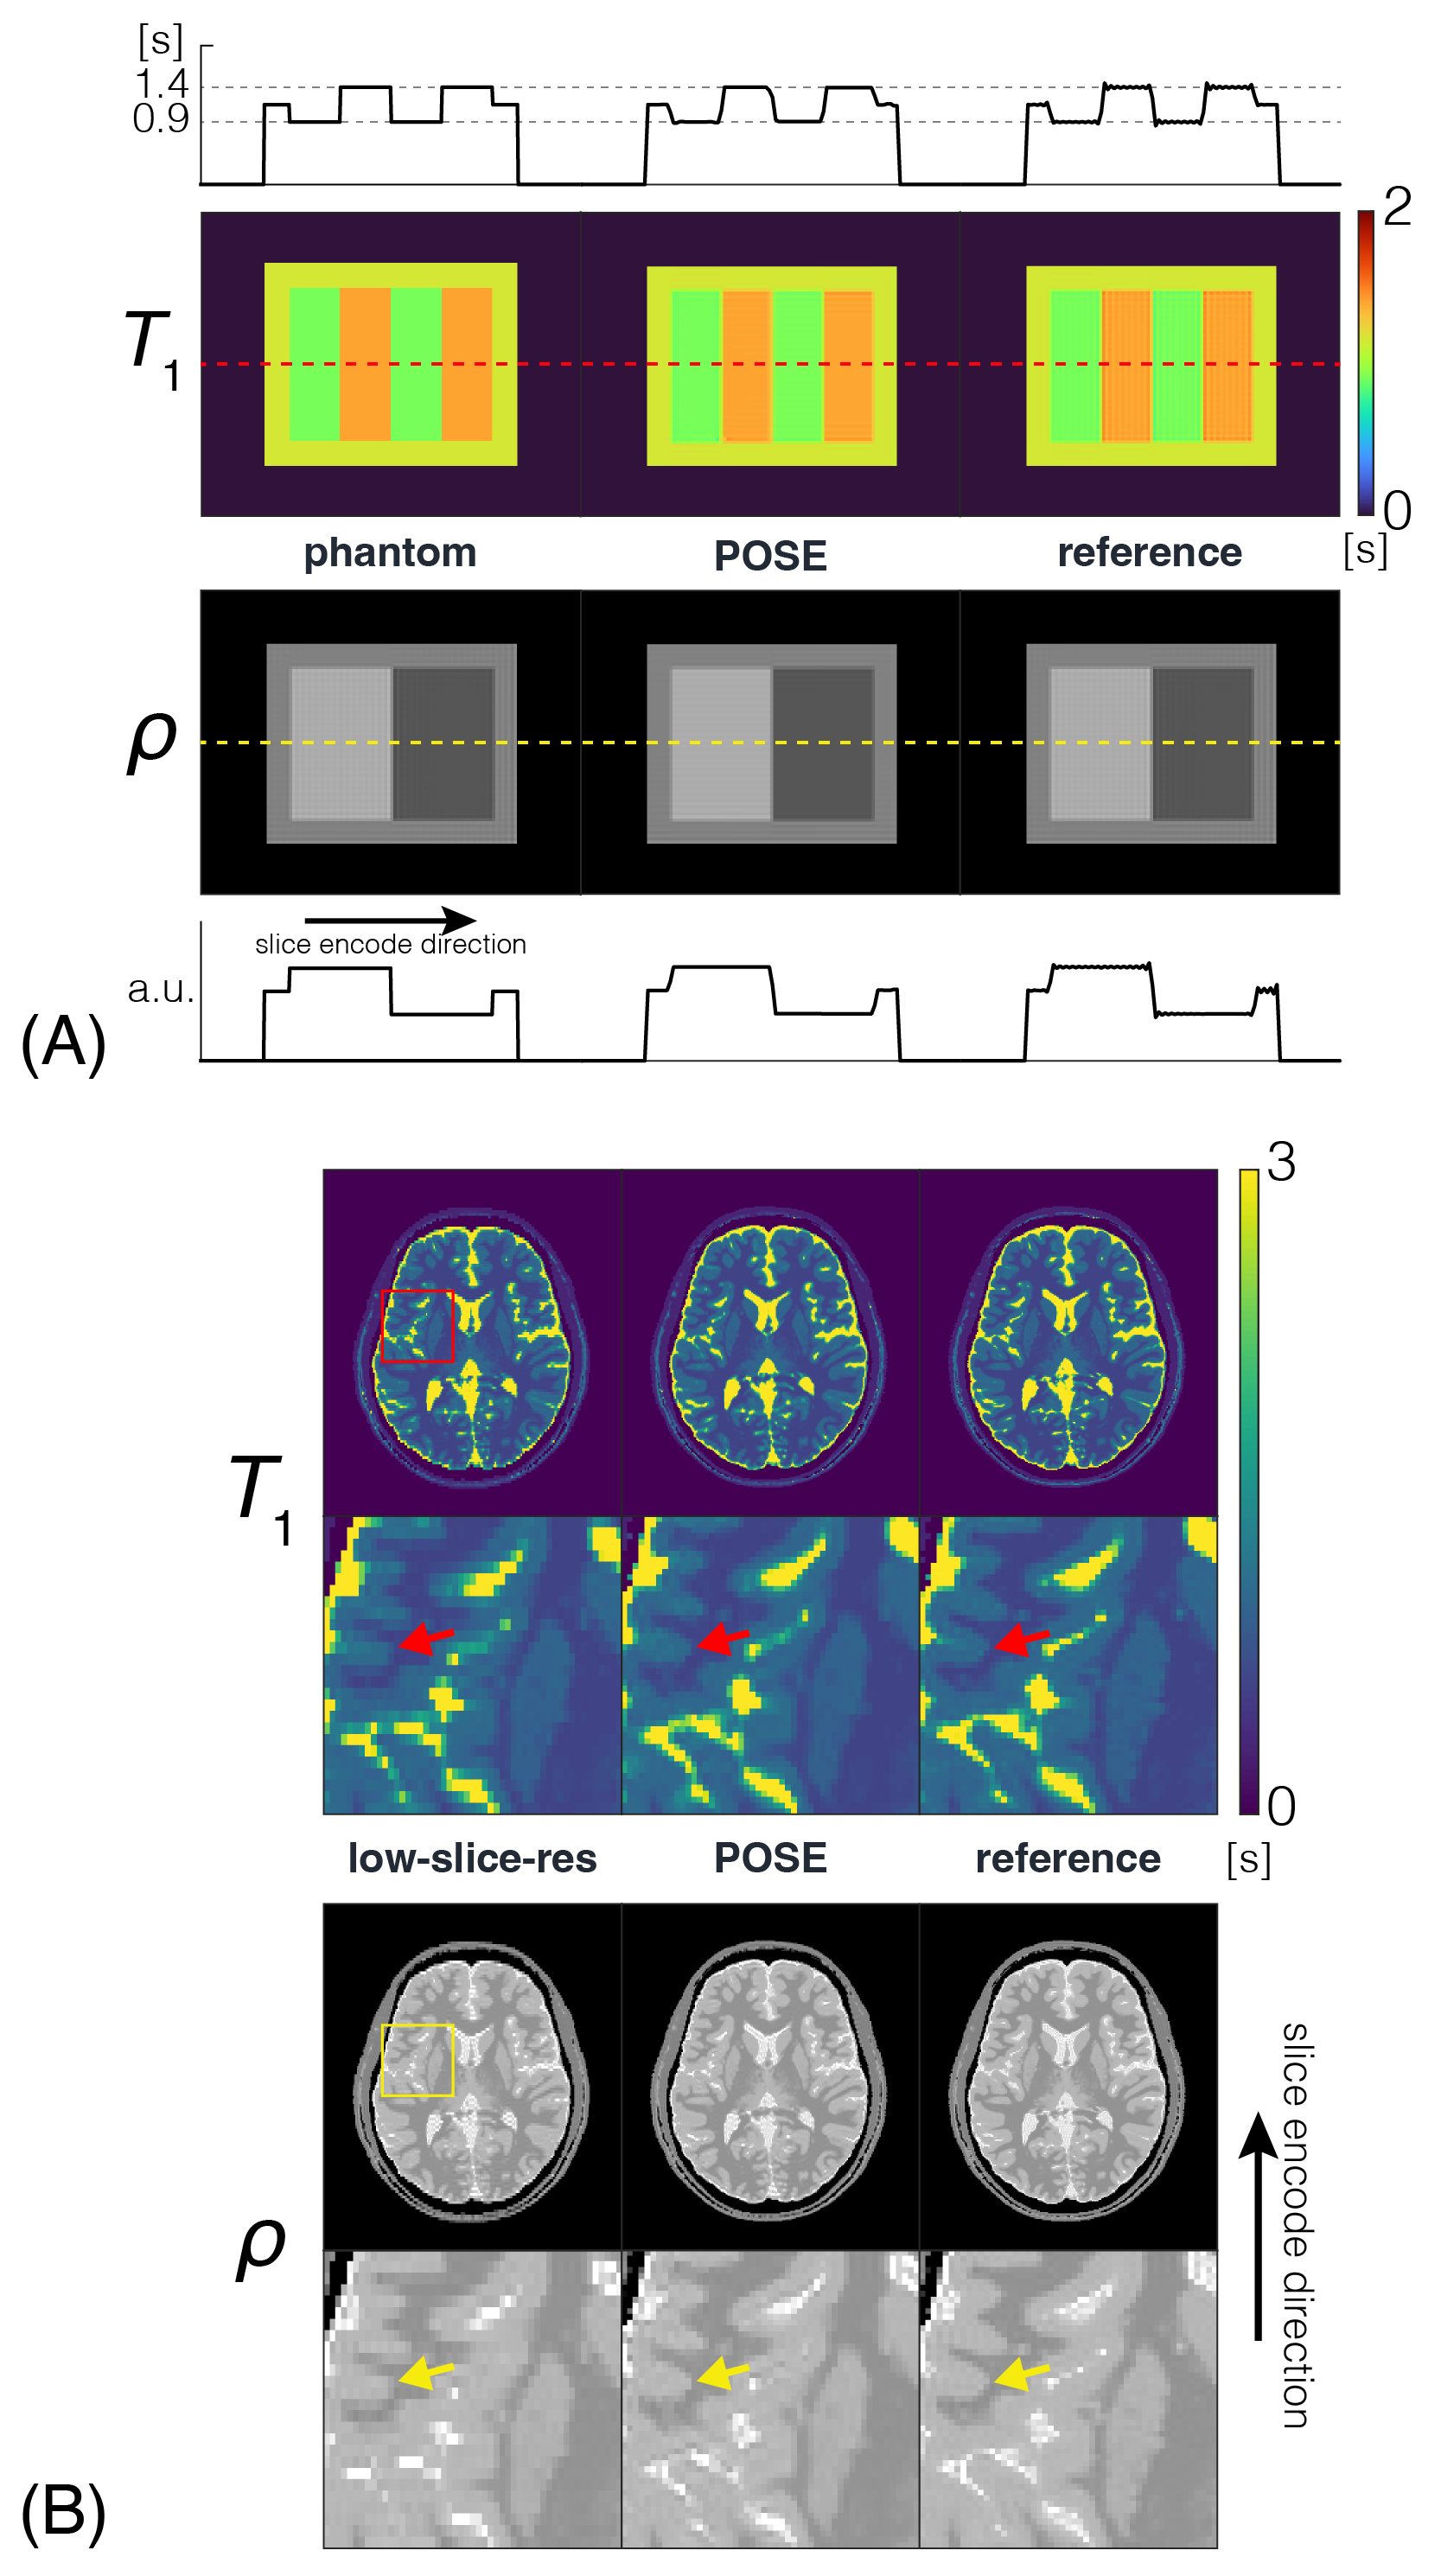
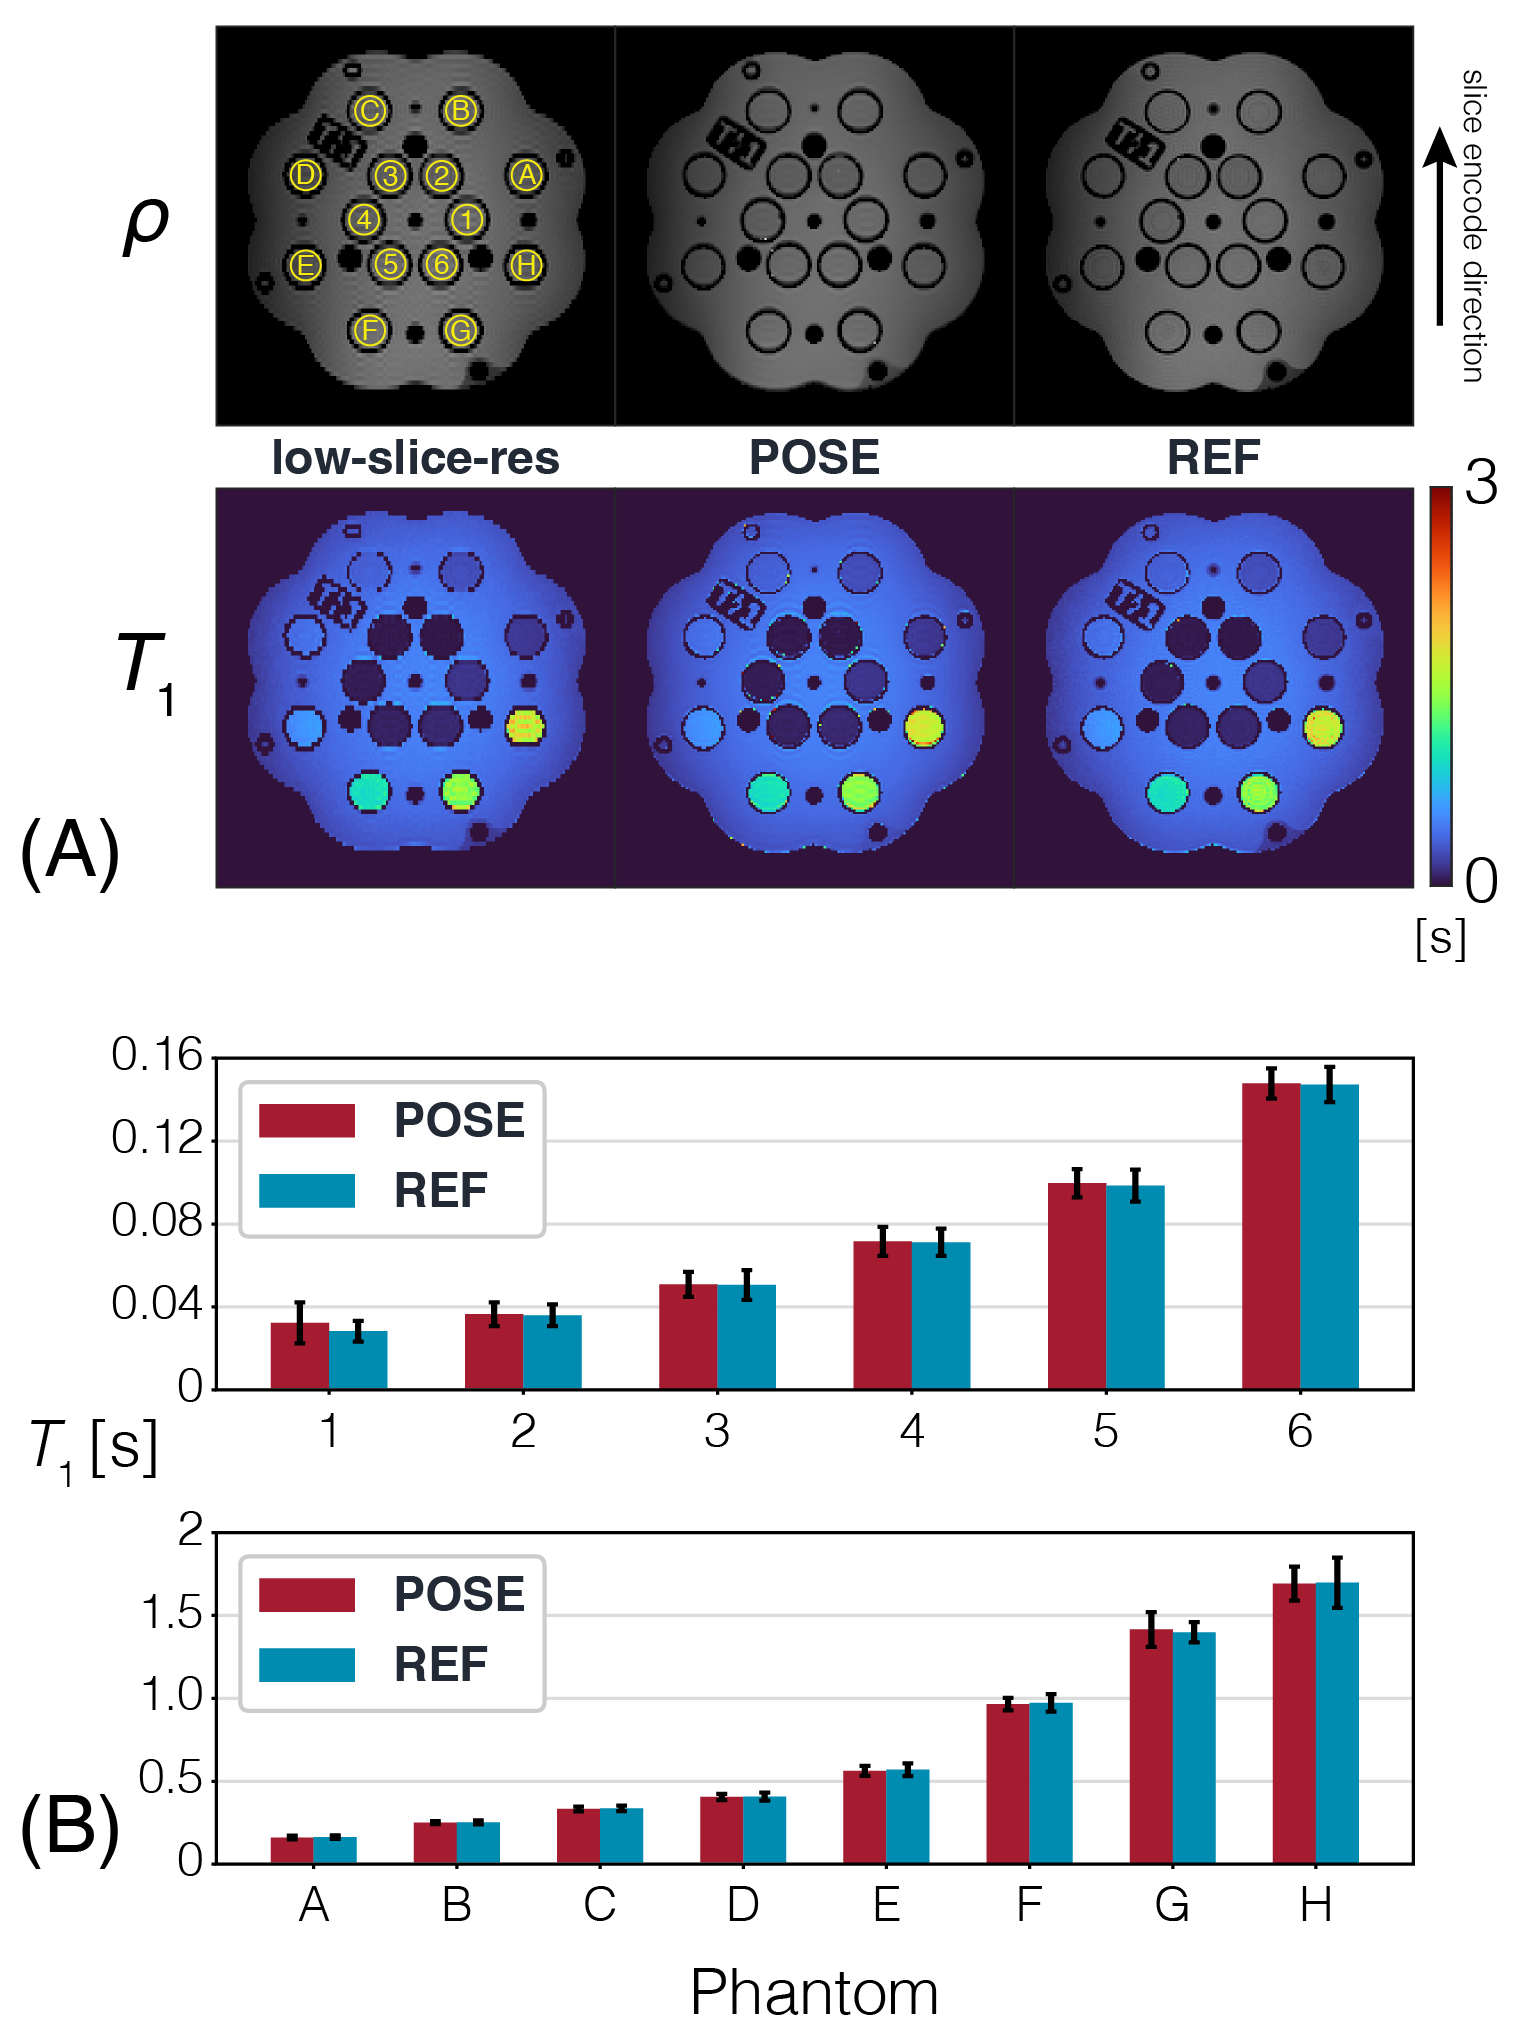
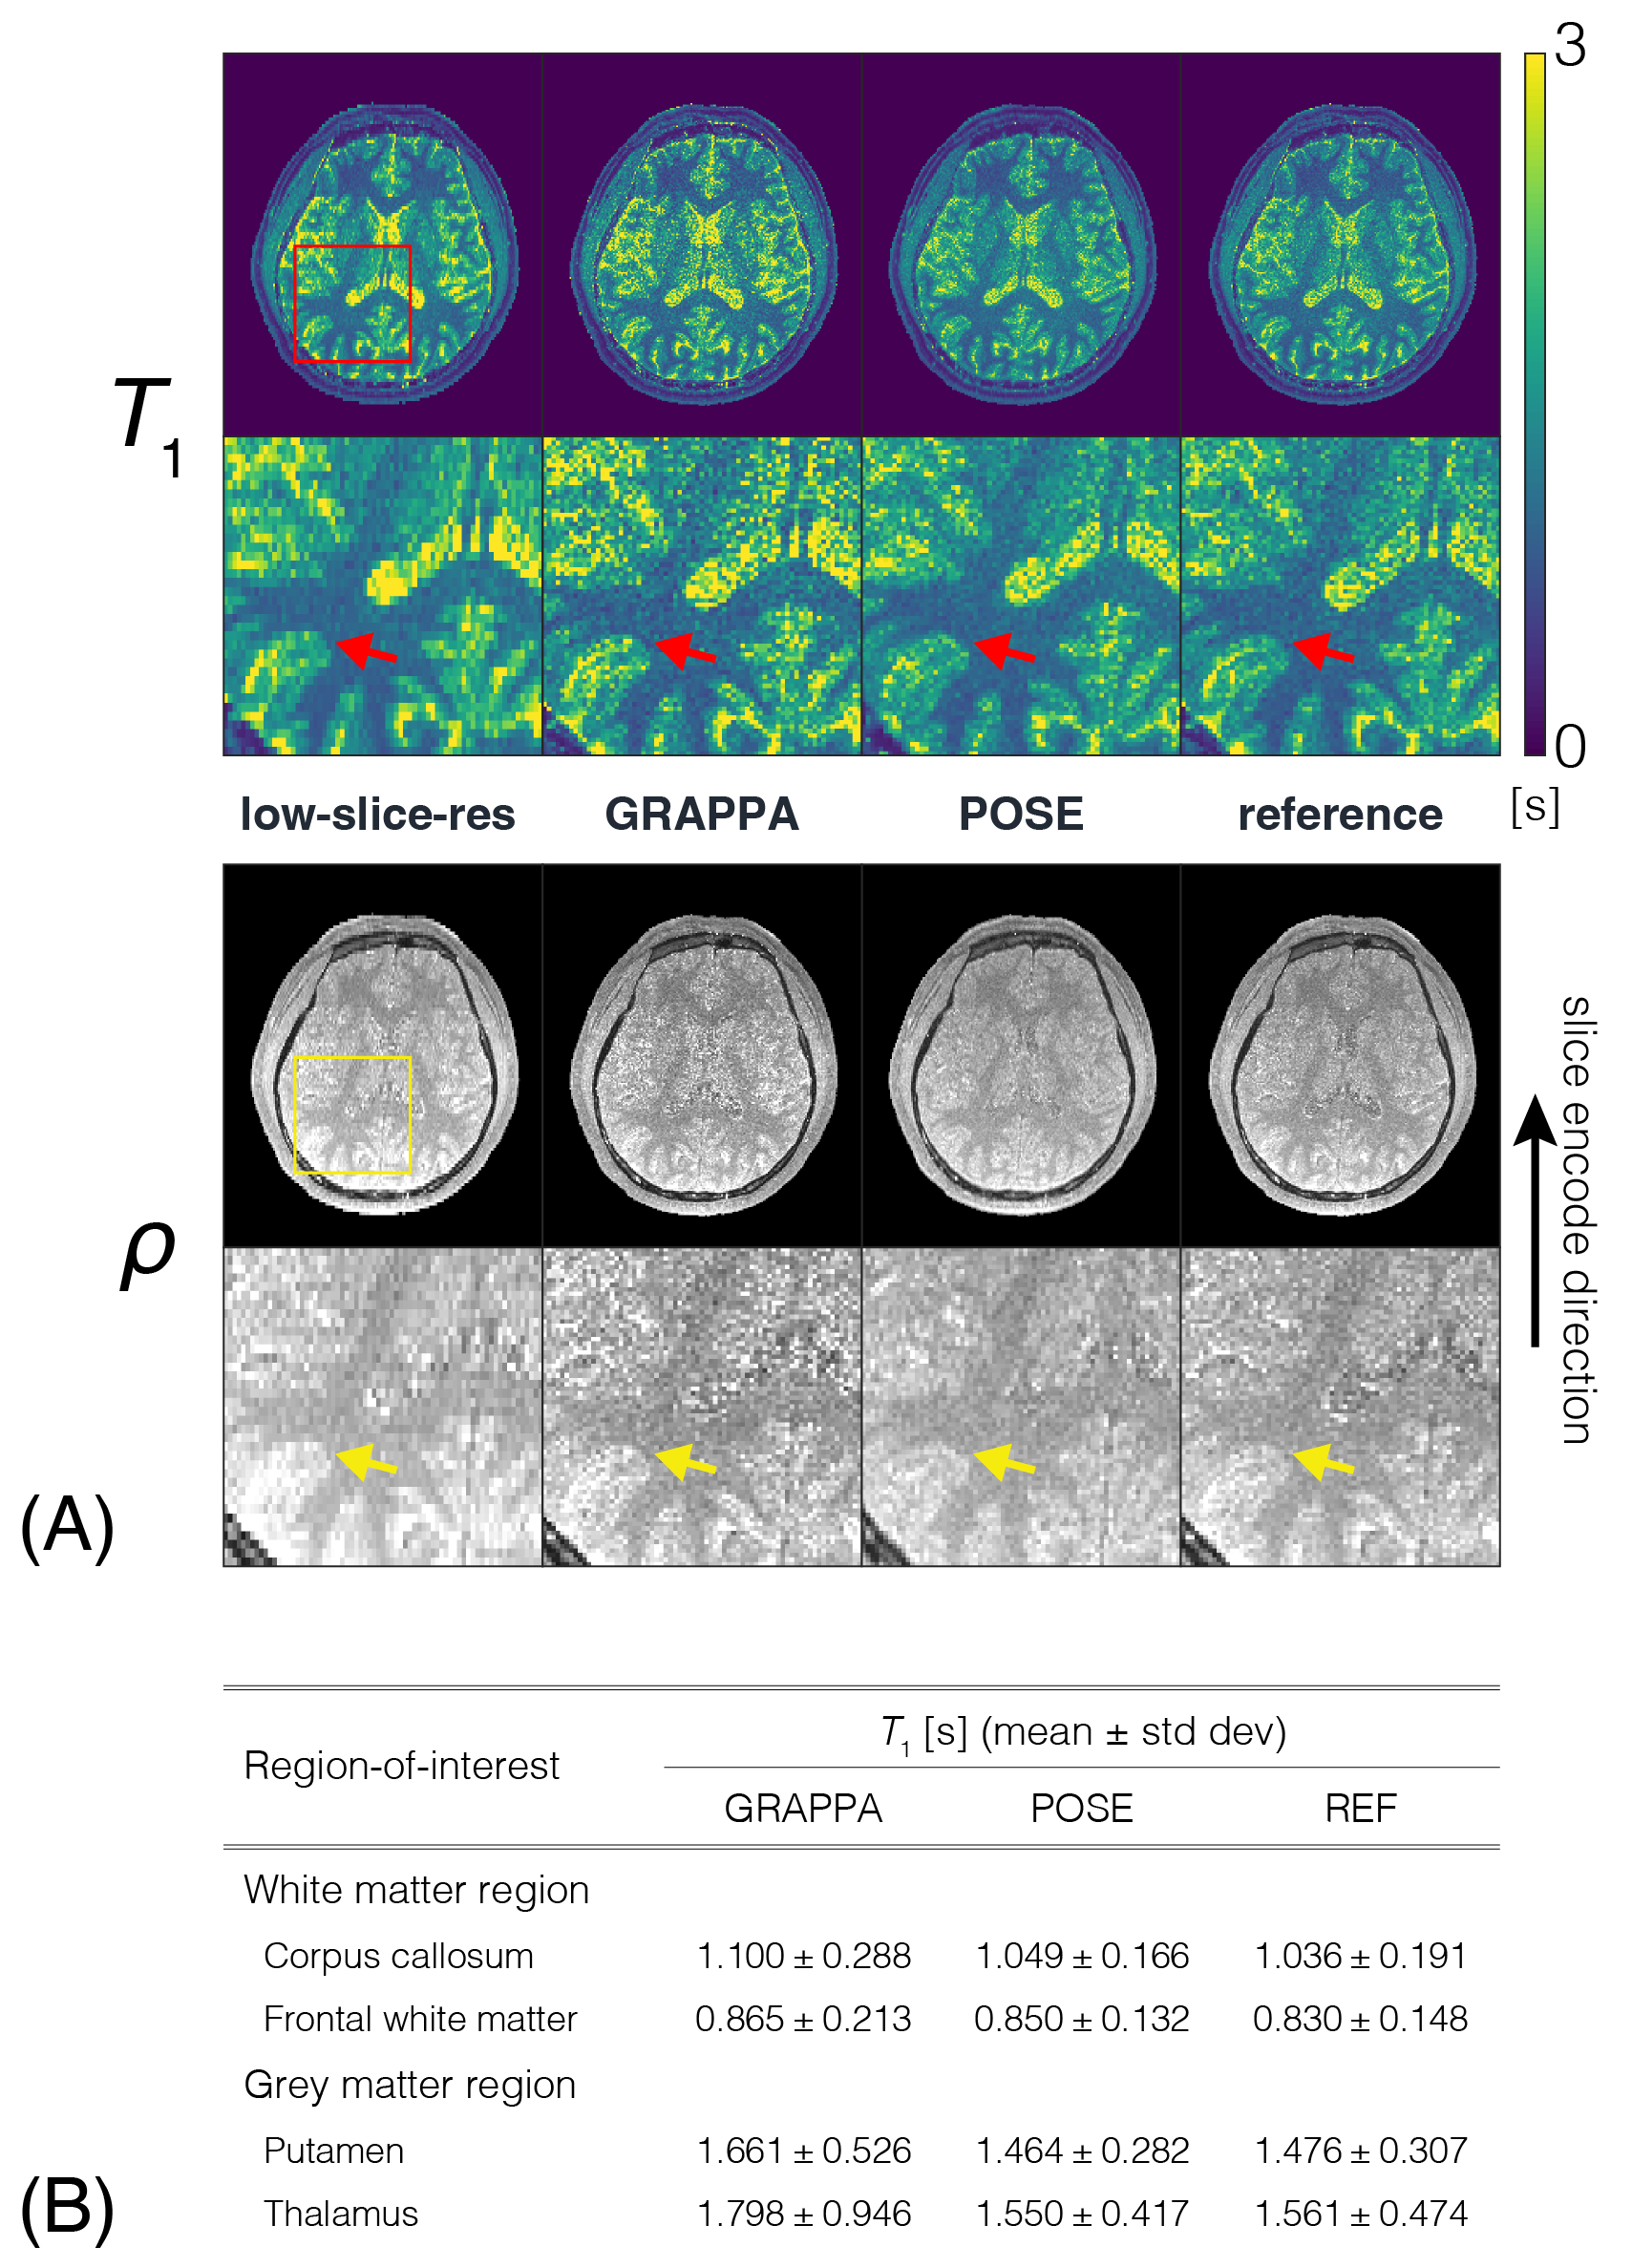
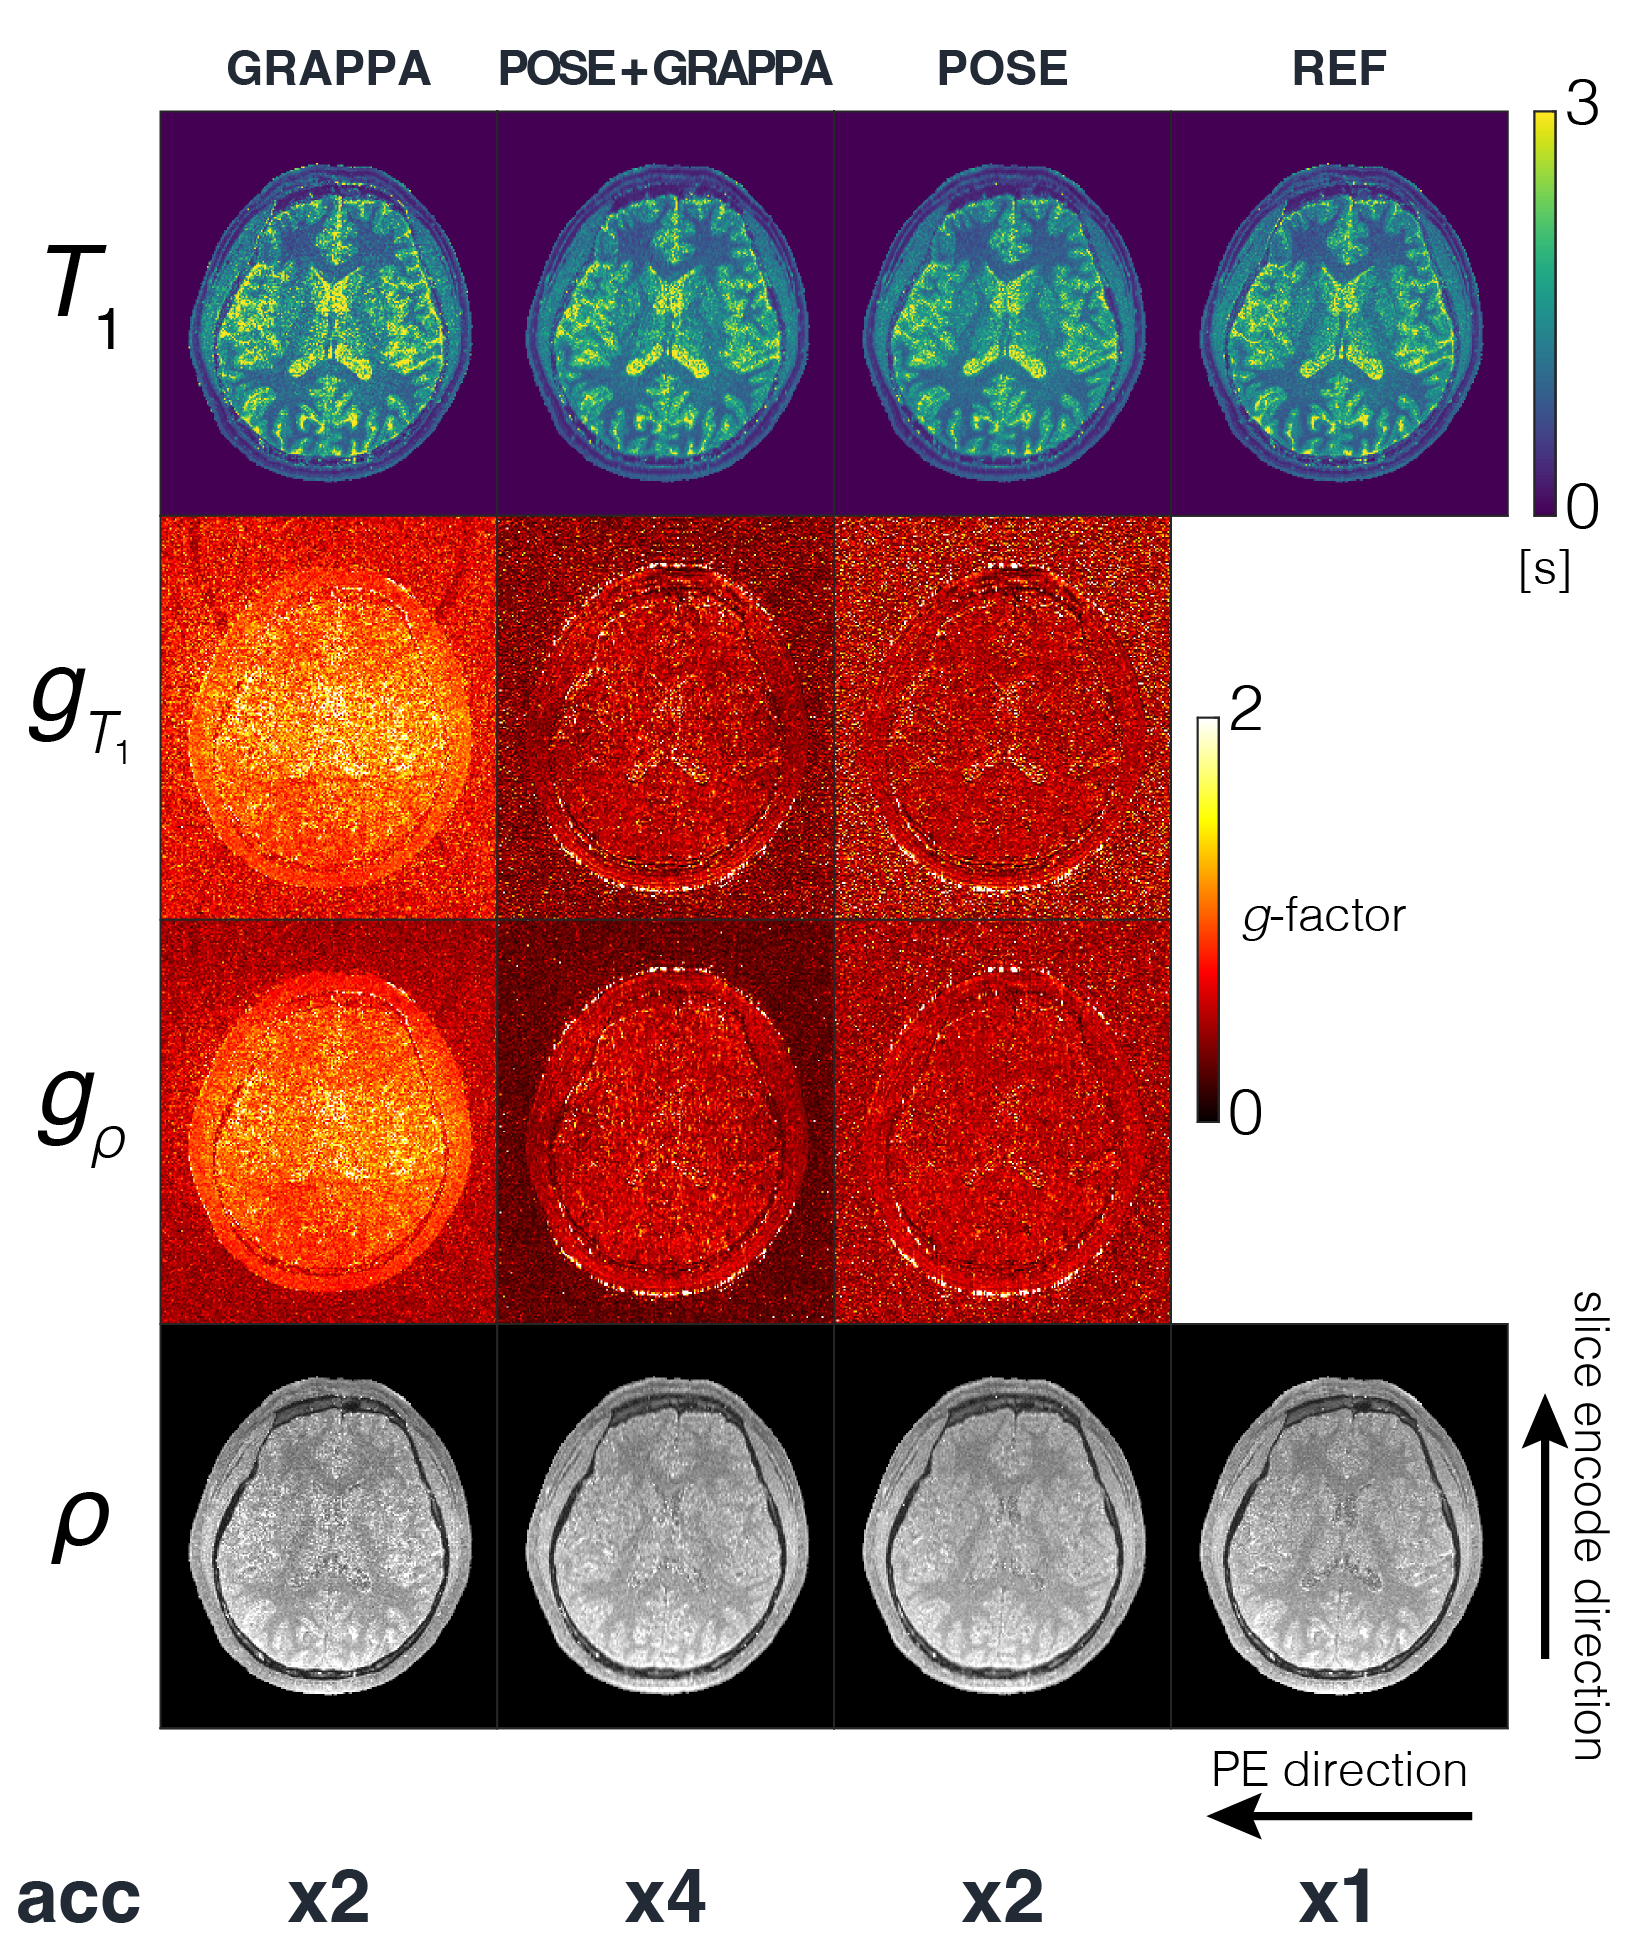
POSE $$$\overrightarrow{T}_1/\rho$$$ maps obtained from simulations of the $$$\overrightarrow{T}_1$$$ phantom (FIG2A) concur not only with REF, but with ground-truth phantom as well, evident by the line profiles. Digital-brain phantom (FIG2B) results also show good agreement with REF, removing the blocky texture of low-slice-resolution while preserving the distinct boundary between white matter/grey matter indicated by the red/yellow arrows, thus validating our method both theoretically and for realistic situations. POSE quantitative maps from ex-vivo experiments (FIG3A) show excellent agreement, whereby the ROI analysis performed over the different spherical $$$\overrightarrow{T}_1$$$ arrays showed POSE estimated mean $$$\overrightarrow{T}_1$$$ being within 1.65% of the REF estimated mean with the exception of sphere 1 (FIG3B). POSE quantitative maps from in-vivo experiments (FIG4A) show good agreement with REF, preserving the distinct boundaries (red/yellow arrows) as observed in the digital-brain phantom, and appearing less noisy than through-plane GRAPPA using identical $$$acc$$$=2. $$$\overrightarrow{T}_1$$$ mean and standard deviation taken from representative brain regions (FIG4B) further confirms this, with POSE showing best agreement with REF and GRAPPA showing highest standard deviation due to SNR. Noise performance results (FIG5) show that at identical $$$acc$$$=2, POSE outperforms GRAPPA in terms of uniformity and overall lower value of the g-factor maps. Even at higher $$$acc$$$=4, POSE+GRAPPA g-factor maps outperform GRAPPA using lower $$$acc$$$=2. This is attributed to POSE benefiting from using greater slice thicknesses or higher SNR signal in its reconstruction pipeline, enabling robust noise performance.Conclusion
POSE accelerates and enhances the resolution of quantitative maps with robust noise performance.Acknowledgements
We thank the funding support from NIBIB R21EB031185, NIAMS R01AR079442, R01AR081344 and R56AR081017.References
[1] Pruessmann K, Magn Reson Med 1999;42:952-962, [2] Griswold M, Magn Reson Med 2002;47:1202-1210, [3] Lustig M, Magn Reson Med 2007;58:1182-1195, [4] Akcakaya M, Magn Reson Med 2019;81:439-453, [5] Liu F, Magn Reson Med 2021;85(6):3211-3226, [6] Fessler J, IEEE Signal Process Mag 2010;27(4):81-89, [7] Block KT, IEEE Trans Med Imaging 2009;28:1759-1769, [8] Ma D, Nature 2013;495:187-192, [9] Moeller S, Magn Reson Med 2009;63:1144-1153, [10] Setsompop K, Magn Reson Med 2018;79(1):141-151, [11] Plenge E, Magn Reson Med 2012;68(6):1983-1993, [12] Bano W, Magn Reson Med 2020;83(3):906-919, [13] Fram EK, Magn Reson Imaging 1987;5(3):201-208, [14] Liu F, IEEE Trans Med Imaging 2017;36(2):527-537, [15] Aubert-Broche B, Neuroimage 2006;32(1):138-145, [16] Stupic KF, Magn Reson Med 2021;86(3):1194-1211, [17] Robson PM, Magn Reson Med 2008;60(4):895-907, [18] Velikina JV, Magn Reson Med 2013;70(5):1263-1273.
Figures