3277
Cluster Failure at (Ultra)high Resolution fMRI? Enhancing Accuracy in 7T Single-Subject Analysis Using Small Gaussian Kernels1Berlin Ultrahigh Field Facility (B.U.F.F.), Max Delbrück Center for Molecular Medicine, Berlin, Germany, 2Charité—Universitätsmedizin, Experimental and Clinical Research Center (ECRC), A Joint Cooperation between the Charité Medical Faculty and the Max-Delbrück Center for Molecular Medicine, Berlin, Germany, 3Weierstrass Institute for Applied Analysis and Stochastics, Berlin, Germany, 4Max Delbrück Center for Molecular Medicine, Berlin, Germany, 5Charité—Universitätsmedizin Berlin, Experimental and Clinical Research Center (ECRC), A Joint Cooperation between the Charité Medical Faculty and the Max-Delbrück Center for Molecular Medicine, Berlin, Germany
Synopsis
Keywords: fMRI Analysis, fMRI (task based)
Motivation: Selecting the right Gaussian kernel size for fMRI lacks standardization. For the detection of subtle brain activations, smaller kernels are needed. However, their reliability in ensuring accurate and trustworthy results remains uncertain.
Goal(s): Evaluate the effectiveness of small Gaussian filter kernel on fMRI data.
Approach: Assessment of BOLD signal integrity, accuracy, and data normality- employing 7T fMRI simulated time series and resting-state data.
Results: The study underscored the efficiency of smaller kernels in minimizing noise and upholding accurate signal detection. Residuals largely followed a Gaussian distribution.
Impact: Our study provides factual support for using small Gaussian kernel sizes in 7T fMRI data for their reliability in both functionality and compliance with RFT requirements.
Introduction
(Ultra)high-resolution fMRI at ≥7T enables the identification of fine-grained functional neurosignatures in the individual brain. To preserve spatial accuracy, smaller Gaussian kernel sizes are increasingly used to smooth the data. Yet, the optimal kernel size for high-resolution fMRI remains a topic of debate, with no standardized approach1,2.Larger kernels blur images, problematic in single-subject studies that focus on individual brain activity3,4. The efficacy of smaller kernels, on the other hand, in noise reduction, ensuring data normality to satisfy random field theory (RFT) stipulations5,6, and accurately pinpointing brain signals remains uncertain5,7.
This study assessed Gaussian filters with kernel sizes set at 1.0x, 1.5x, and 2.5x times the voxel size (1.5mm isotropic). To evaluate the effect of kernel sizes on the representation of relative activity strength within an activated region, we introduce the metric "signal integrity" (SI). To evaluate SI, accuracy, and sensitivity across kernel sizes, we simulated time series with BOLD signal changes in defined voxel clusters, serving as a benchmark for objective measurement. We further gauged the false positive rate across kernel sizes by task-based analysis of resting-state time series for which no activations are expected. Measures of kurtosis and skewness of residuals were used to ascertain the normality of the data.
Methods
Simulations: Synthetic time series were designed with three types of noise: Gaussian, Rician, and real 'Acquired' noise. To simulate brain activity, 4 masks were designed with BOLD magnitudes between 0.5 – 5%. Noise magnitudes were set at 1, 2, and 4% relative to the baseline.Signal Integrity (SI): Quantified as the correlation between predefined activity ground truth masks and the contrast parameter estimates derived from the GLM.
Accuracy & Sensitivity: The Sorensen-Dice score was used to calculate the accuracy, and sensitivity as true positive rate.
Gaussian Smoothing: Kernel sizes: 1.0x, 1.5x, and 2.5x times the voxel size.
Resting State fMRI: 16 7T fMRI resting-state time series were acquired from 9 subjects (TR=2s, spatial resolution=1.5mm isotropic).
Task-based Paradigms: We used two block (B1, B2) and two event related (E1, E2) designs with varying block size, moving block through the time series and shifting on set times. In total 35 different paradigms.
False Positive Rate (FPR): calculated as the number of active voxels divided by the total number of voxels inside the brain.
Residual Analysis: Kurtosis and skewness values of the residuals were calculated from the mean of residuals across all subjects and paradigms.
All analyses were performed using FSL FEAT, employing cluster inference using a defining threshold of z = 3.1 and cluster correction p = 0.05.
Results
At the low noise levels and BOLD magnitudes of 2% and above the 1.0x kernel has superior SI (Fig. 1C) and accuracy (Fig. 2). At the medium noise levels, the 1.5x kernel obtains the best results. For the highest noise level, the 2.5x kernel is the best in SI, accuracy, and sensitivity, except for the smallest BOLD activation clusters (mask 1), which are suppressed by large kernel sizes (Fig. 1C,2,3).All three kernel sizes exhibited an FPR < 1%, suggesting that they largely control the rate of false positives caused by physiological and thermal noise (Fig.4A). Larger kernel sizes produce less, but larger false positive clusters (<100 voxels), compared to smaller kernel sizes (Fig. 4B), especially in the B2 paradigm. Smaller kernel sizes, however, were prone to produce more false positive “clusters” of about 1 voxel, but a smaller number of false positive voxels overall (Fig. 4C).
Kurtosis values – required to be around 3 (+/-2) to match normal distribution – were found to be in the range of 1-4, with certain deviations at cortical borders and ventricular zones (Fig. 5A). The skewness values across most cerebral areas were close to zero (Fig. 5B), illustrating the Gaussian nature of the data distribution, except for noticeable deviations in the ventricles.
Discussion & Conclusion
The choice of the Gaussian filter's kernel size is often based on expected activation sizes or simply doubling the voxel size without much consideration for data smoothing or ensuring a normal distribution. Our results highlight that smaller kernels can maintain good brain signal integrity, be fairly accurate in identifying signals, and keep blur to a minimum with good sensitivity. For optimal accuracy, it is important to consider noise level and expected cluster size when choosing the kernel size. The residuals mostly show a normal distribution, validating the statistical analysis.In conclusion, our study provides factual support for the use of small Gaussian kernel sizes in 7T fMRI data for their reliability in both functionality and compliance with RFT requirements.
Acknowledgements
No acknowledgement found.References
1. Gopinath, K., Krishnamurthy, V., Lacey, S., & Sathian, K. (2018). Accounting for Non-Gaussian Sources of Spatial Correlation in Parametric Functional Magnetic Resonance Imaging Paradigms II: A Method to Obtain First-Level Analysis Residuals with Uniform and Gaussian Spatial Autocorrelation Function and Independent and Identically Distributed Time-Series. Brain connectivity, 8(1), 10–21. https://doi.org/10.1089/brain.2017.0522
2. Candemir, C. (2023). Spatial Smoothing Effect on Group-Level Functional Connectivity during Resting and Task-Based fMRI. Sensors, 23(13), 5866. https://doi.org/10.3390/s23135866
3. Dubois, J., & Adolphs, R. (2016). Building a Science of Individual Differences from fMRI. Trends in cognitive sciences, 20(6), 425–443. https://doi.org/10.1016/j.tics.2016.03.014
4. Jabakhanji, R., Vigotsky, A. D., Bielefeld, J., Huang, L., Baliki, M. N., Iannetti, G., & Apkarian, A. V. (2022). Limits of decoding mental states with fMRI. cortex, 149, 101-122. https://doi.org/10.1016/j.cortex.2021.12.015
5. Weibull, A., Gustavsson, H., Mattsson, S., & Svensson, J. (2008). Investigation of spatial resolution, partial volume effects and smoothing in functional MRI using artificial 3D time series. NeuroImage, 41, 346-353. https://doi.org/10.1016/j.neuroimage.2008.02.015
6. Eklund, A., Nichols, T. E., & Knutsson, H. (2016). Cluster failure: Why fmri inferences for spatial extent have inflated false-positive rates. Proceedings of the National Academy of Sciences, 113(28), 7900–7905. https://doi.org/10.1073/pnas.1602413113
7. Pajula, J., & Tohka, J. (2014). Effects of spatial smoothing on inter-subject correlation based analysis of FMRI. Magnetic resonance imaging, 32(9), 1114-1124.https://doi.org/10.1016/j.mri.2014.06.001
Figures
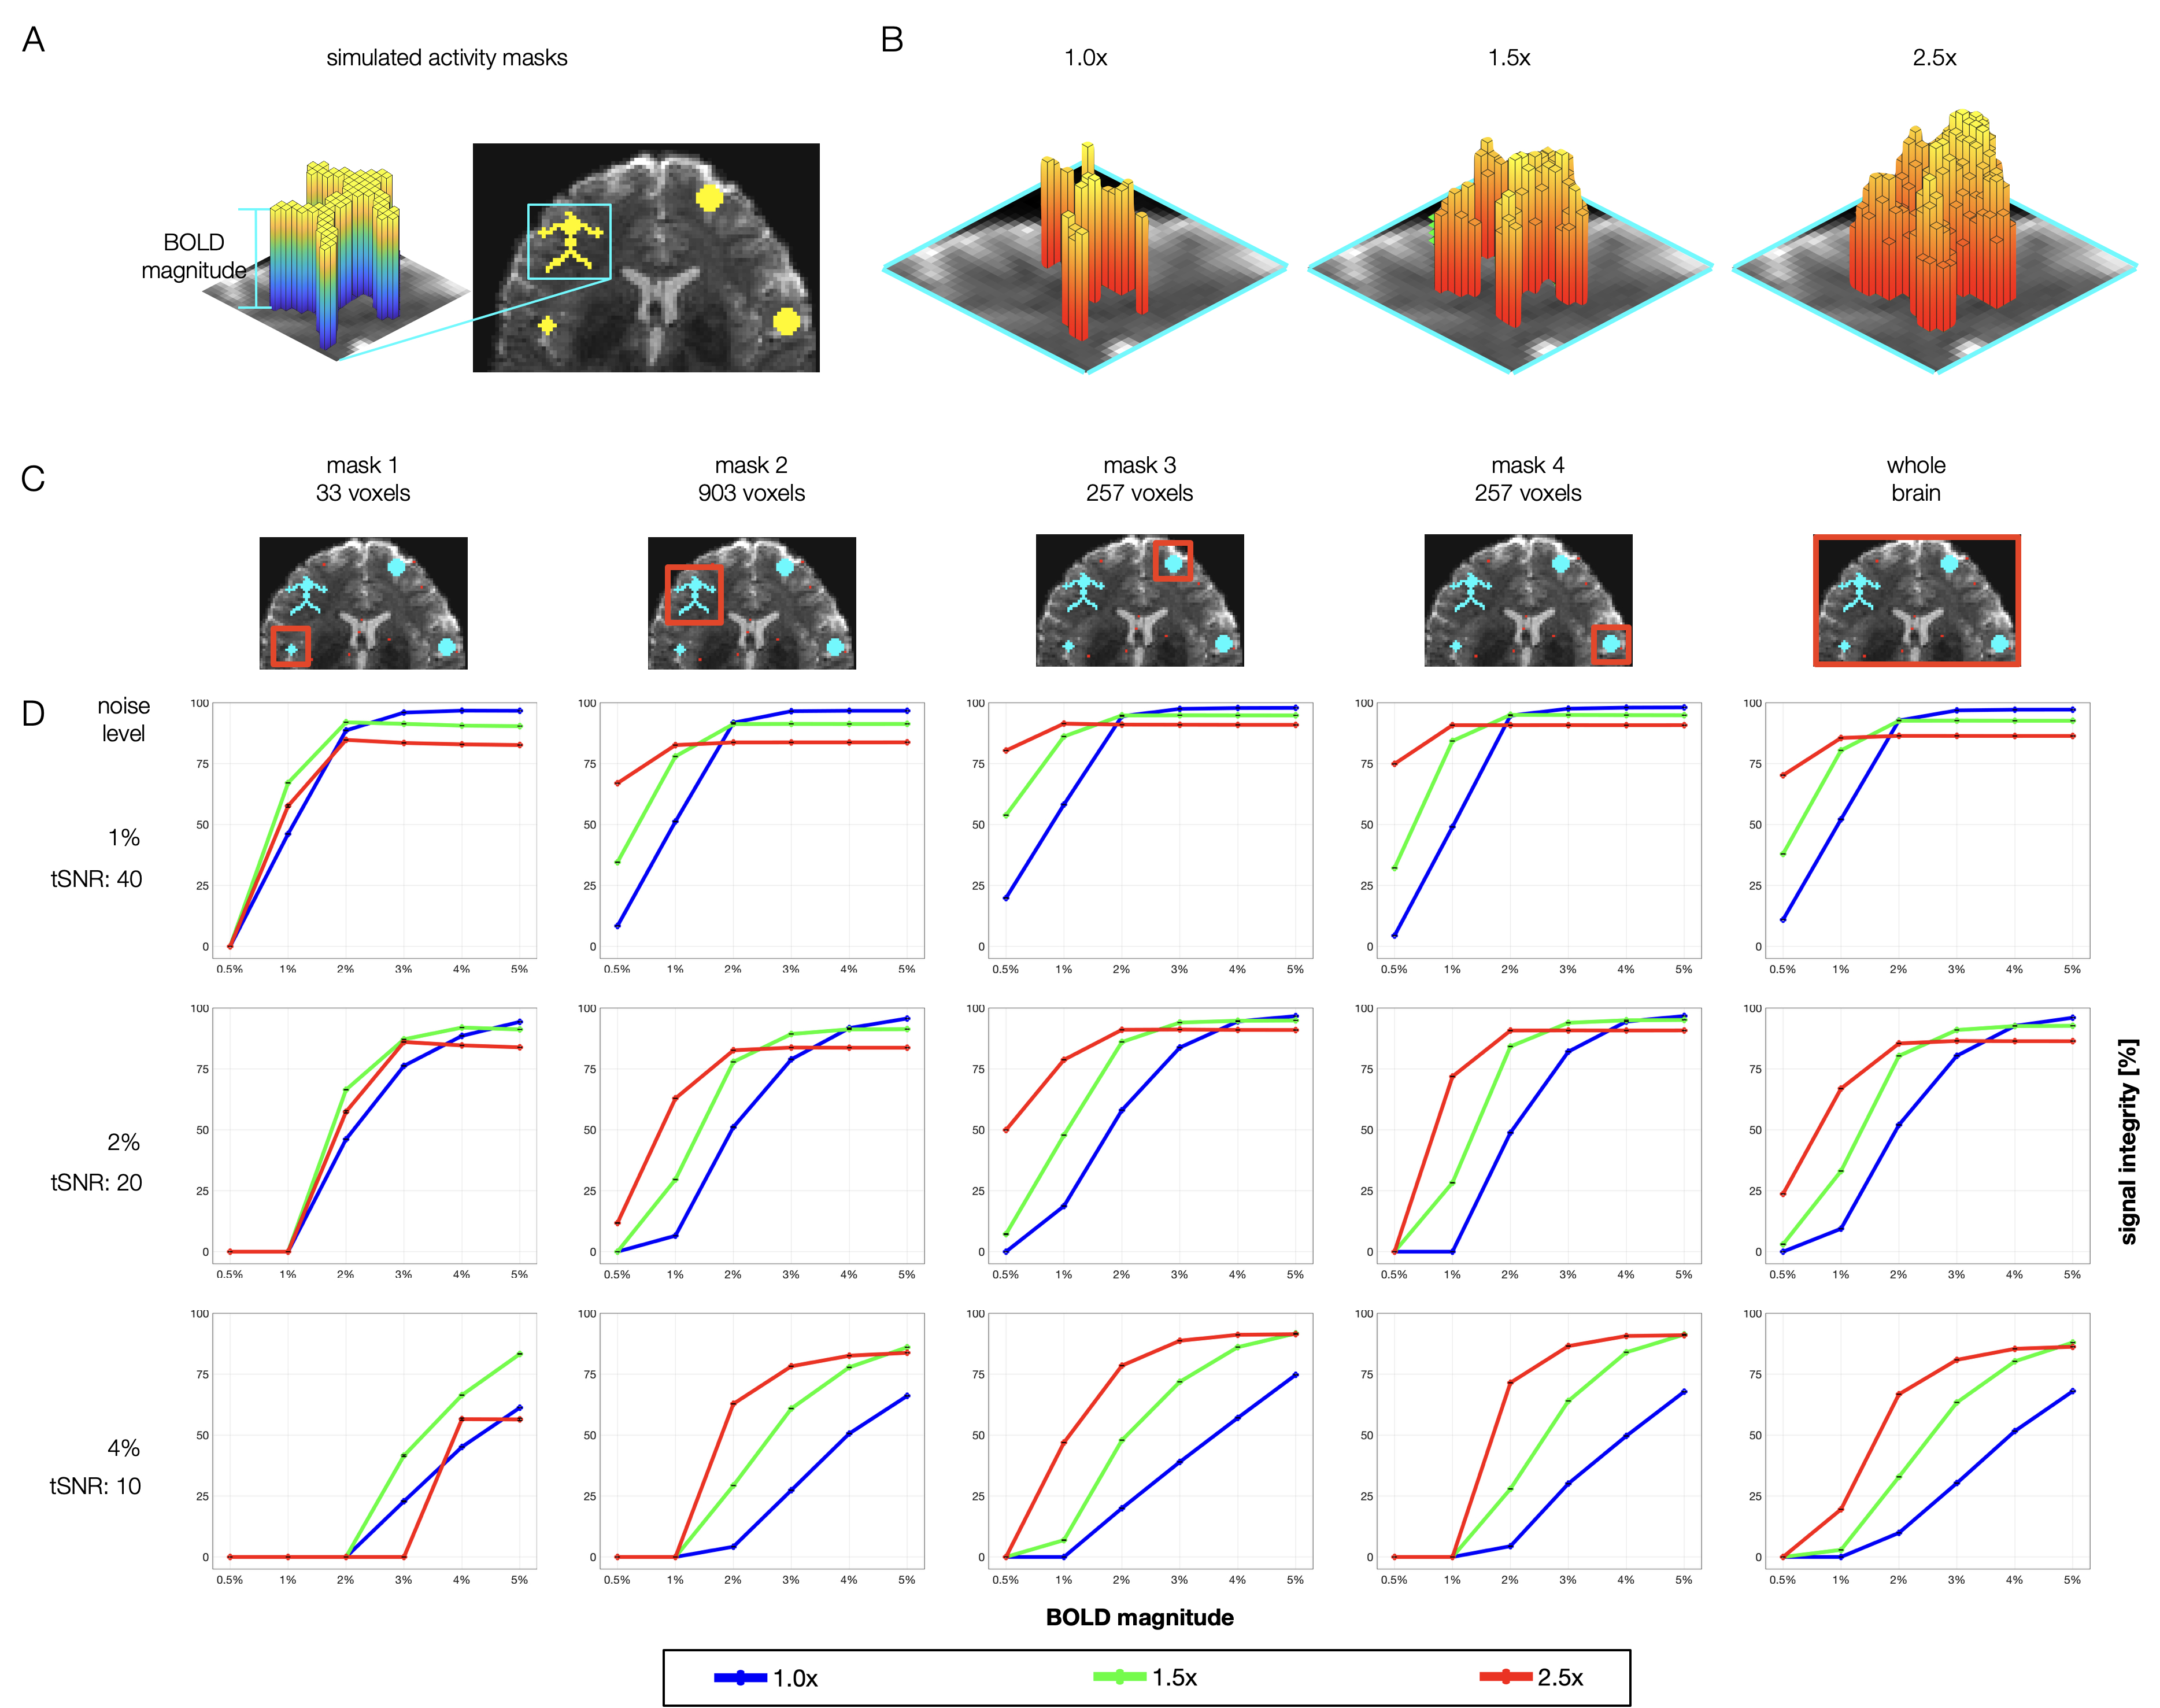
Figure 1. Signal Integrity (SI). Defined as the correlation between predefined activity ground truth masks (GTM) and the contrast parameter estimates derived from the GLM. A) 3D BOLD magnitudes representations of the GTM. B) 3D contrast parameters estimate of the tested Gaussian kernels, (BOLD magnitude/noise level=2%/2%). C) Locations of each GTM. D) SI results on simulated data sets using 6 BOLD magnitudes (0.5-5%) and 3 noise levels (1, 2, 4%).
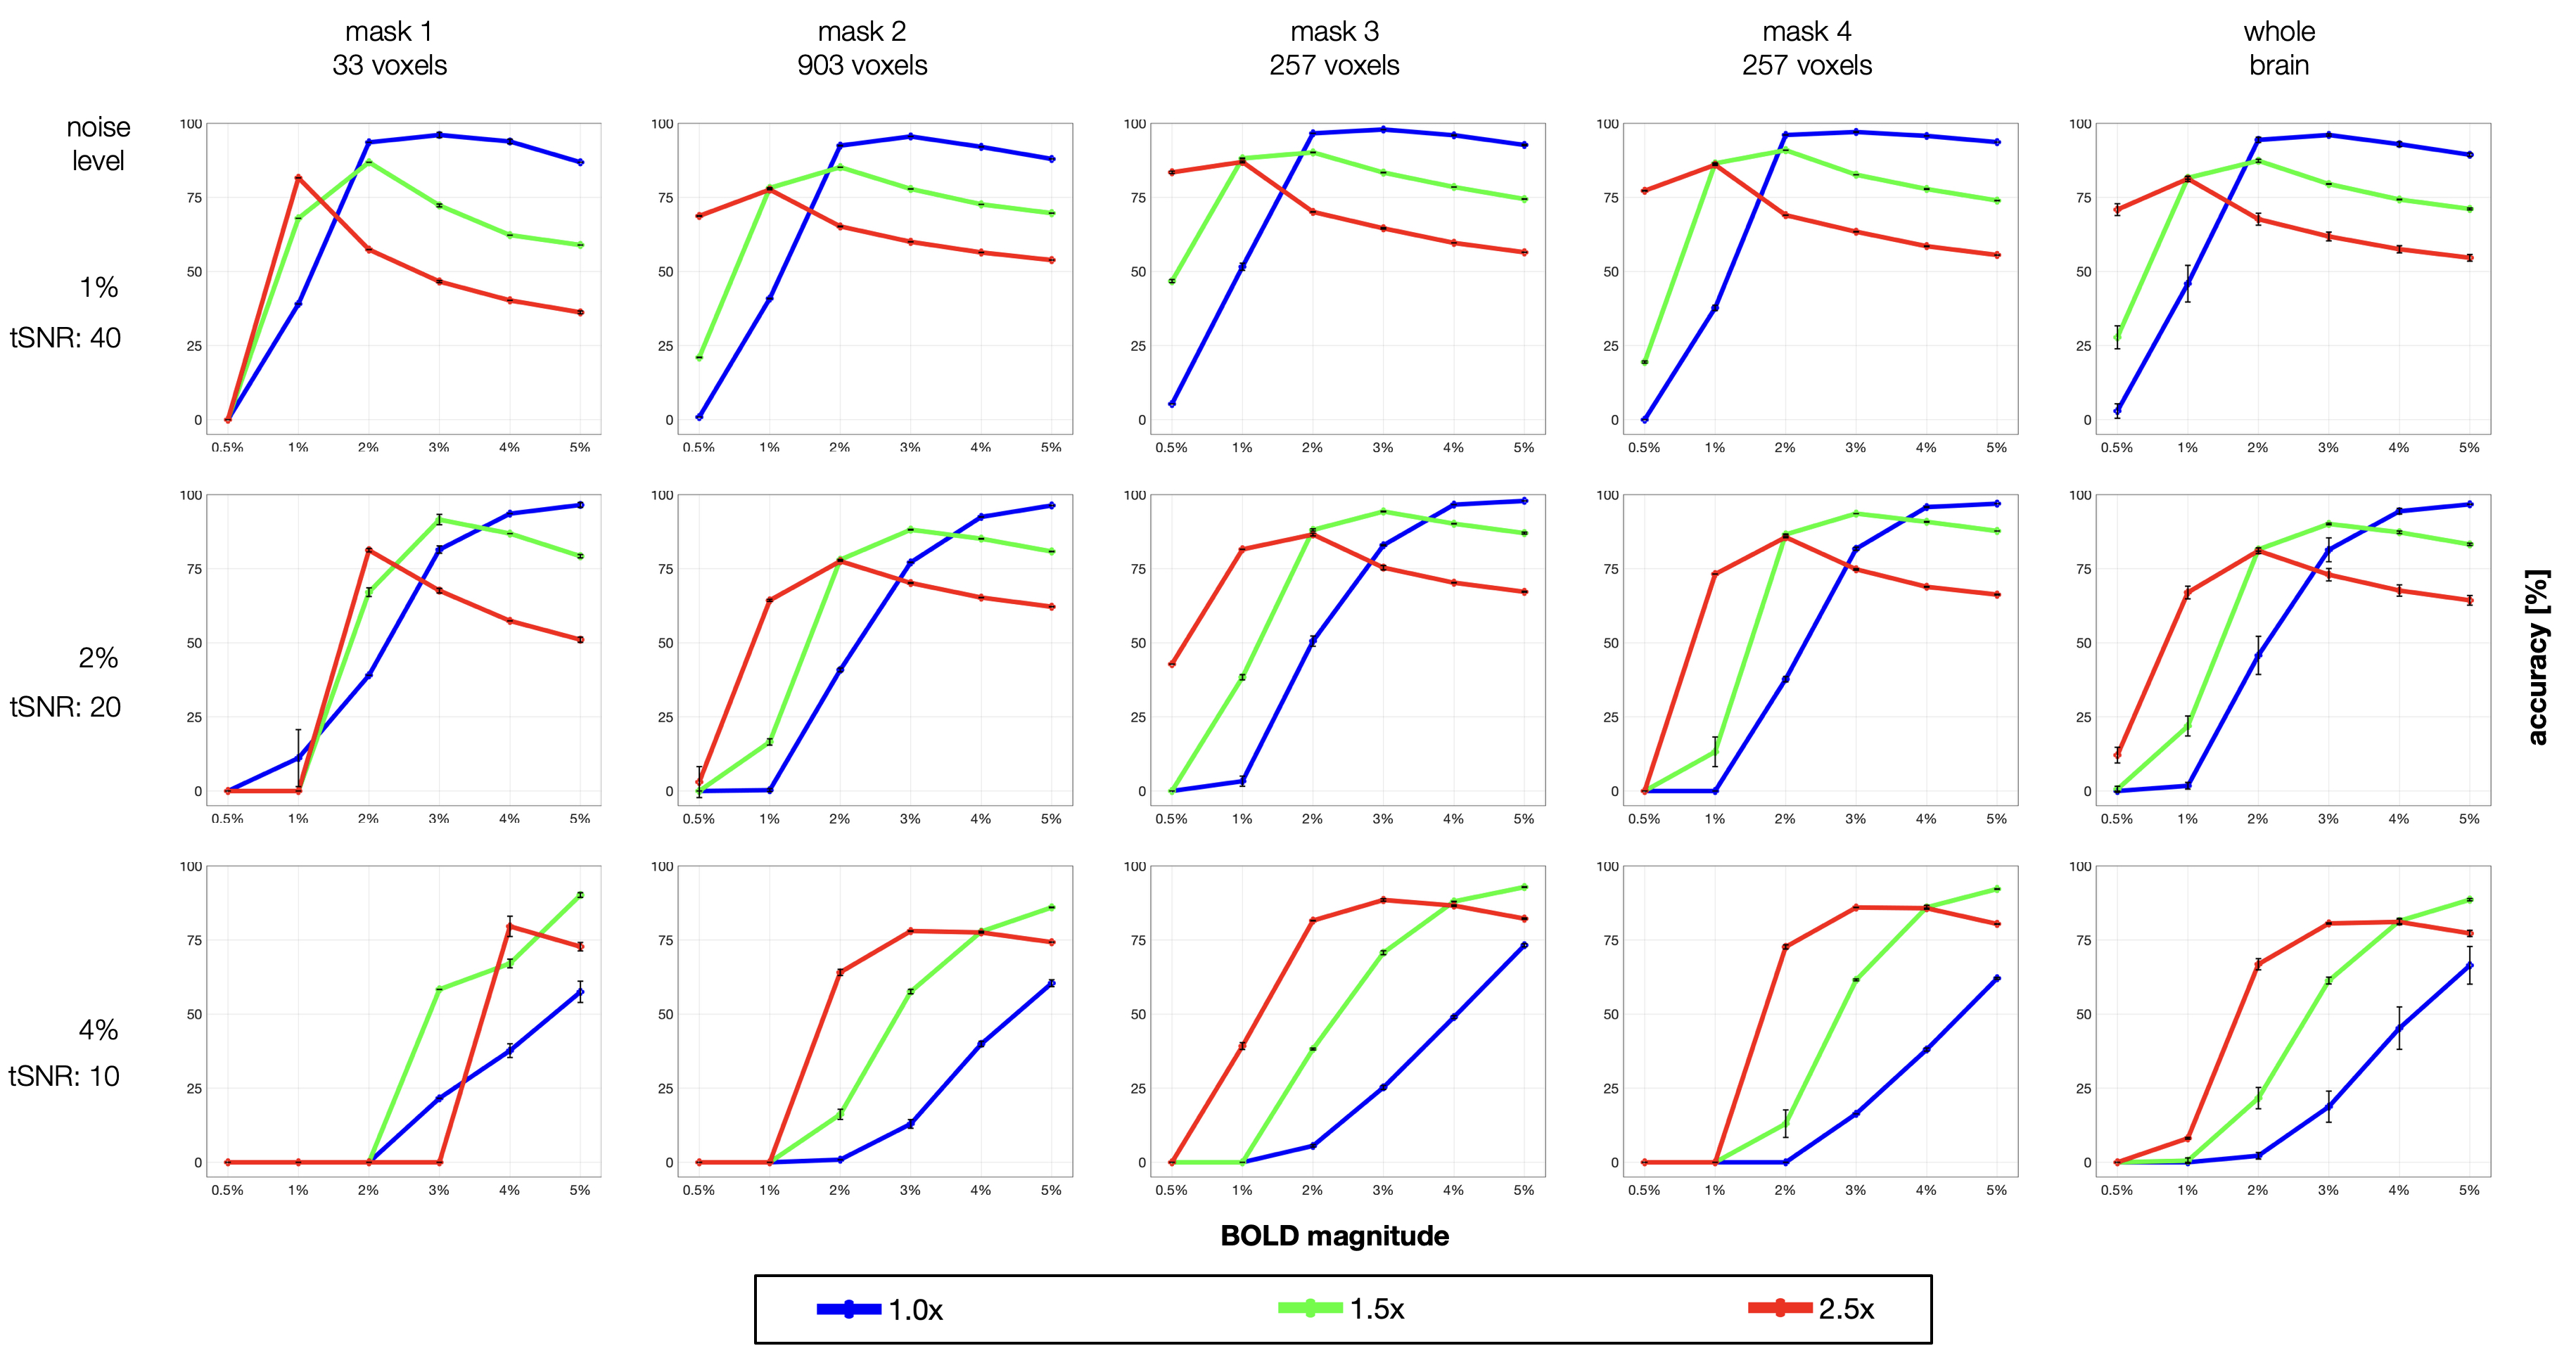
Figure 2. Accuracy evaluated on simulated fMRI data sets using 6 BOLD magnitudes (0.5-5%) and three noise levels (1, 2, 4%). At the low noise levels and BOLD magnitudes of 2% and above the 1.0x kernel has superior accuracy. At the medium noise levels, the 1.5x kernel obtains the best results. For the highest noise level, the 2.5x kernel is the best, except for the smallest BOLD activation clusters (mask 1), which are suppressed by large kernel sizes.
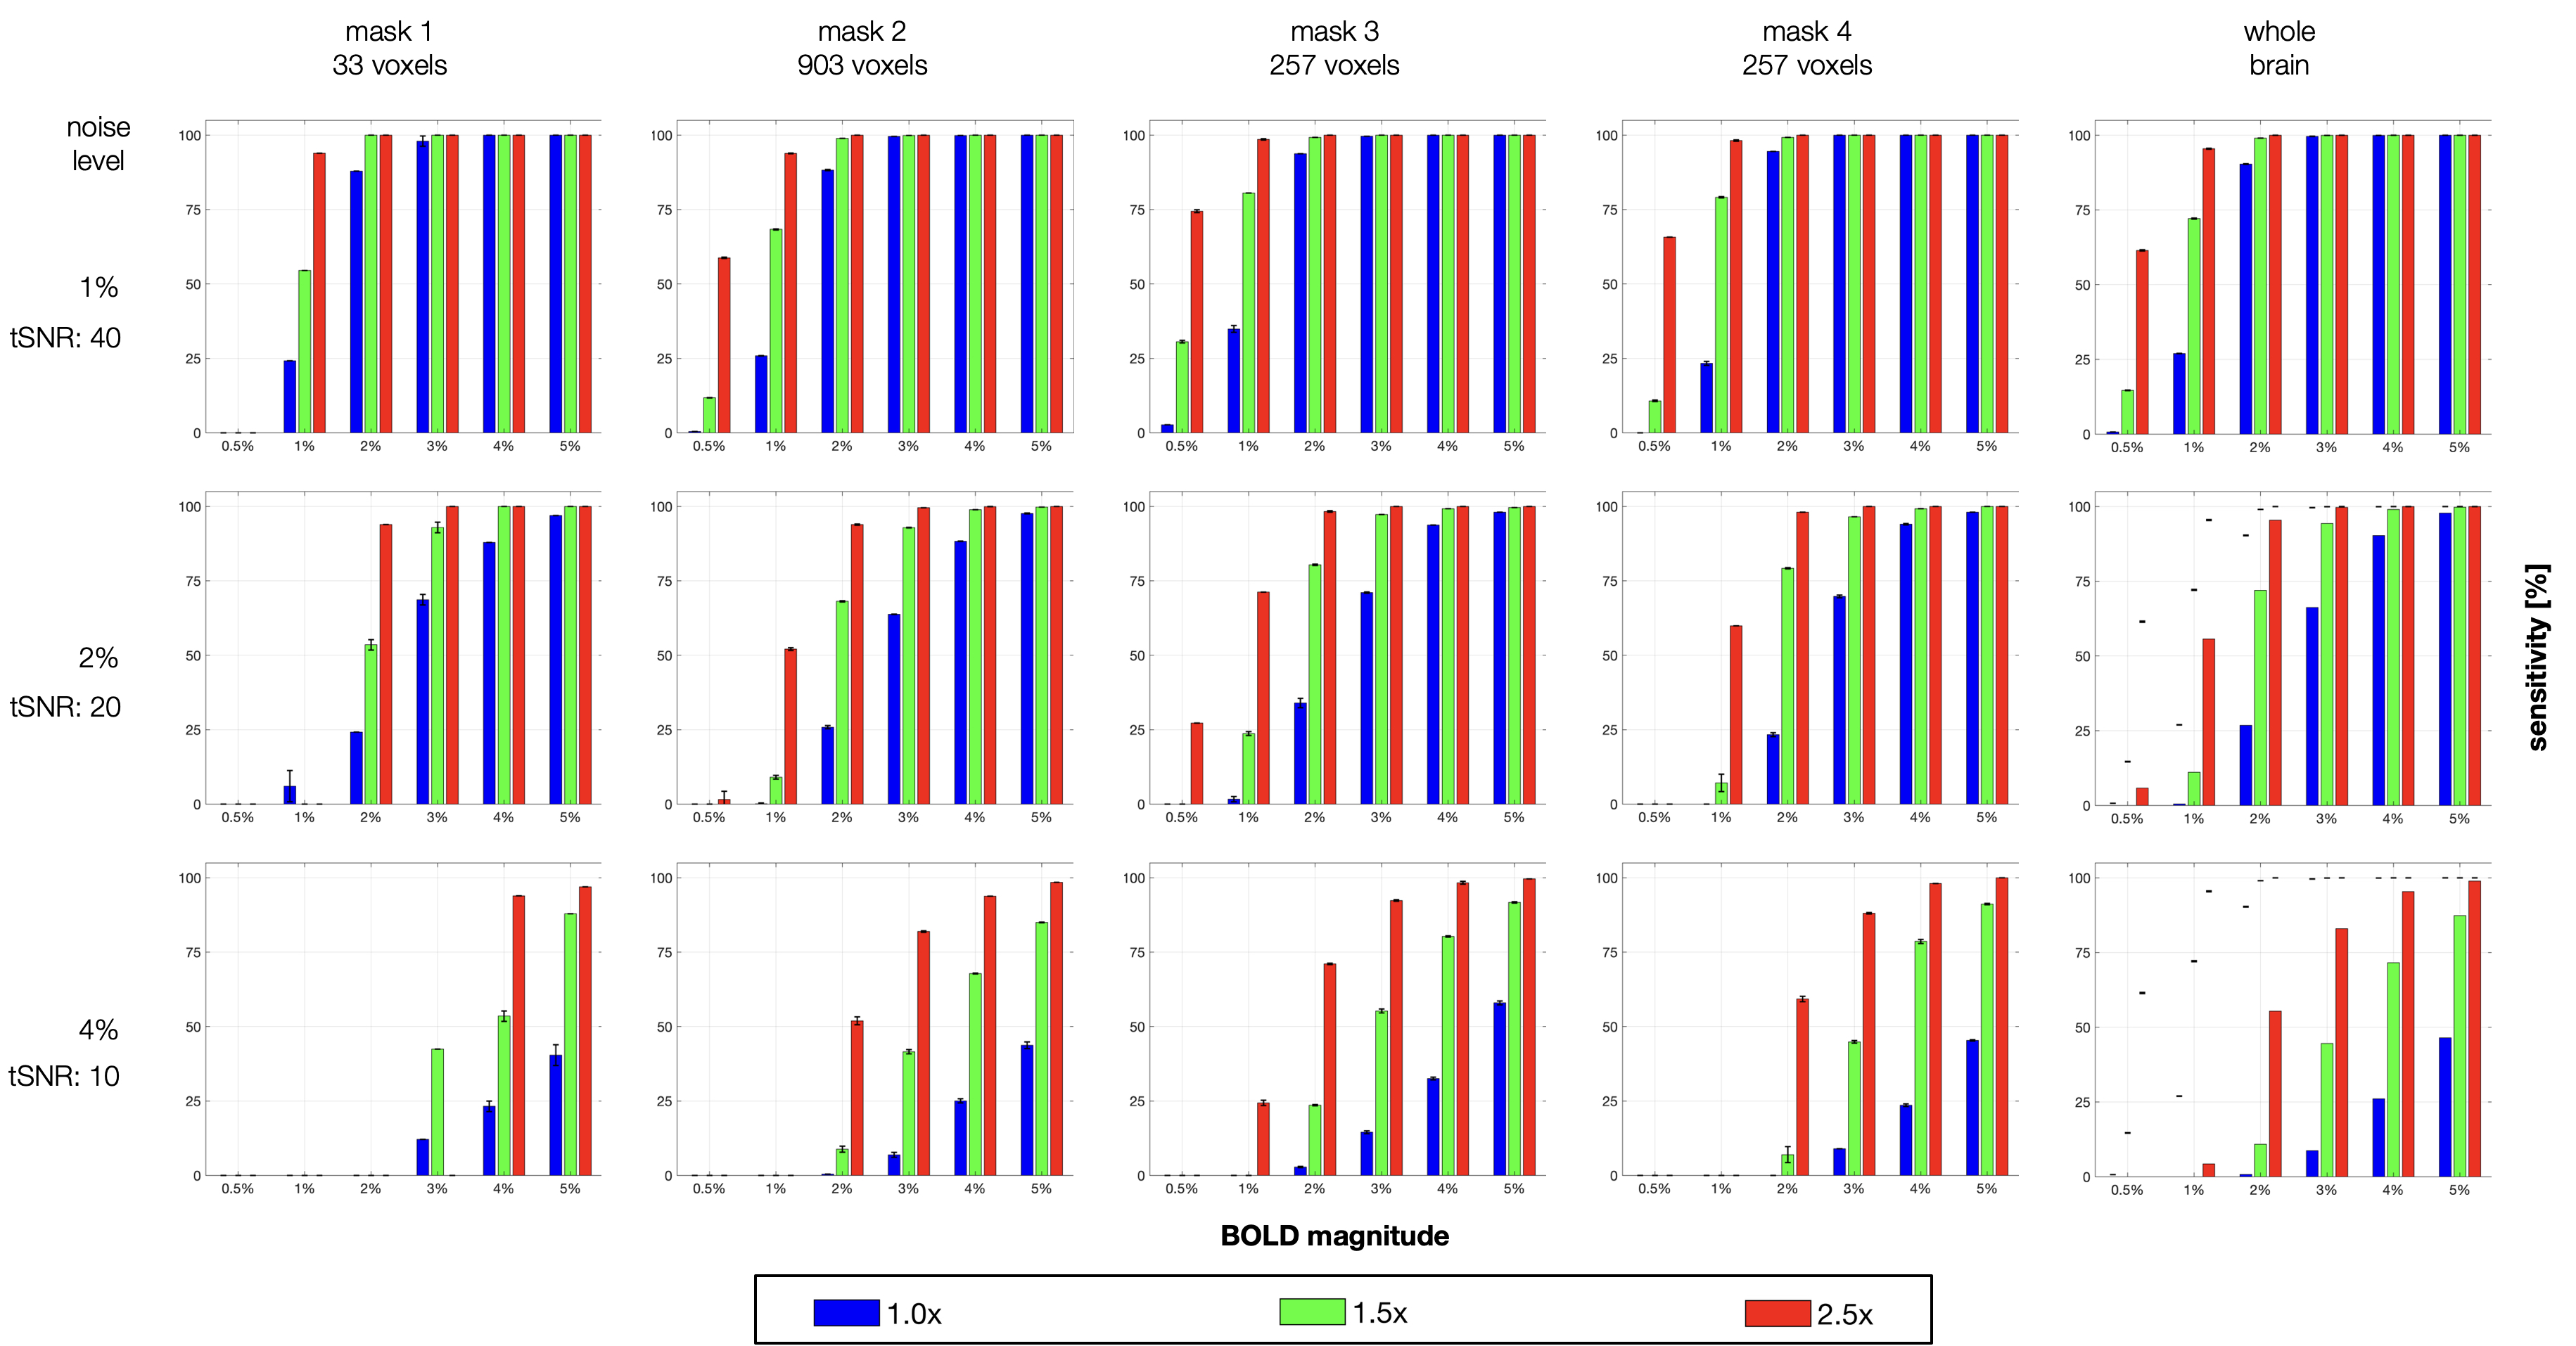
Figure 3. Sensitivity evaluated on simulated fMRI data sets using 5 BOLD magnitudes (0.5- 5%) and three noise levels (1, 2, 4%). The 2.5x kernel size is shown as the best except for mask 1 at the 4% noise level, similarly as the accuracy results, the signal is removed along with the noise.
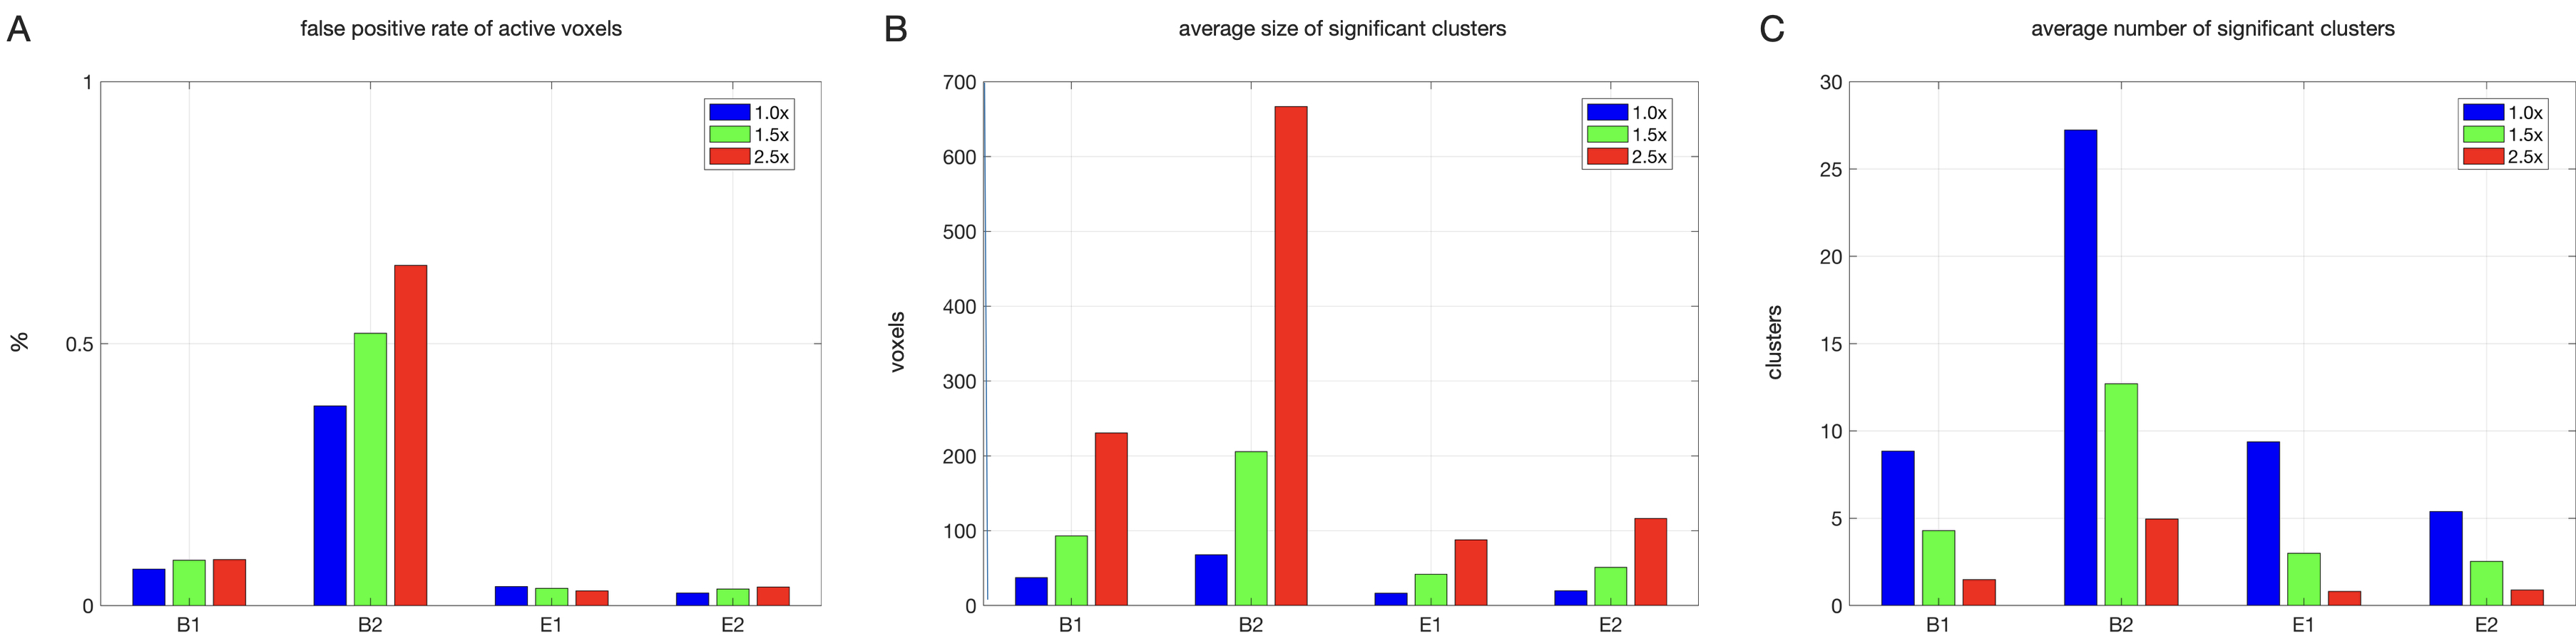
Figure 4. False positive results tested in 4 types of task-based paradigms (B1, B2, E1, E2) using Gaussian filters at 3 kernel sizes on resting state data. A) False positive rates (FPR) calculated as the number of active voxels divided by the total number of voxels inside the brain. All three kernel sizes exhibited an FPR < 1%, suggesting that they largely control the rate of false positives caused by physiological and thermal noise. B) Average size of significant clusters. C) Average number of significant clusters.
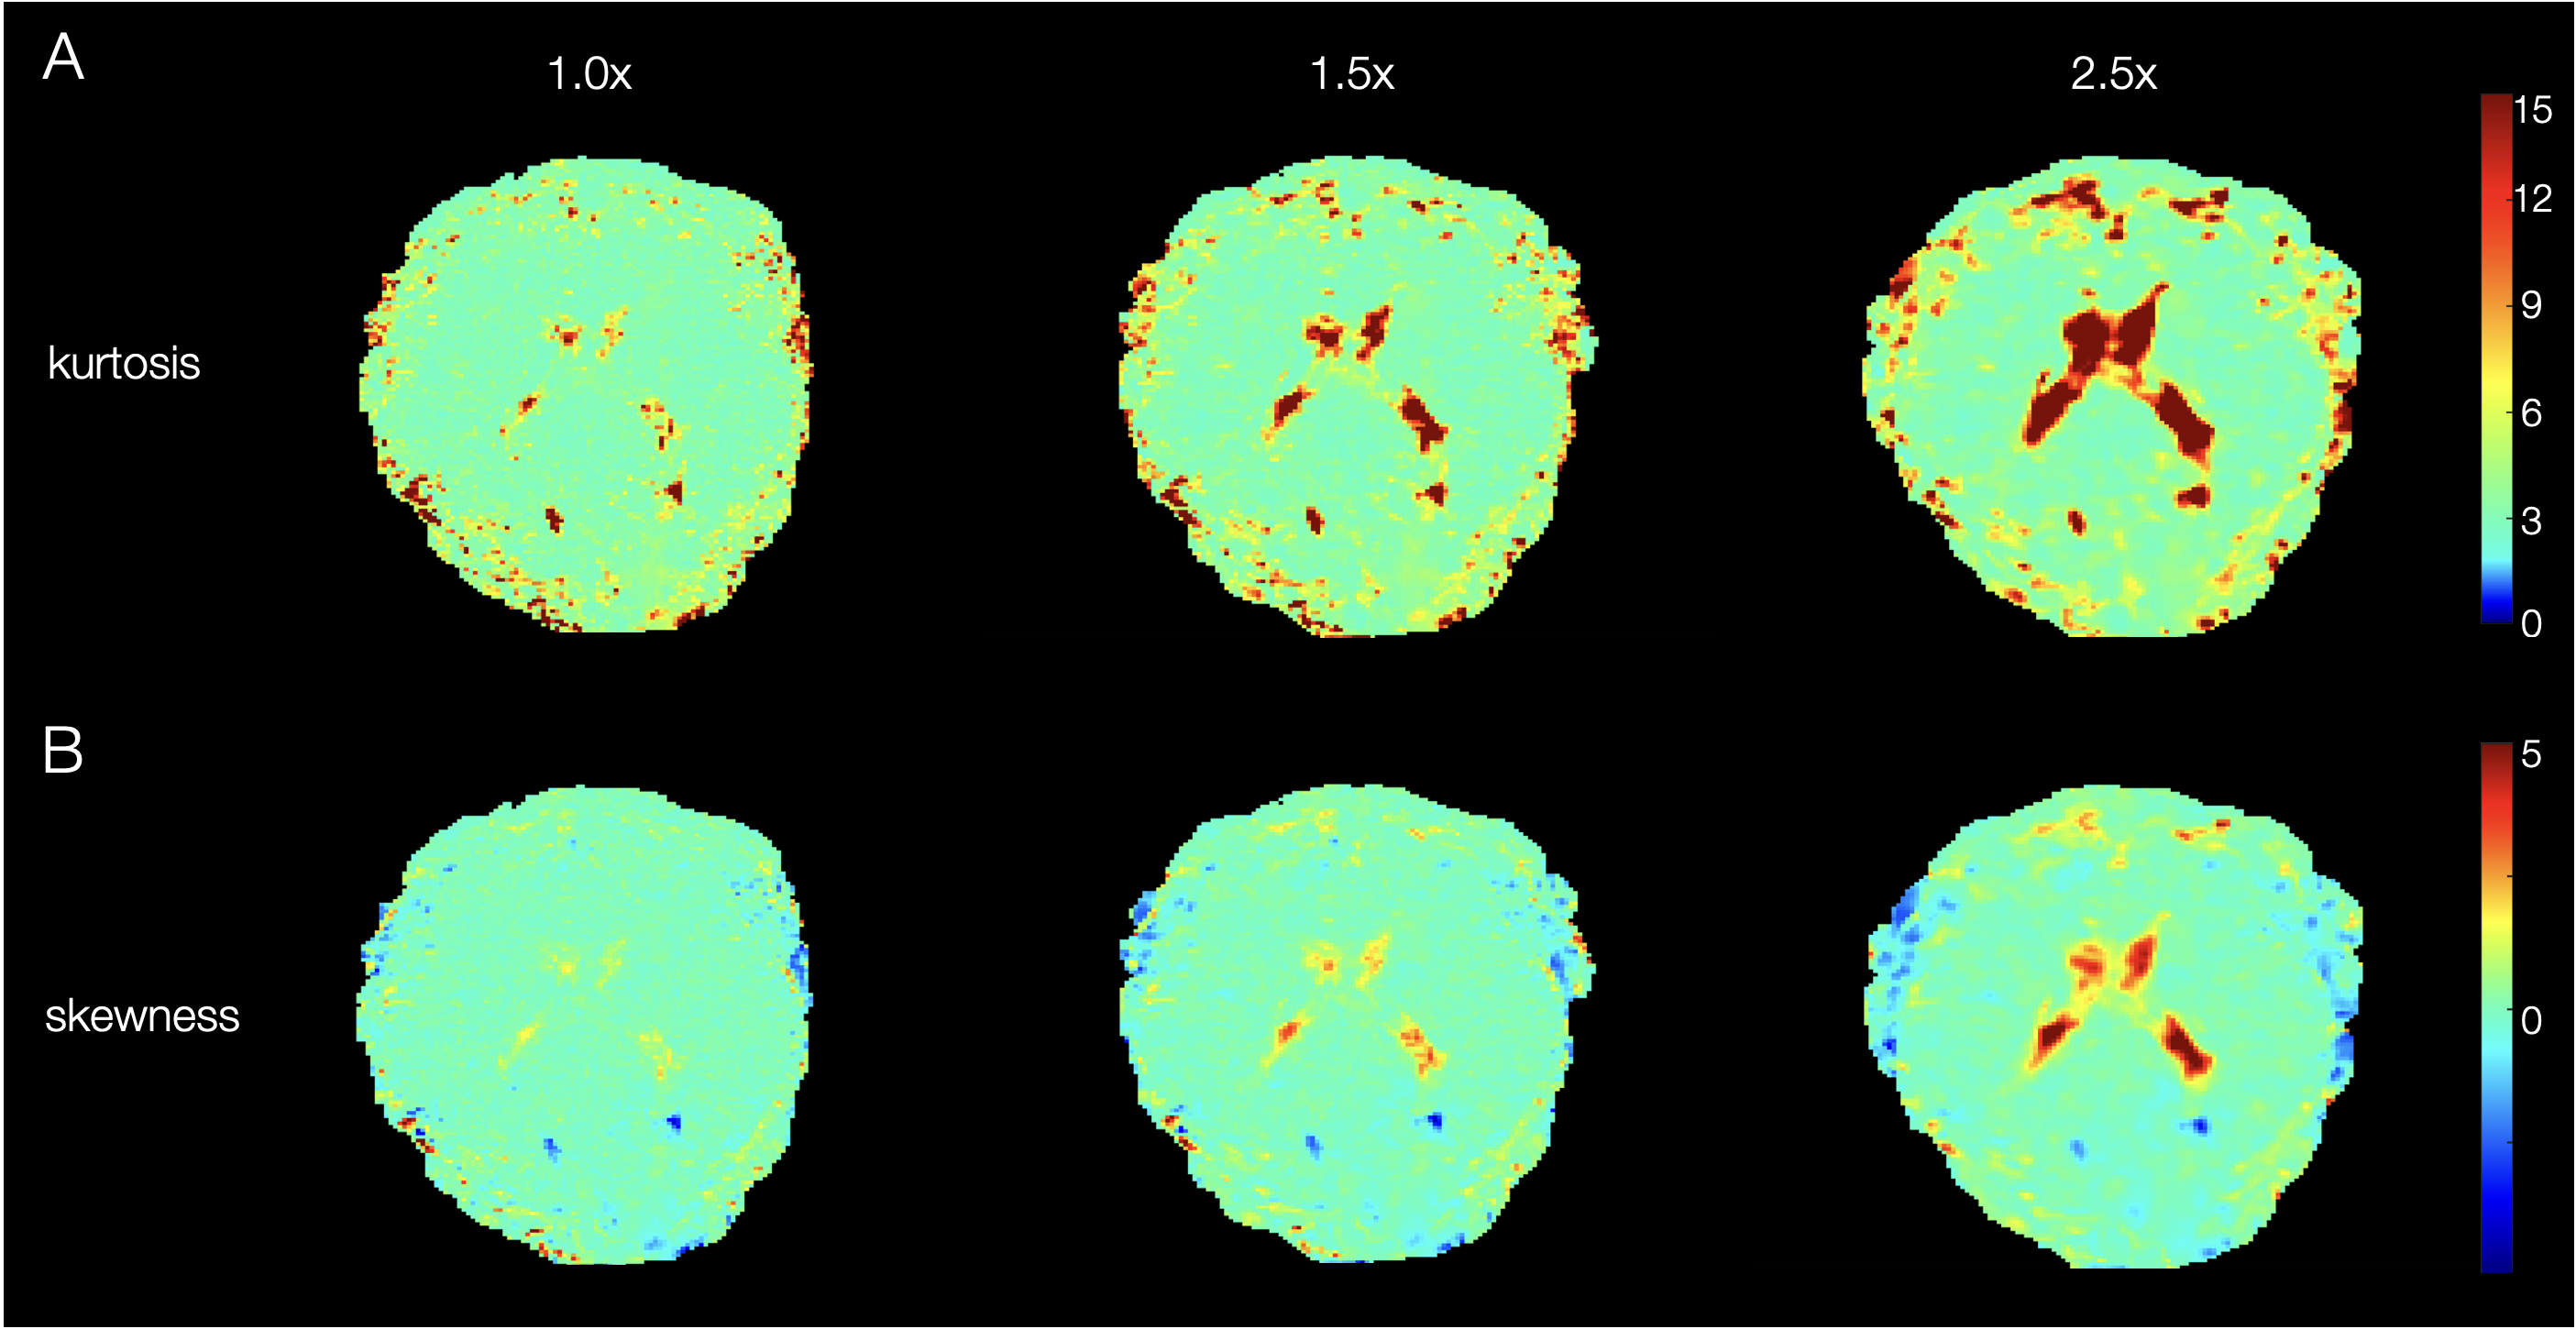
Figure 5. Metric maps to assess normal distribution. A) Kurtosis maps. Kurtosis values (required to be around 3 (+/-2) to match normal distribution) were found to be in the range of 1-4, with certain deviations at cortical borders and ventricular zones. B) Skewness maps. The skewness values across most cerebral areas were close to zero, illustrating the Gaussian nature of the data distribution, except for noticeable deviations in the ventricles.