3275
Applying block matching with 4D filtering (BM4D) to functional task based ASL1University of Illinois Urbana-Champaign, Urbana, IL, United States, 2University of Illinois Urbana-Champiagn, Urbana, IL, United States
Synopsis
Keywords: fMRI Analysis, Perfusion
Motivation: Test a denoising method, block matching with 4D filtering (BM4D), to improve the performance of a low signal-to-noise modality, functional imaging using arterial spin labeling (ASL)
Goal(s): Apply BM4D to improve the detection of brain activity
Approach: Use task-based fMRI in human data and in simulation to test how well the BM4D denoised data corresponds to ground truth activation compared to non-denoised data
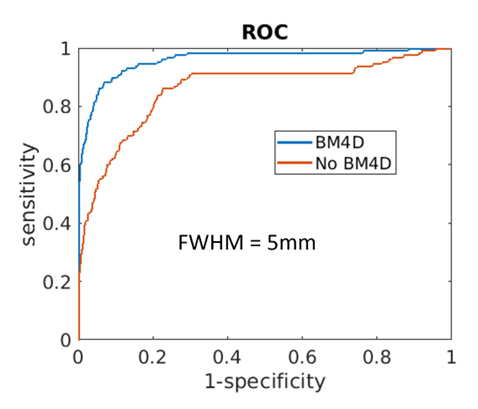
Results: The BM4D denoised data performs better than non-denoised data when spatial Gaussian smoothing is not used prior to analysis but fails to outperform when adequate spatial Gaussian smoothing is used.
Impact: For functional arterial spin labeling (ASL), denoising algorithms may show an improvement in detecting brain activity in simulation, but not when comparisons are made after adequate spatial Gaussian smoothing.
Introduction
Block Matching and 4D filtering (BM4D) is a promising volume denoising method that is applied to 3D data1. It works by finding groups of similar 3D blocks in a volume by finding the two norms of the difference between them. Then, it applies 4D denoising to the group by transforming the 4D group to a sparse domain and promoting sparsity. Because the blocks can overlap, the volume is then reformed using adaptive weights that indicate the quality of the voxel when it is repeated, so higher quality instances of the voxel are weighed more during aggregation back into a volume. The process is then repeated but with Wiener filtering on the groups instead of denoising via sparsity on the groups.Block Matching and 3D filtering (BM3D), which denoises 2D data2, has been previously used for denoising arterial spin labeling (ASL) data3. Here BM4D is applied to spatially denoise functional ASL volumes to test the improvement in measuring task activation.
Methods
The code for the BM4D algorithm was downloaded from the Tampere University of Technology, Department of Signal Processing website, https://webpages.tuni.fi/foi/GCF-BM3D/4. The default method for BM4D was used assuming Gaussian noise. BM4D was applied to the ASL volumes at each time point before subtraction of the controls and tags.The digital phantom was created from a segmented anatomical volume. The AUC intervals were determined using the standard error of the AUC5. Noise and T2 decay were simulated in k-space and the same reconstruction method was used for simulation and human data. The GLM was used to get t-score maps corresponding to task activation, which were used for ROC curves.
3D PASL data with standard recommendations6 was collected on a 3T scanner with TR = 3.2 seconds using a spiral acquisition in the x-y plane. SENSE and the NUFFT were used to reconstruct with an under-sampling factor of 27. Spirals were collected in a centric ordered pattern. The resolution of the volumes was 3.8 mm in x, 3.8mm in y, and 6mm in z. Stimulation consisted of 20 seconds off 20 seconds on flashing checkerboard for 16 trials. The first 4 timepoints were removed to remove the calibration image and to reach steady state before analysis. Human data was processed with FSL FEAT with spatial smoothing of 5mm, brain extraction, and MCFLIRT motion correction8.
Results
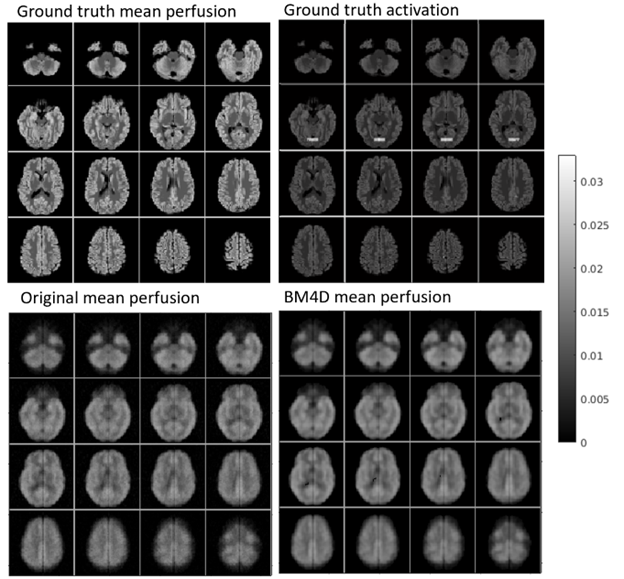
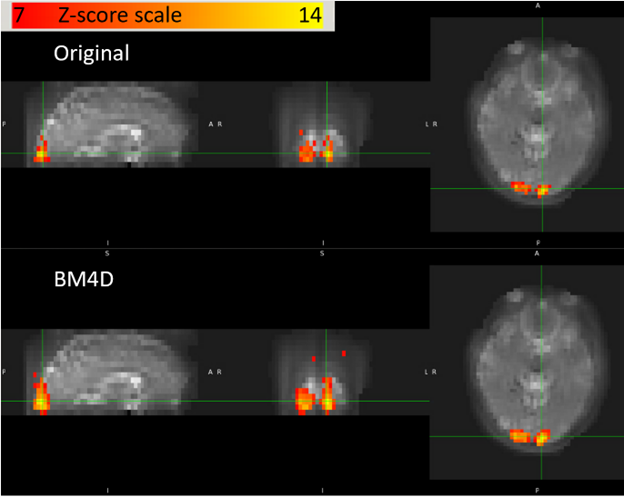
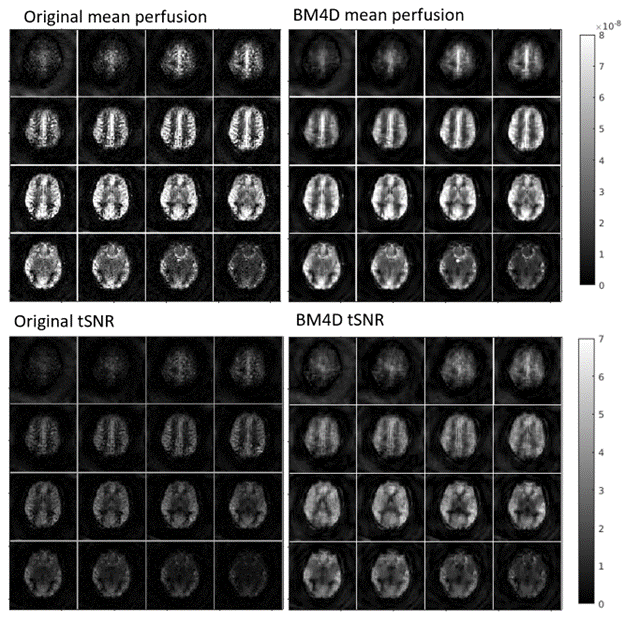
The mean perfusion and ground truth activation data for the simulation are shown in figure 1. An ROC for FWHM = 5mm is shown in figure 2, where the BM4D denoising data shows an improvement.In the human data, activation is visible in figure 3. The MEDLODIC ICA for the original non-denoised data returned 92 components, while the data denoised with BM4D returned 29 components, indicating components consisting of noise were removed by BM4D. The mean perfusion and temporal SNR (tSNR) for BM4D denoised and non-denoised are shown in figure 4.
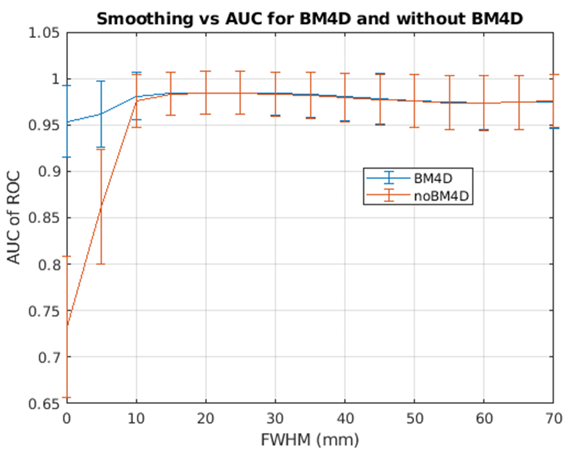
Spatial smoothing alone has been shown to increase the AUC of the ROC of functional ASL9. Because the BM4D mean perfusion images look like a smoothed version of the original data, additional smoothing was used for the simulated data to test if BM4D was more beneficial than smoothing. Figure 5 shows additional AUCs, with intervals being within 3 standard errors, at different FWHMs for spatial Gaussian smoothing. When enough spatial Gaussian smoothing was used, there was no increase in the AUC of the ROC for the BM4D denoised data.
Discussion
The simulation may be too simple to have details that could be denoised with BM4D but not spatial Gaussian smoothing. If BM4D is applied during the reconstruction for compressed sensing purposes, it may be more advantageous. Future work includes using BM4D for compressed sensing to decrease the level of T2 decay in the MRI signal and boost the spatial resolution. Combining it with more methods that reconstruct under-sampled data may improve results further. Other future work could also include a modification of BM4D to be applied to 4D spatiotemporal data rather than each individual 3D volume separately.Conclusion
BM4D was applied to task-based functional ASL and a simulation of task-based functional ASL and showed improvement when no spatial Gaussian denoising was used according to the AUC of the ROC. However, there were no increases in the AUC when adequate spatial Gaussian smoothing was used. BM4D may later be used for compressed sensing to improve functional ASL due to its ability to remove noisy components, as shown in the MELODIC ICA.Acknowledgements
This work was supported by the Miniature Brain Machinery Fellowship, training grant number NSF 1735252.References
[1] M. Maggioni, V. Katkovnik, K. Egiazarian and A. Foi, “Nonlocal Transform-Domain Filter for Volumetric Data Denoising and Reconstruction,” in IEEE Transactions on Image Processing, vol. 22, no. 1, pp. 119-133, Jan. 2013, doi: 10.1109/TIP.2012.2210725.
[2] K. Dabov, A. Foi, V. Katkovnik and K. Egiazarian, "Image Denoising by Sparse 3-D Transform-Domain Collaborative Filtering," in IEEE Transactions on Image Processing, vol. 16, no. 8, pp. 2080-2095, Aug. 2007, doi: 10.1109/TIP.2007.901238.
[3] Bouhrara et al, “Spatially adaptive unsupervised multispectral nonlocal filtering for improved cerebral blood flow mapping using arterial spin labeling magnetic resonance imaging”, Journal of Neuroscience Methods, 2018. https://doi.org/10.1016/j.jneumeth.2018.08.018
[4] “Image and video denoising by sparse 3D transform-domain collaborative filtering”, Tampere University of Technology, Department of Signal Processing, https://webpages.tuni.fi/foi/GCF-BM3D/
[5] Hanley & McNeil, “The Meaning and Use of the Area under a Receiver Operation Characteristic (ROC) Curve”, Radiology, 1982.
[6] Alsop DC et al. “Recommended implementation of arterial spin label perfusion MRI clinical applications: A consensus of the ISMRM perfusion study group and the European consortium for ASL in dementia”. Magn Reason Med. 2015.
[7] Fessler JA, Sutton BP. “Nonuniform Fast Fourier Transforms Using Min-Max Interpolation”. IEEE Trans. Signal Process. 2003.
[8] Woolrich, M. W., Ripley, B. D., Brady, M., & Smith, S. M. (2001). “Temporal Autocorrelation in Univariate Linear Modeling of FMRI Data”. NeuroImage, 14(6), 1370–1386. http://doi.org/10.1006/nimg.2001.0931
[9] Wang et al. “To smooth or not to smooth? ROC analysis of perfusion fMRI data”, Magnetic Resonance in Medicine, 2005. https://doi.org/10.1016/j.mri.2004.11.009
Figures