3274
Grasping the noise – applying brain vasculature as a priori for sLFO reduction in the BOLD-fMRI signal and the impact on subject identifiability1Bioengineering, McGill University, Montreal, QC, Canada, 2Biological and Biomedical Engineering, McGill University, Montreal, QC, Canada
Synopsis
Keywords: fMRI Analysis, fMRI, Physiological Denoising, Subject Identifiability
Motivation: Denoising systemic low-frequency oscillations (sLFOs) using global signal regression (GSR) can possibly impact the neural component of the BOLD fMRI signal.
Goal(s): Our goal was to use the spatial relationship between the sLFO component of the BOLD signal and brain vasculature to perform a less aggressive form of GSR.
Approach: We collected structural and functional images at 3T in ten subjects. We then used to temporal and spatial characteristics of the sLFOs to denoise the BOLD signal.
Results: The spatial correlation between the sLFOs and venograms confirmed their underlying vascular origin. The performance of our novel denoising technique still needs to be evaluated.
Impact: We propose a novel sLFO denoising method that uses the temporal and spatial patterns of physiological noise to preserve a larger fraction of the neural activity.
Introduction
A significant source of noise in the BOLD-fMRI signal inherently stems from systemic physiological signals, such as systemic low-frequency oscillations (sLFOs)1,2. Although global signal regression (GSR) does reduce sLFOs, it may affect the neural component of the BOLD signal3,4; a consensus of its usage has not been reached5. Moreover, the spatial extent of sLFO effect on the BOLD signal is likely associated with the underlying brain vasculature. As such, we propose the use of susceptibility weighted imaging (SWI) venograms as prior knowledge for the spatially specific denoising of sLFO BOLD effects. Based on previous reports that correcting for physiological noise increases subject identifiability, we also examined whether this would result in an increase in subject identifiability compared to GSR6.Methods
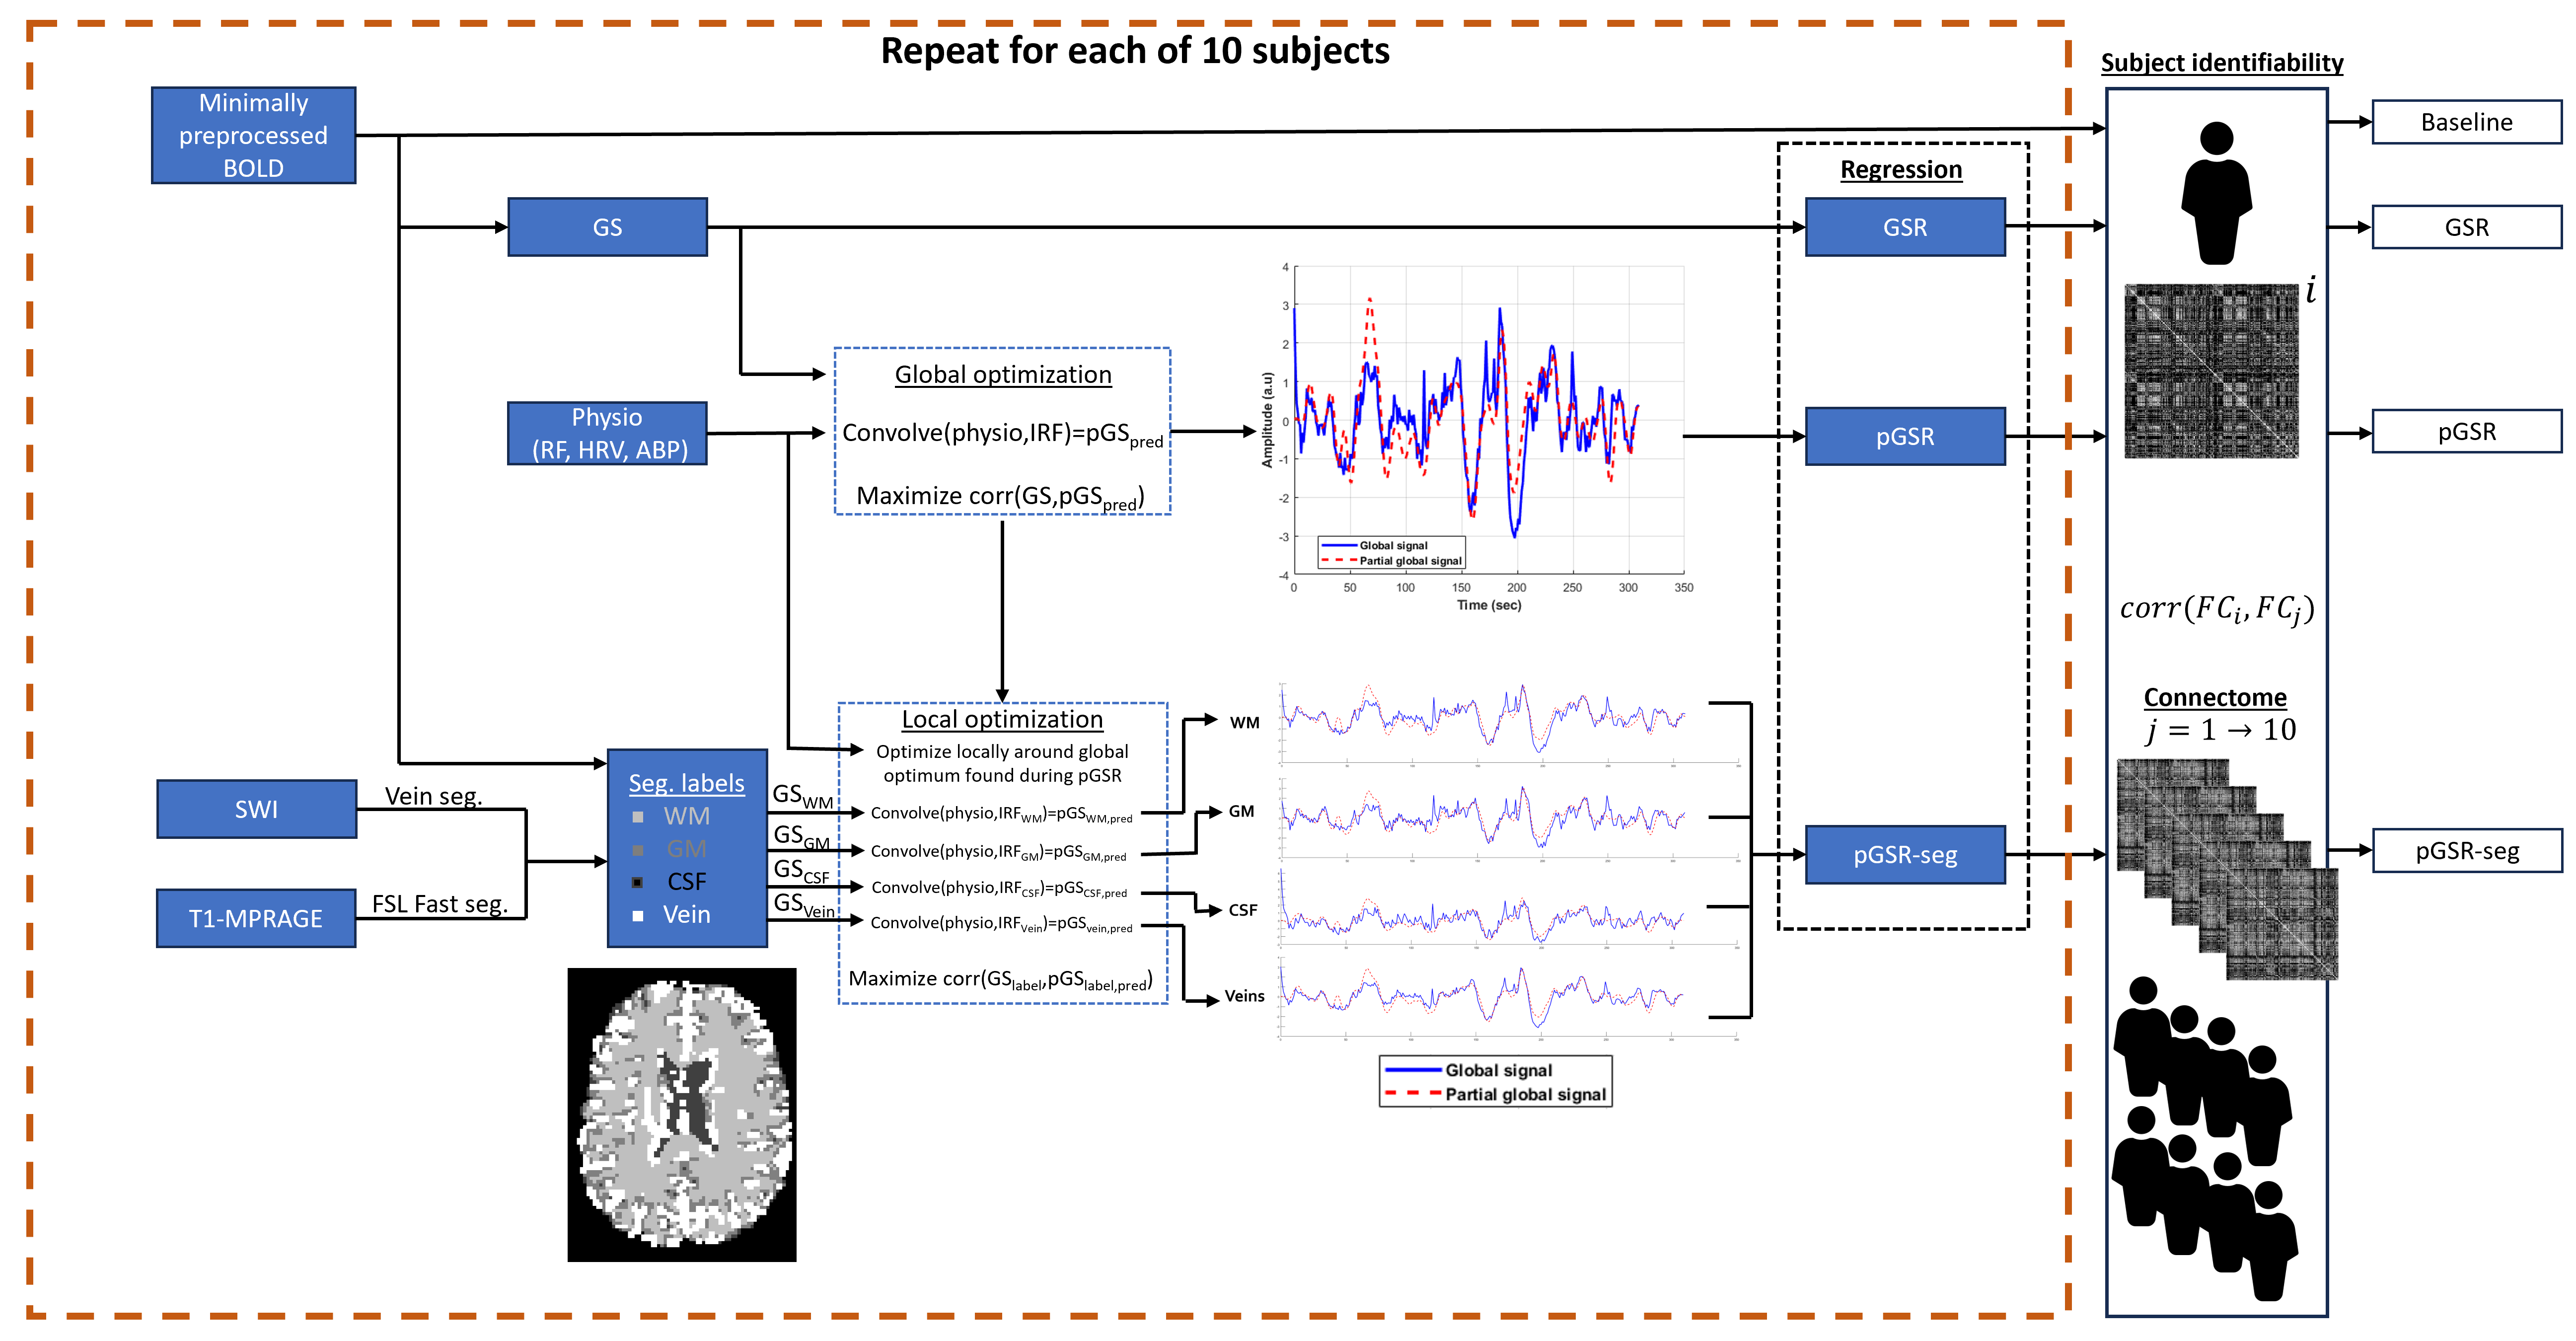
Functional and structural images were acquired in 10 subjects at the Montreal General Hospital on a Siemens 3T Prisma (Erlangen, Germany) using a 64-channel head/neck coil and peripheral physiological recordings. The functional scan consisted of a 309 second resting-state whole brain accelerated EPI sequence. The structural images were acquired with a T1-MPRAGE sequence and a SWI sequence (see Fig. 1).Extraction of the brains was performed using BET7. The BOLD data was minimally preprocessed using FSL8 (5mm gaussian kernel spatial smoothing, 100sec high-pass filtering, slice-timing correction, motion correction, EPI distortion correction, and registration to standard space). SWI images were preprocessed using CLEAR-SWI9, with the vasculature extracted using a pipeline based on Braincharter Vasculature Extraction10.
The sLFOs were extracted by fitting the respiratory flow (RF), heart rate variability (HRV), and arterial blood pressure (ABP) fluctuations on the global signal (GS) using subject-specific physiological response functions for all three signals, which were estimated using double gamma functions (see 1 for a detailed explanation). The sLFOs were then correlated voxel wise for each subject to obtain the sLFO maps.
Co-registration of the sLFO maps and the SWI onto the structural space was performed using FSL8 and in-house code. A box filter of 15x15x15 voxels was applied onto the vasculature maps to blur the venograms to account for BOLD signal leakage around the large veins11.
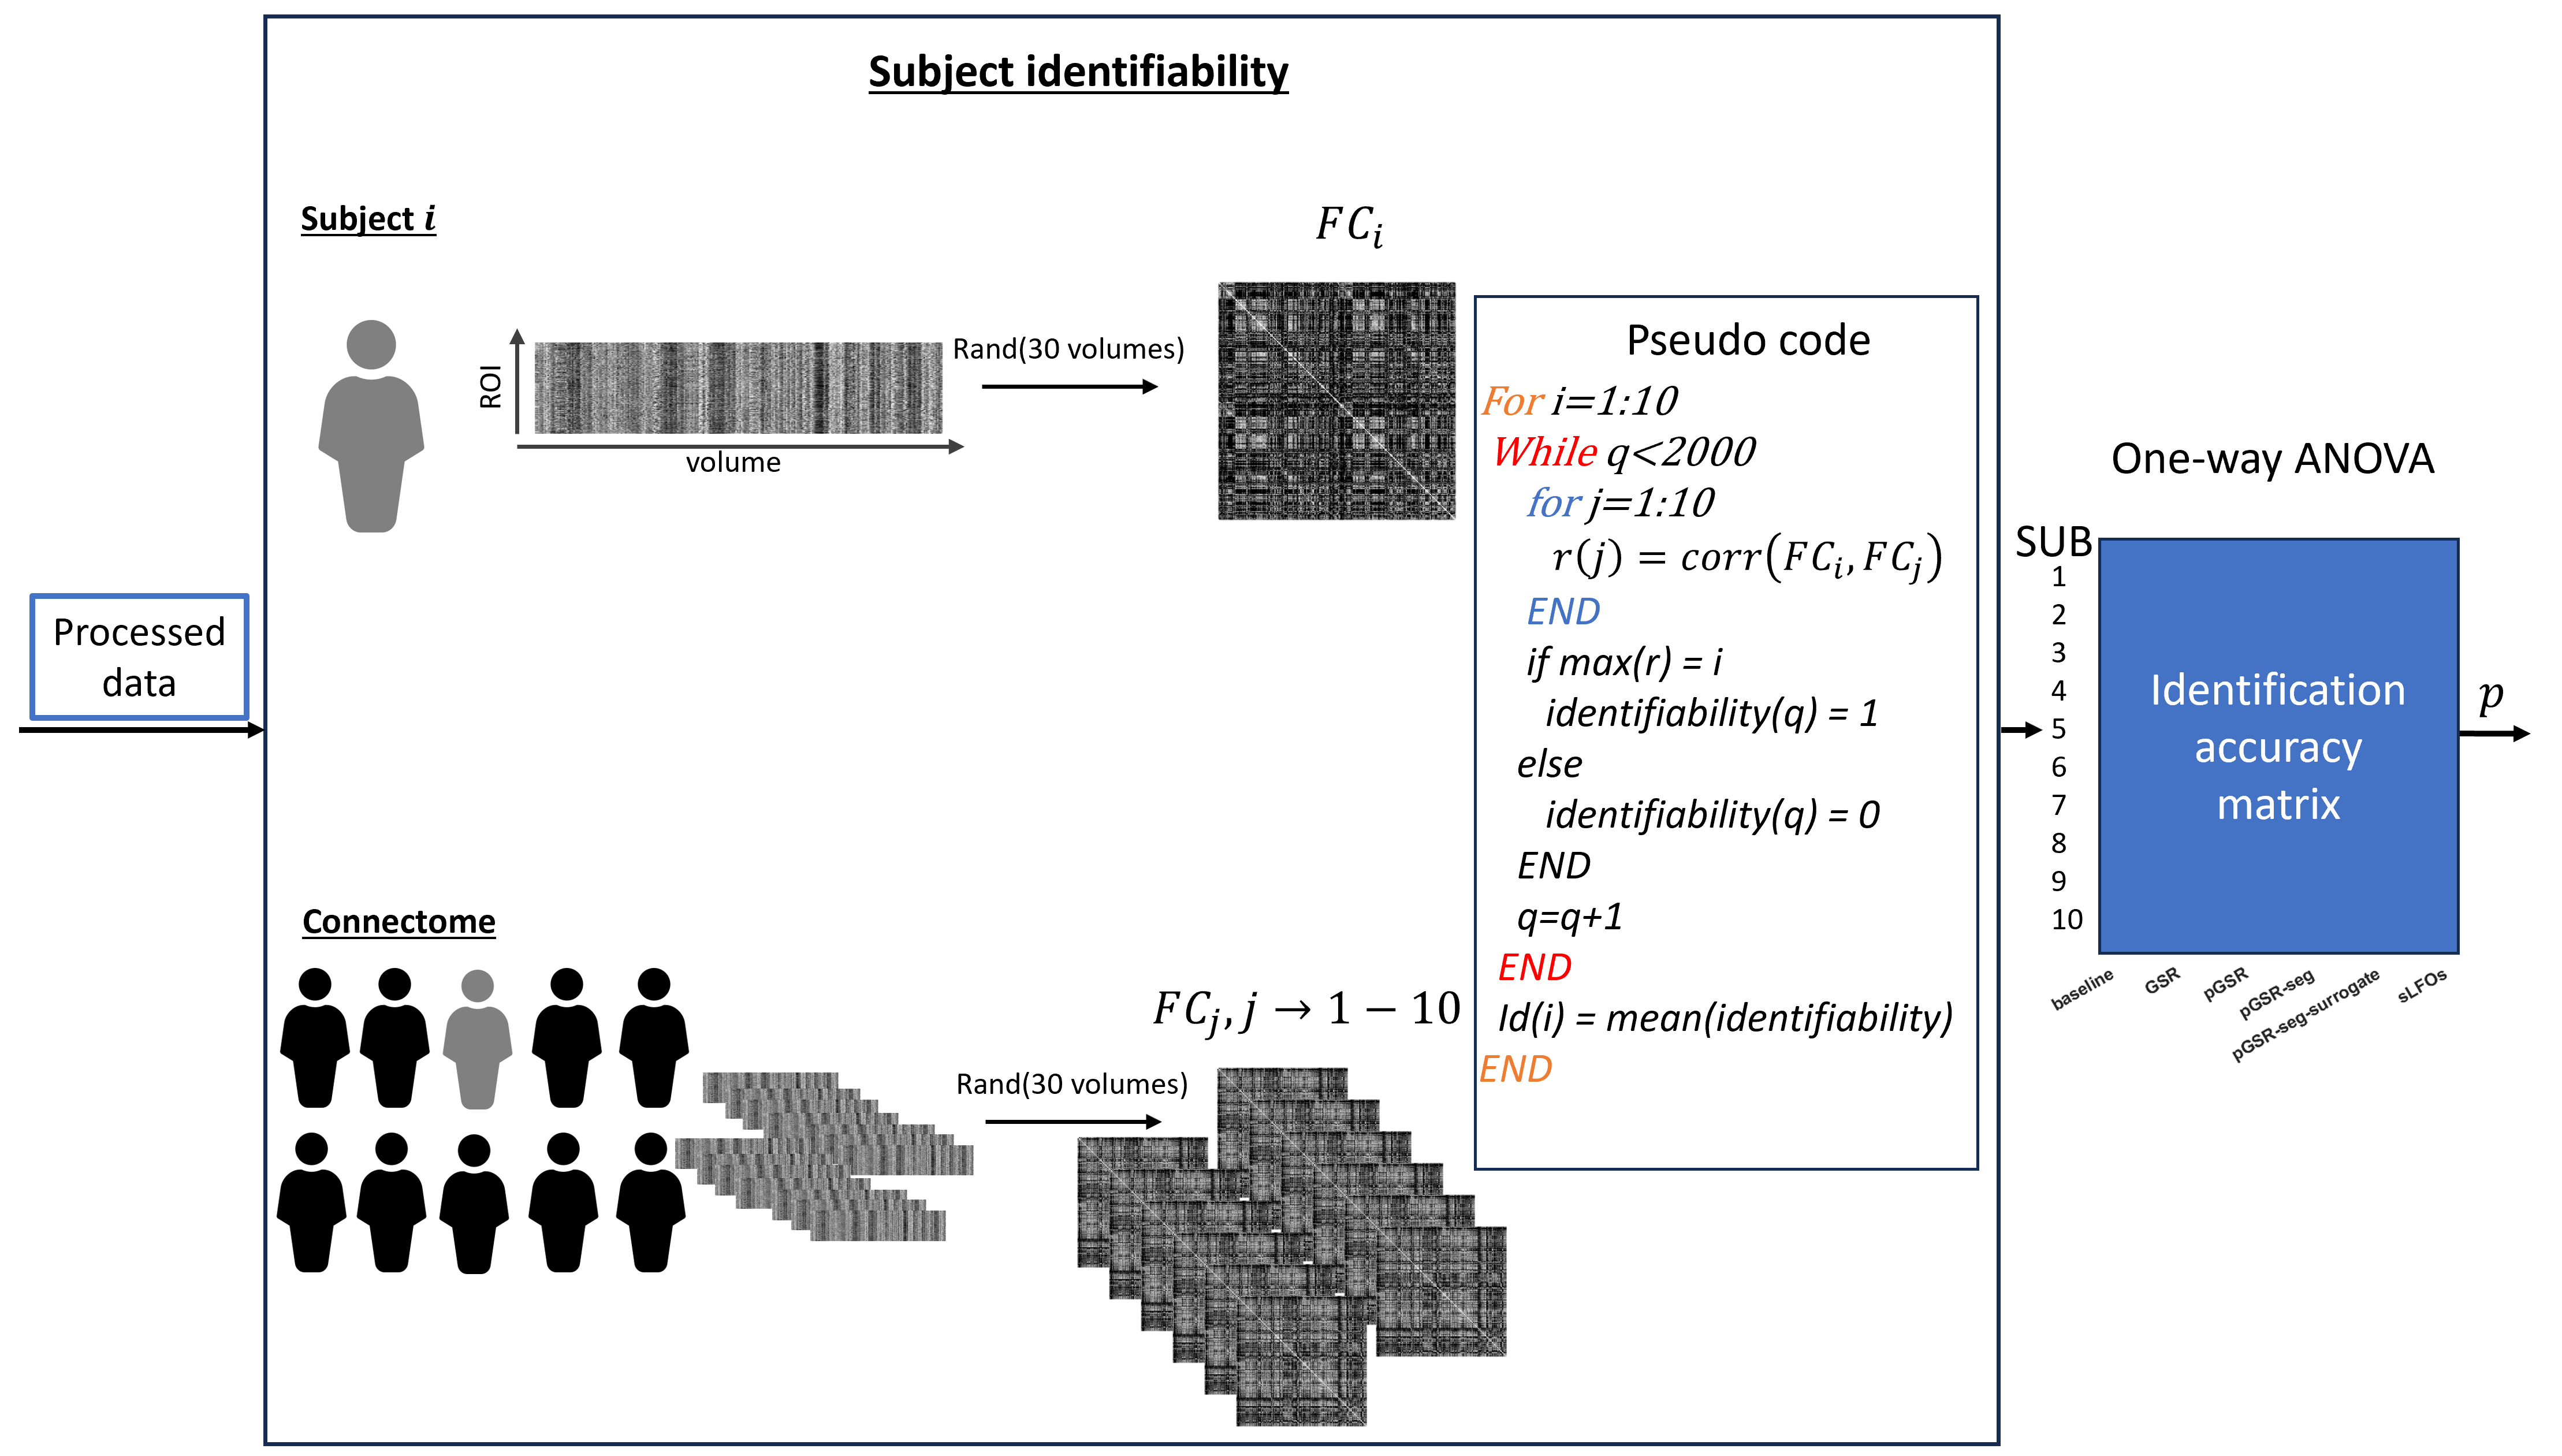
To measure identifiability, parcellated BOLD data (Schaefer 300 17 networks12) was processed in four different ways (baseline, GSR, pGSR, and pGSR-seg. See Fig. 2 for details). Subject identification through static functional connectivity (FC) was performed 2000 times per subject, with a calculation using 30 randomly selected consecutive volumes. Identification was deemed to be successful if the correlation between the subject’s FC matrix and a specific connectome FC matrix belonging to the same participant was maximized12.
Results
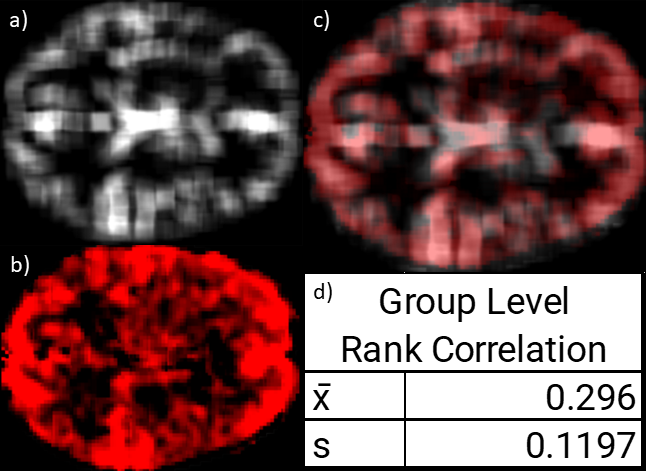
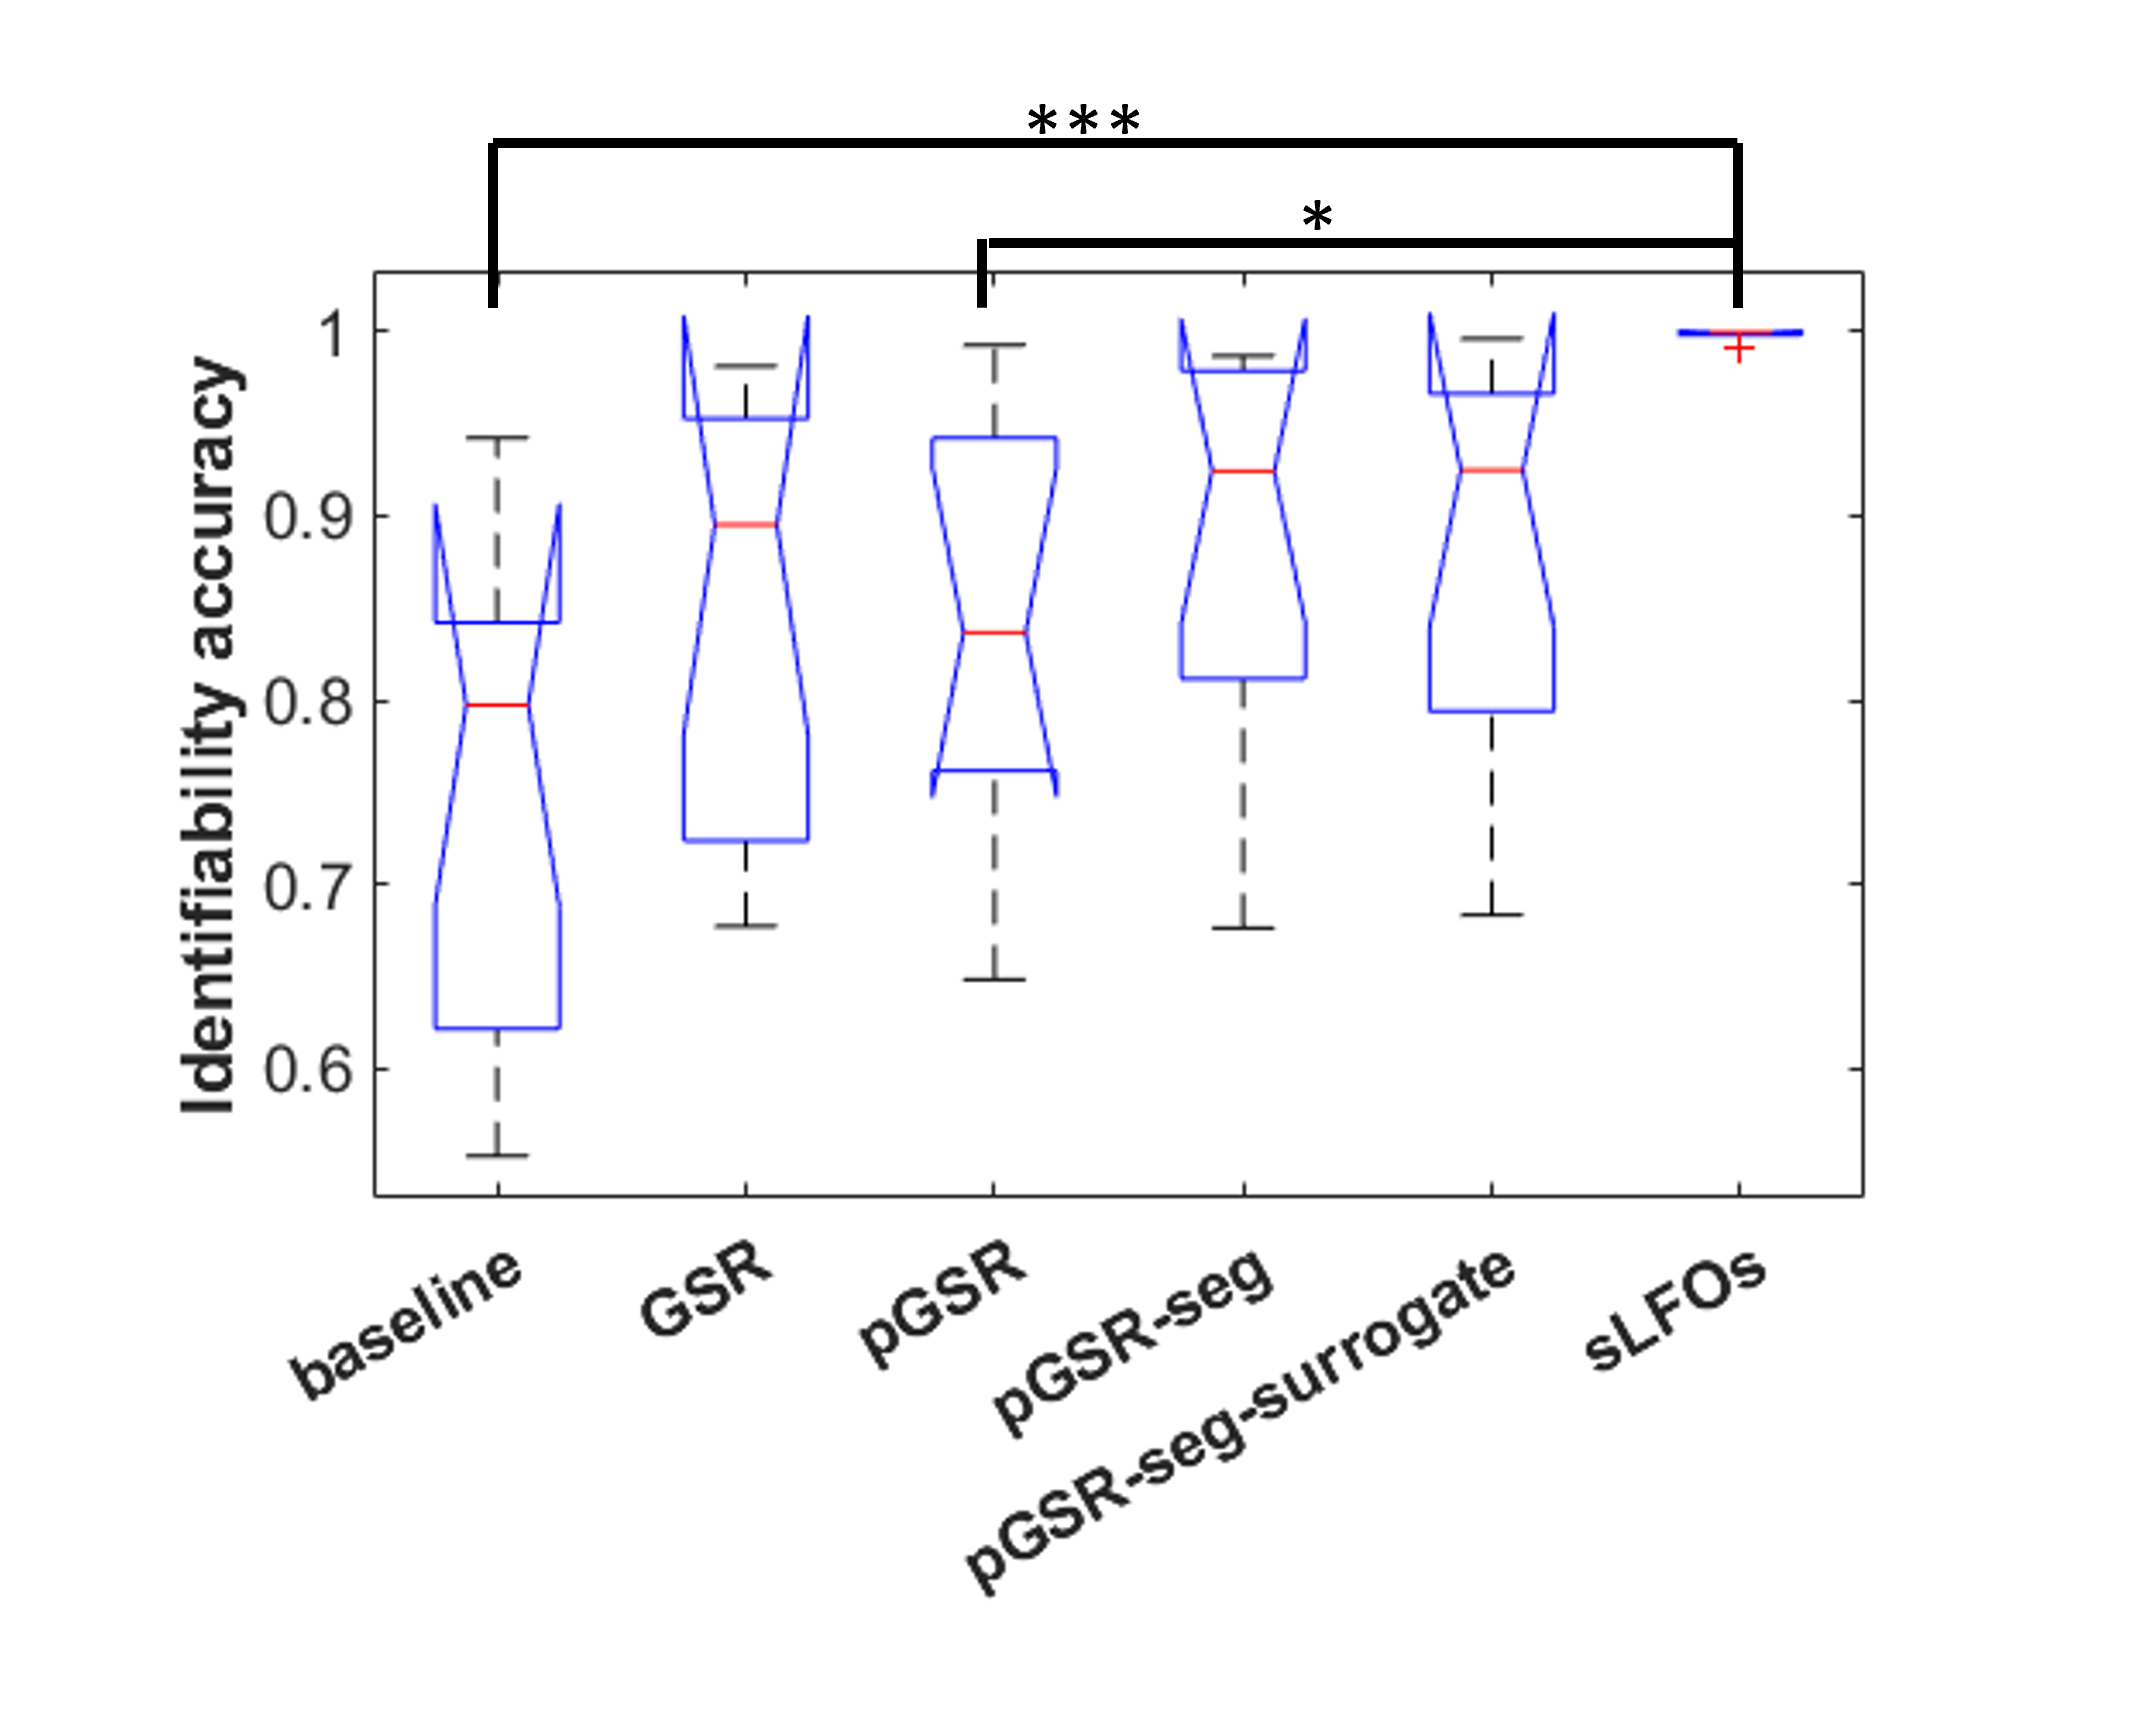
Spearman’s correlation analysis between the physio maps and venograms showed moderate positive average correlation (Fig. 3).Our results showed an increase in mean identifiability between GSR and pGSR-seg (Fig. 4). However, the increase was not statistically significant. Moreover, repeating pGSR-seg with phase shuffled physiological data (pGSR-seg-surrogate) resulted in a similar mean identifiability compared to pGSR-seg. The identifiability when using the isolated sLFO was significantly higher than the baseline and pGSR identifiability.
Discussion
The BOLD signal is known to leak around the vessels11; therefore, the box smoothing filter was employed to simulate this leakage. The correlation between sLFO maps and venograms overall confirms the vascular origin of sLFO effects on the BOLD signal. We believe that this may have important implications for the correction of physiological noise in the BOLD-fMRI, especially at higher field strengths where physiological noise is more important13, and whereby more accurate venograms can be obtained.The increase in identifiability does suggest that using the pGSR-seg protocol may improve denoising performance6. However, with the surrogate and sLFO data showing such high identifiability, it also suggests that the regression may be also artificially creating fingerprints on the data. Replication of this experiment on a dataset with multiday scans (e.g. HCP dataset) and a sample size considerably higher than ten would likely provide more conclusive outcomes regarding the impact of pGSR-seg and whether these effects are subject-specific or scan-specific. Furthermore, our results confirms that identifiability has strong associations with not only neural signals, but also physiological noise6.
Conclusion
Developing a better understanding of the spatial link between sLFOs, brain vasculature, and the BOLD-fMRI can improve the interpretability of fMRI experiments. Fine tuning methodologies such as the proposed pGSR-seg may lead to improved processing pipelines that reduce their impact on neural signals. We aim to apply the pGSR-seg technique to larger, multiday datasets.Acknowledgements
The authors would like to thank NSERC and FRQNT for funding Andrew and Rémi’s work on the project, respectively. Furthermore, the authors would like to acknowledge the Biosignals and Systems Analysis group for their insight in the project.References
1. Kassinopoulos, M. & Mitsis, G. D. Physiological noise modeling in fMRI based on the pulsatile component of photoplethysmograph. NeuroImage 242, 118467 (2021).
2. Tong, Y., Hocke, L. M. & Frederick, B. B. Low Frequency Systemic Hemodynamic “Noise” in Resting State BOLD fMRI: Characteristics, Causes, Implications, Mitigation Strategies, and Applications. Front. Neurosci. 13, 787 (2019).
3. Li, J. et al. Global Signal Regression Strengthens Association between Resting-State Functional Connectivity and Behavior. NeuroImage 196, 126–141 (2019).
4. Hahamy, A. et al. Save the Global: Global Signal Connectivity as a Tool for Studying Clinical Populations with Functional Magnetic Resonance Imaging. Brain Connect. 4, 395–403 (2014).
5. Murphy, K. & Fox, M. D. Towards a consensus regarding global signal regression for resting state functional connectivity MRI. NeuroImage 154, 169–173 (2017).
6. Xifra-Porxas, A., Kassinopoulos, M. & Mitsis, G. D. Physiological and motion signatures in static and time-varying functional connectivity and their subject identifiability. eLife 10, e62324 (2021).
7. Smith, S. M. Fast robust automated brain extraction. Hum. Brain Mapp. 17, 143–155 (2002).
8. Jenkinson, M., Beckmann, C. F., Behrens, T. E. J., Woolrich, M. W. & Smith, S. M. FSL. NeuroImage 62, 782–790 (2012).
9. Eckstein, K. et al. Improved susceptibility weighted imaging at ultra-high field using bipolar multi-echo acquisition and optimized image processing: CLEAR-SWI. NeuroImage 237, 118175 (2021).
10. Bernier, M., Cunnane, S. C. & Whittingstall, K. The morphology of the human cerebrovascular system. Hum. Brain Mapp. 39, 4962–4975 (2018).
11. Turner, R. How Much Cortex Can a Vein Drain? Downstream Dilution of Activation-Related Cerebral Blood Oxygenation Changes. NeuroImage 16, 1062–1067 (2002).
12. Schaefer, A. et al. Local-Global Parcellation of the Human Cerebral Cortex from Intrinsic Functional Connectivity MRI. Cereb. Cortex 28, 3095–3114 (2018).
13. Hutton, C. et al. The impact of physiological noise correction on fMRI at 7T. NeuroImage 57, 101–112 (2011).
Figures