3270
Voxel-wise DCE-MRI model selection impacts estimates of blood-brain barrier leakage in stroke1Division of Psychology, Communication and Human Neuroscience, University of Manchester, Manchester, United Kingdom, 2Geoffrey Jefferson Brain Research Centre, Manchester, United Kingdom, 3Division of Informatics, Imaging and Data Science, University of Manchester, Manchester, United Kingdom, 4Division of Cardiovascular Science, University of Manchester, Manchester, United Kingdom, 5Manchester Centre for Clinical Neurosciences, Northern Care Alliance NHS Foundation Trust, Manchester, United Kingdom, 6Philips, Farnborough, United Kingdom, 7University College London, London, United Kingdom, 8Lancaster Medical School, Lancaster University, Lancaster, United Kingdom, 9Department of Neurology, Lancashire Teaching Hospitals NHS Foundation Trust, Preston, United Kingdom
Synopsis
Keywords: Data Processing, DSC & DCE Perfusion, Blood-brain barrier; Biology, methods and models; Modelling; Permeability
Motivation: Different models of DCE-MRI tracer leakage may fit better in different brain regions in cerebrovascular disease and could provide additional insight into BBB function.
Goal(s): Demonstrate the utility of voxel-wise DCE-MRI model selection in stroke.
Approach: Fit the Extended Tofts, Patlak, and Intravascular models of DCE-MRI tracer leakage to data from controls, ischaemic stroke, and intracerebral haemorrhage patients on a voxel-wise basis, and select the best-fitting model for each voxel using the Akaike Information Criterion.
Results: Different models are preferred in different tissue types and disease groups. Model selection increases inter-patient variance of Ktrans compared to Patlak alone.
Impact: The Patlak model may not be the most appropriate model for DCE-MRI measurements of blood-brain barrier leakage in ischaemic stroke. Best-fitting model maps could help delineate the extent of “leaky” vs “non leaky” regions based on nested model assumptions.
Background
Dynamic contrast-enhanced (DCE)-MRI can detect blood-brain barrier (BBB) dysfunction in neurological disease. Quantitative analysis of DCE-MRI data involves fitting a kinetic model of tracer leakage to estimate useful parameters such as the contrast agent volume transfer constant, Ktrans.There are several possible models (figure 1), which are nested based on a series of assumptions: the Extended Tofts model1 (ETM) models tracer exchange between finite intravascular and extravascular spaces. This simplifies to the Patlak model2 if there is no backflux of the tracer after it has left the intravascular compartment, and simplifies further to the Intravascular model3 in the case where there is no tracer leakage, valid for a completely intact BBB. It is conventional to fit a single model to the entire brain; the Patlak model in particular has been shown to fit well in cerebrovascular disease4 and is widely applied. Selection of the best-fitting model on a voxel-wise basis has not been demonstrated in the brain.
We have applied voxel-wise model selection to three cohorts representative of mild to severe cerebrovascular disease: controls with vascular risk factors, chronic ischaemic stroke, and acute intracerebral haemorrhage (ICH). We hypothesise that different pathophysiological tissue types will be better represented by different models, and aim to explore how this influences Ktrans values compared to the conventional application of the Patlak model across the entire brain.
Methods
Patient Groups – Data from two previous studies5–7 were combined for this work, consisting of three patient groups: 12 older controls with various vascular risk factors but no stroke, 14 chronic (greater than 3 months after onset) ischaemic stroke and 32 acute (1-3 days after onset) ICH patients.DCE-MRI Acquisition – 80 3D-T1-FFE images were acquired with a 10° flip-angle, TR/TE=2.4/0.8ms, spatial resolution=1.5×1.5×4mm3, temporal resolution=7.6s, acquisition time=10min.On the 8th dynamic, a 0.1mmol/kg bolus of Dotarem was administered using a power injector.
MRI Analysis – Quantities, processes and model definitions are OSIPI CAPLEX compliant8: A pre-contrast T1-map was used to convert signal to contrast-agent concentration. The vascular input function was obtained from 50 voxels in the sagittal sinus. The ETM, Patlak, and Intravascular (One-compartment, no indicator exchange model) models were fit to the data on a voxel-wise basis using Madym v4.23.09 as visualised in figure 1 to produce maps of vp, Ktrans, and ve where applicable.
Model Selection – The Akaike information criterion10 was used to determine the best-fitting model for each voxel. A total of four groups are defined: ‘Intravascular’, ‘Patlak’, ‘ETM’, and ‘No Model’, where vp=0 in the simplest model and the tissue is presumed to be non-perfused (e.g. in CSF), meaning that none of the models are appropriate. Ktrans values from the best-fitting model were selected for each voxel to produce a ‘best-fitting’ Ktrans map.
Regions of interest – White matter hyperintensities were defined using the SPM LST toolbox11. Hematoma and perihematomal oedema were manually delineated in the ICH brains from T2w-FLAIR images and flipped about the midline to create a corresponding contralateral region. Cerebral cortex, cerebral white matter, and deep grey matter were segmented using FreeSurfer v7.3.2 and voxels overlapping with the WMH, oedema, or hematoma regions discarded.
Results and Discussion
The conventionally used Patlak model is the dominantly preferred model in many but not all regions (Figures 2-3). There is greater inter-patient variance for the ‘best-fitting’ model Ktrans compared to Patlak across all regions. The ‘best-fitting’ Ktrans values are higher compared to the Patlak model for the cortex and white matter, but not deep grey matter, in ICH and controls (Figure 4). In terms of clinical impact, this result suggests that sub-optimal model choice may lead to underestimated Ktrans values in some regions. The differences between Ktrans values in pathological tissue and corresponding control regions are greater using the ‘best-fitting’ Ktrans values than Patlak alone, however this does not change the outcome of statistical comparisons (Figure 5).The ETM is largely preferred in all tissue types in the chronic stroke cohort, but not ICH (Figures 2-3). This result is surprising and suggests that Ktrans values may be underestimated when the Patlak model alone is used in this patient group, and that there is BBB impairment several months after ischaemic stroke.
Finally, it is difficult to define the spatial extent of leakage, or a binary of leaky/non-leaky tissue, from Ktrans maps alone. We propose that knowledge of the distribution of preferred models in a region may yield information about underlying BBB physiology: In cases where the ETM fits best, the BBB may be very leaky; where the intravascular model is preferred is likely to be healthy tissue.
Acknowledgements
OAJ is supported by an Engineering and Physical Sciences Research Council studentship. The intracerebral haemorrhage study was funded by an NIHR Clinician Scientist Award (CS-2014-14-005) to APJ. For controls and ischaemic stroke data, work was funded by Lancaster University, Sydney Driscoll Neuroscience Foundation, The University of Manchester and Medical Research Council Studentship, Lancashire Teaching Hospitals NHS Foundation Trust, and the Engineering and Physical Sciences Research Council (EP/M005909/1).References
1. Tofts PS, Brix G, Buckley DL, et al. Estimating kinetic parameters from dynamic contrast-enhanced t1-weighted MRI of a diffusable tracer: Standardized quantities and symbols. Journal of Magnetic Resonance Imaging. 1999;10(3):223-232.
2. Patlak CS, Blasberg RG, Fenstermacher JD. Graphical Evaluation of Blood-to-Brain Transfer Constants from Multiple-Time Uptake Data. Journal of Cerebral Blood Flow & Metabolism. 1983;3(1):1-7.
3. Sourbron SP, Buckley DL. Classic models for dynamic contrast-enhanced MRI. NMR in Biomedicine. 2013;26(8):1004-1027.
4. Heye AK, Thrippleton MJ, Armitage PA, et al. Tracer kinetic modelling for DCE-MRI quantification of subtle blood–brain barrier permeability. NeuroImage. 2016;125:446-455.
5. Al-Bachari S, Naish JH, Parker GJM, Emsley HCA, Parkes LM. Blood-Brain Barrier Leakage Is Increased in Parkinson’s Disease. Front Physiol. 2020;11:593026.
6. Jones OA, Mohamed S, Hinz R, Dickie BR, Parkes LM, Parry Jones AR. Association between PET-MR imaging measures of blood-brain barrier leakage and immune cell activation in acute intracerebral hemorrhage. Proceedings of the International Society of Magnetic Resonance in Medicine Annual Meeting and Exhibition, Toronto, 2023, #0036.
7. Abid KA, Sobowale OA, Parkes LM, et al. Assessing Inflammation in Acute Intracerebral Hemorrhage with PK11195 PET and Dynamic Contrast-Enhanced MRI. J Neuroimaging. 2018;28(2):158-161.
8. Dickie BR, Ahmed Z, Arvidsson J, et al. A community-endorsed open-source lexicon for contrast agent-based perfusion MRI: A consensus guidelines report from the ISMRM Open Science Initiative for Perfusion Imaging (OSIPI). Magn Reson Med. Published online October 13, 2023.
9. Berks M, Parker GJM, Little R, Cheung S. Madym: A C++ toolkit for quantitative DCE-MRI analysis. Published online 2021.
10. Akaike H. A new look at the statistical model identification. IEEE Transactions on Automatic Control. 1974;19(6):716-723.
11. Schmidt P, Gaser C, Arsic M, et al. An automated tool for detection of FLAIR-hyperintense white-matter lesions in Multiple Sclerosis. NeuroImage. 2012;59(4):3774-3783.
Figures
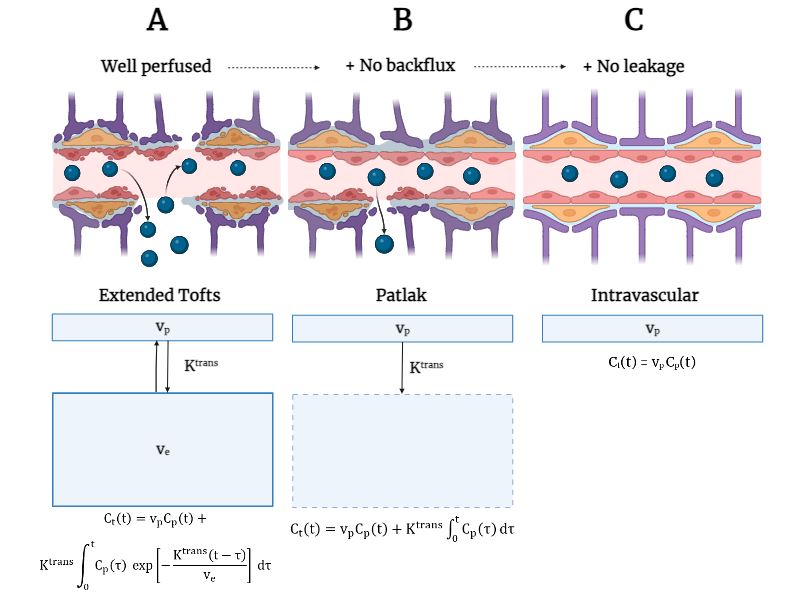
Figure 1 - Diagram representing the nested tracer kinetic models used in analysis and their associated assumptions. (A) The full Extended Tofts model (B) the Patlak model which assumes no backflux (C) the intravascular or ‘steady state’ model, which assumes no tracer leakage.
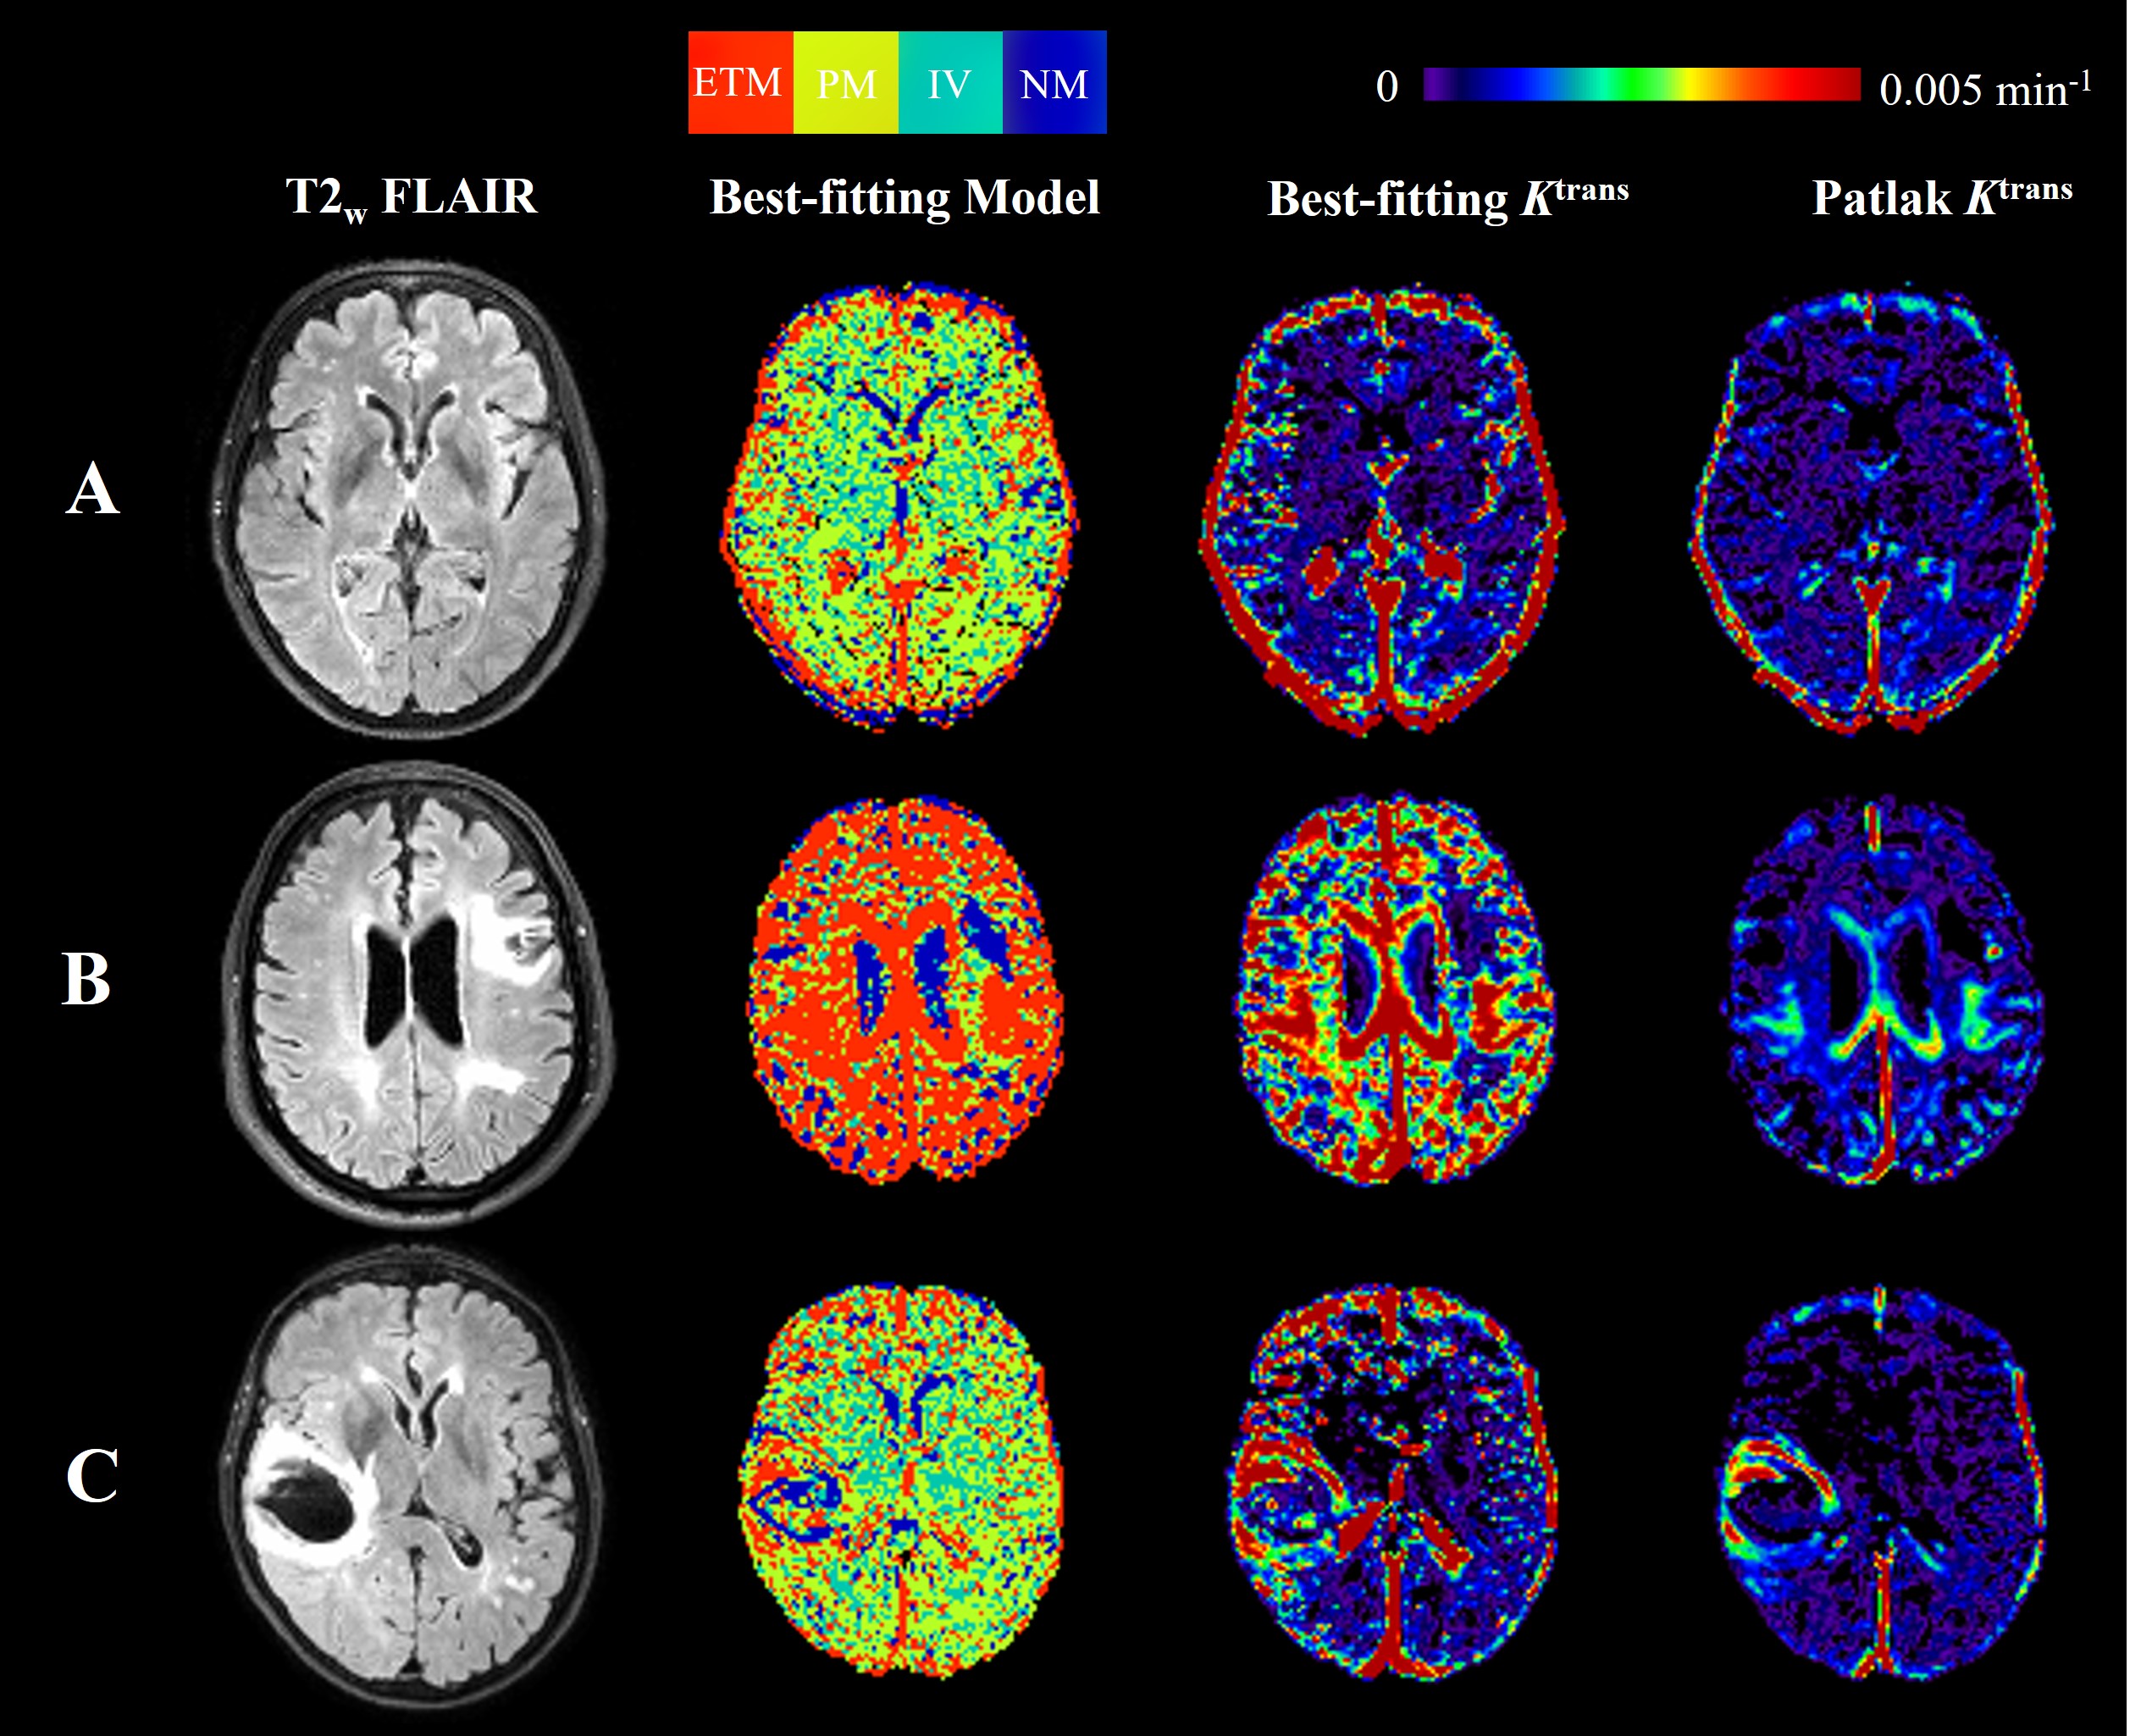
Figure 2 - Representative images for the three patient groups: (A) control, (B) chronic ischaemic stroke (C) acute intracerebral haemorrhage. A structural T2w FLAIR image, a map of the preferred model for each voxel, best-fitting Ktrans map, and Patlak Ktrans map are shown for each patient. For the model map, red corresponds to the ETM being the best-fitting model, yellow Patlak, green Intravascular, and blue poorly perfused or ‘no model’.
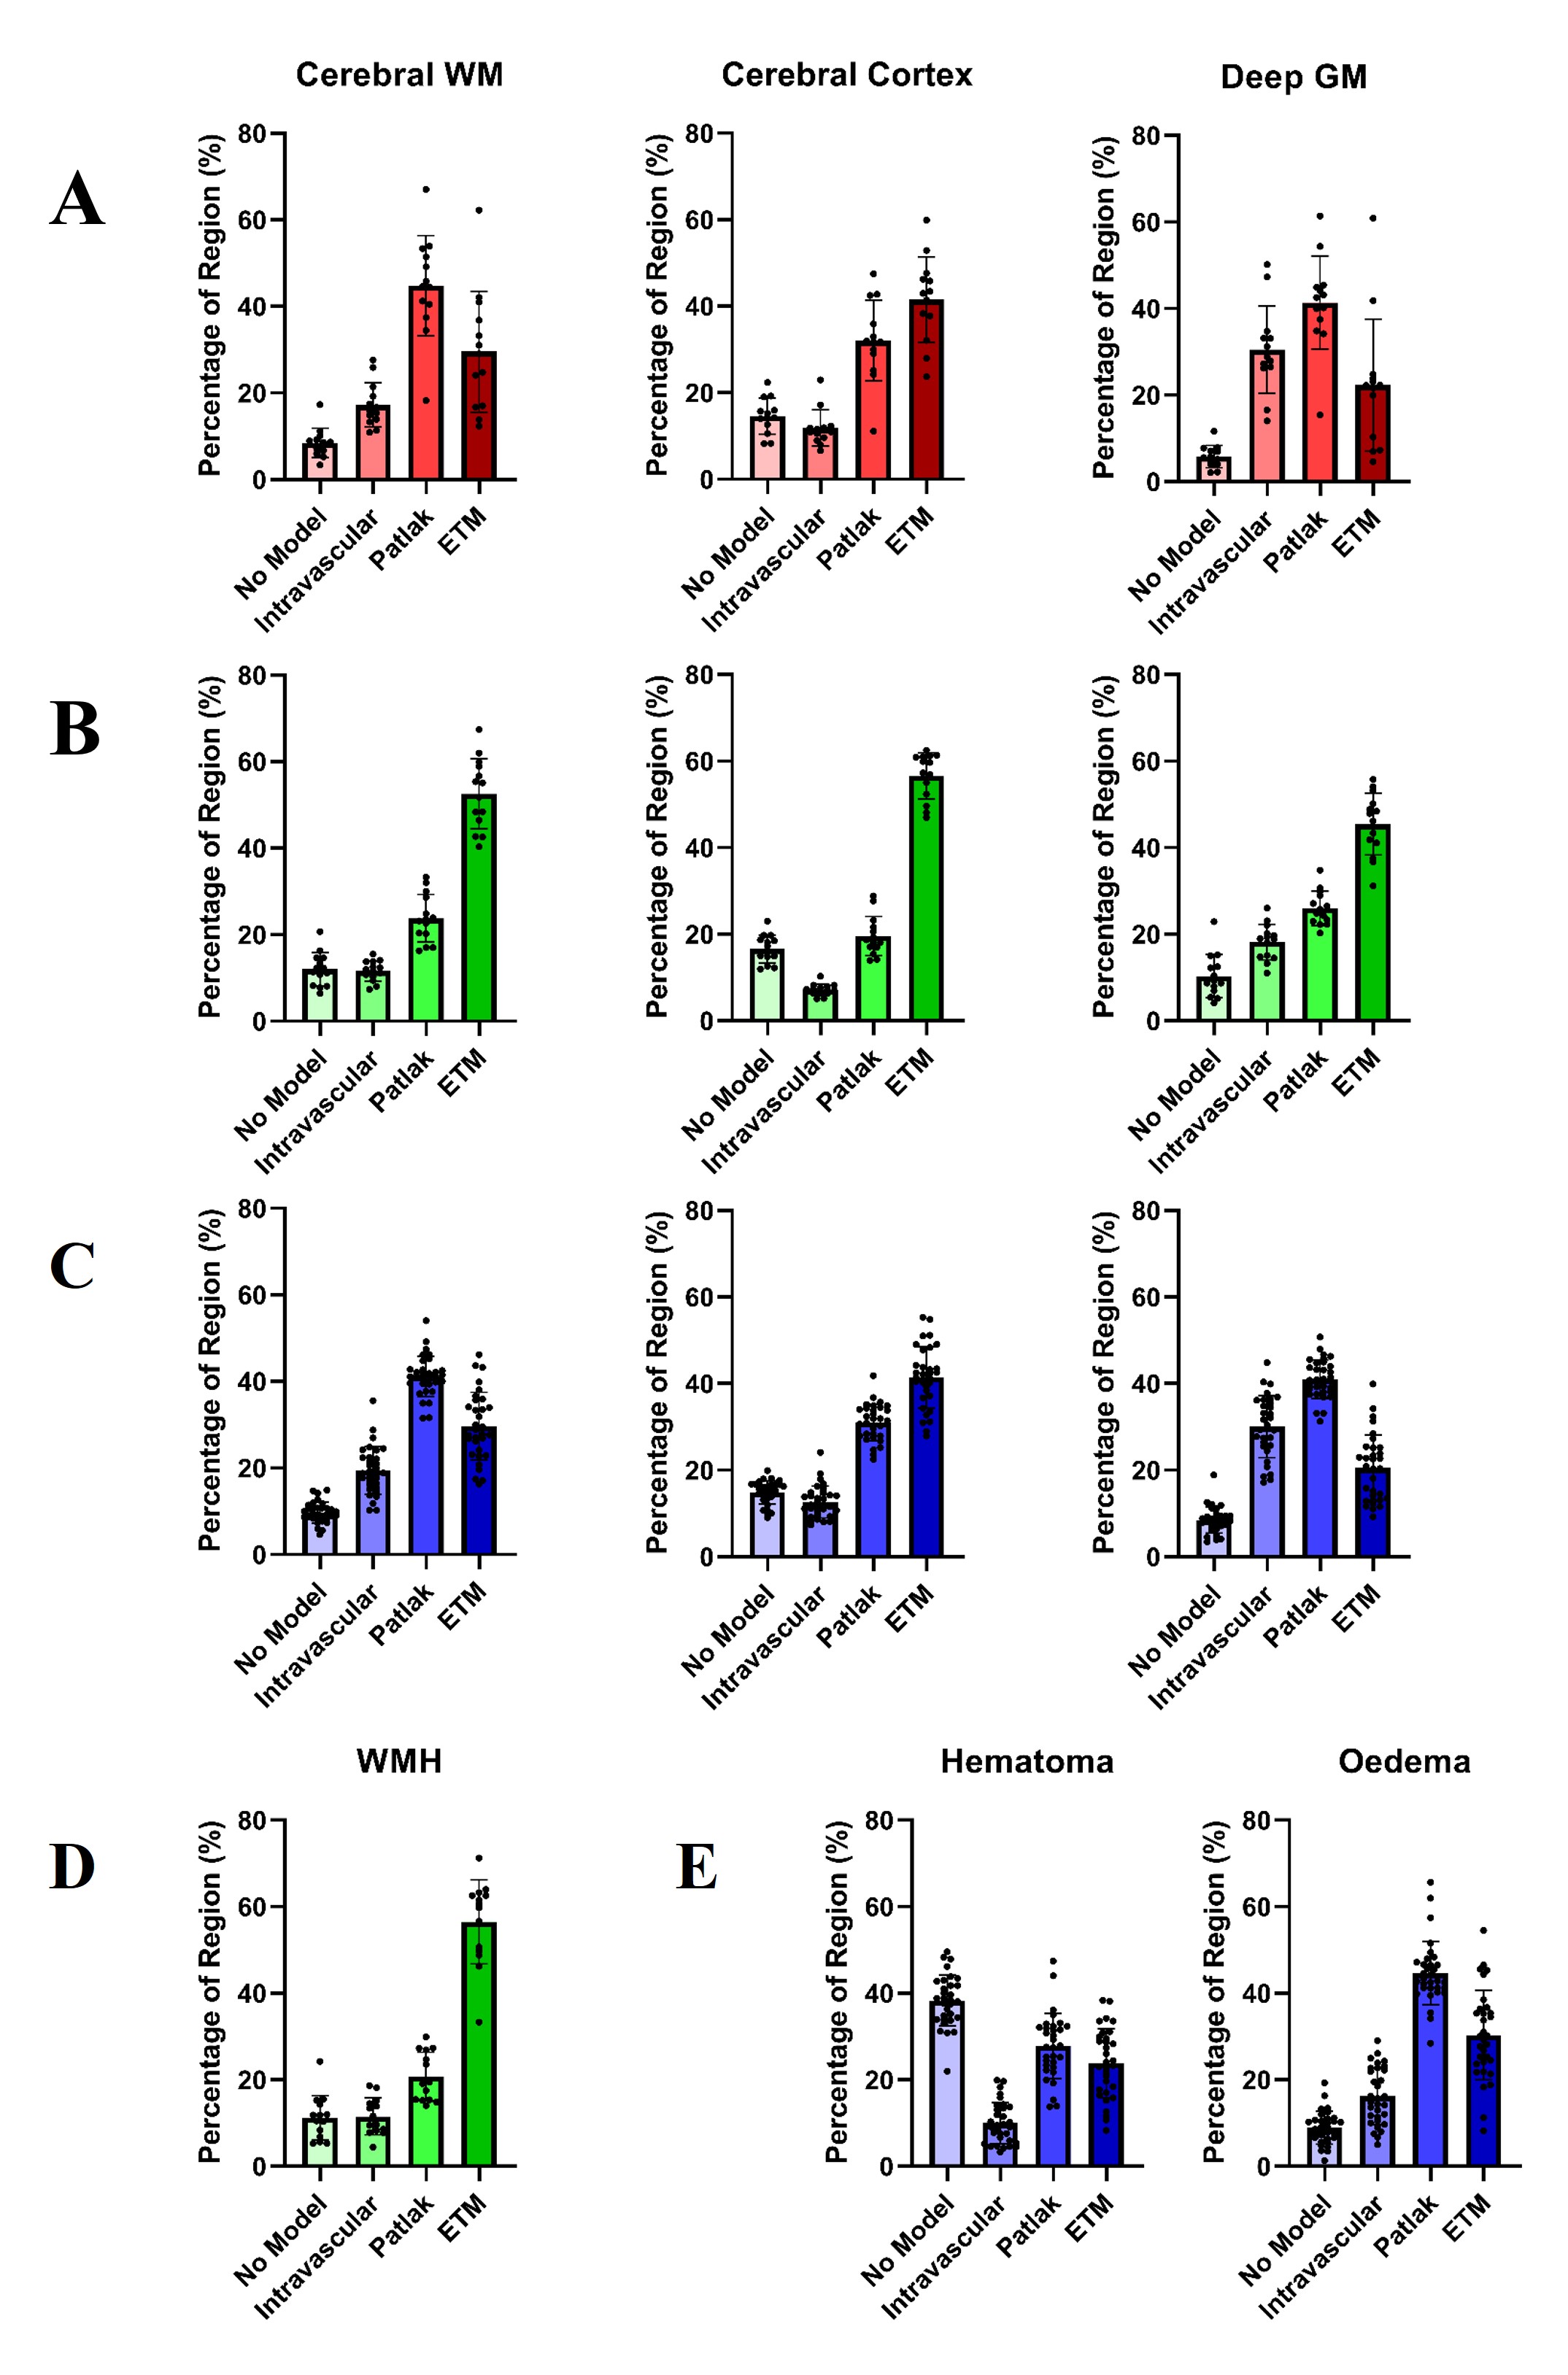
Figure 3 - Regional model preference for cerebral white matter, cortex, and deep grey matter in (A) controls (B) chronic ischaemic stroke, and (C) acute intracerebral haemorrhage. Regional model preference in pathological brain regions (D) white matter hyperintensities in ischaemic stroke and (E) the hematoma and oedema regions in intracerebral haemorrhage.
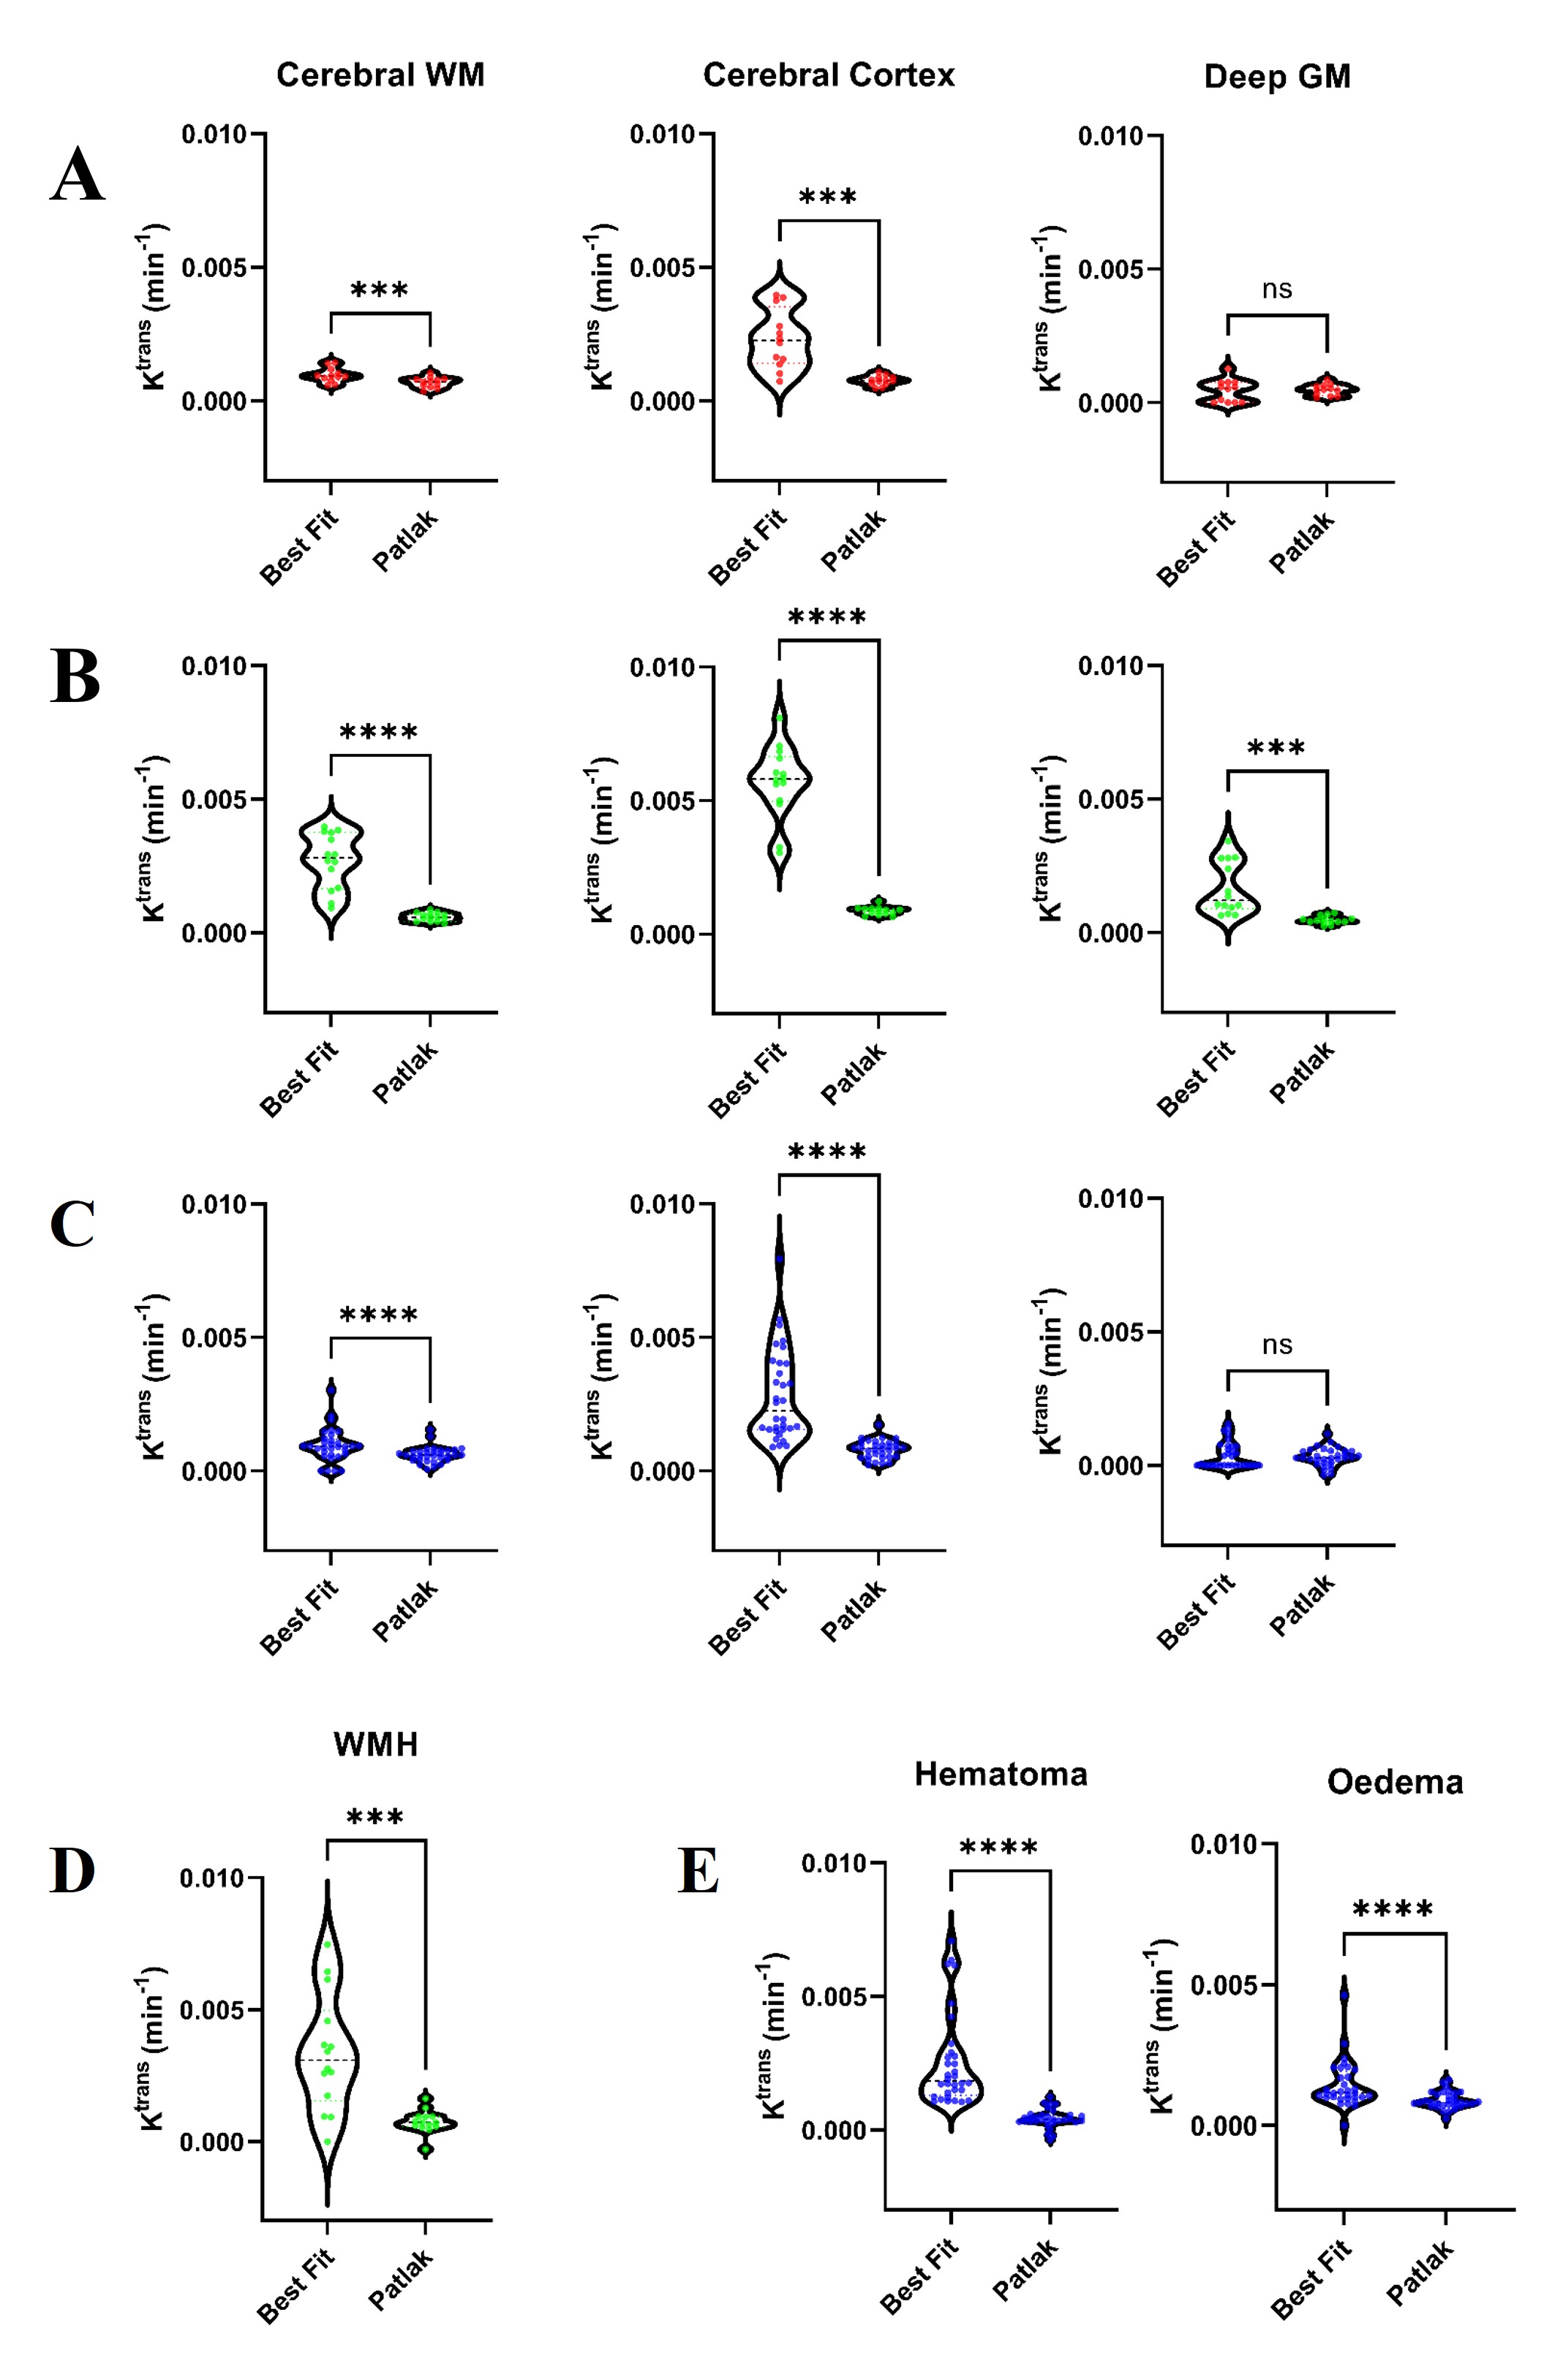
Figure 4 - Ktrans values from the ‘best-fitting’ model-selection tool and the conventional Patlak model for cerebral white matter, cerebral cortex, and deep grey matter in (A) controls, (B) chronic ischaemic stroke, and (C) acute intracerebral haemorrhage. 'Best-fitting' Ktrans values compared to Patlak Ktrans in pathological regions (D) white matter hyperintensities in ischaemic stroke and (E) hematoma and oedema regions in haemorrhage. Median Ktrans values from the ‘best-fitting’ model selection tool and the Patlak model alone were compared using paired t-tests with α=0.05.
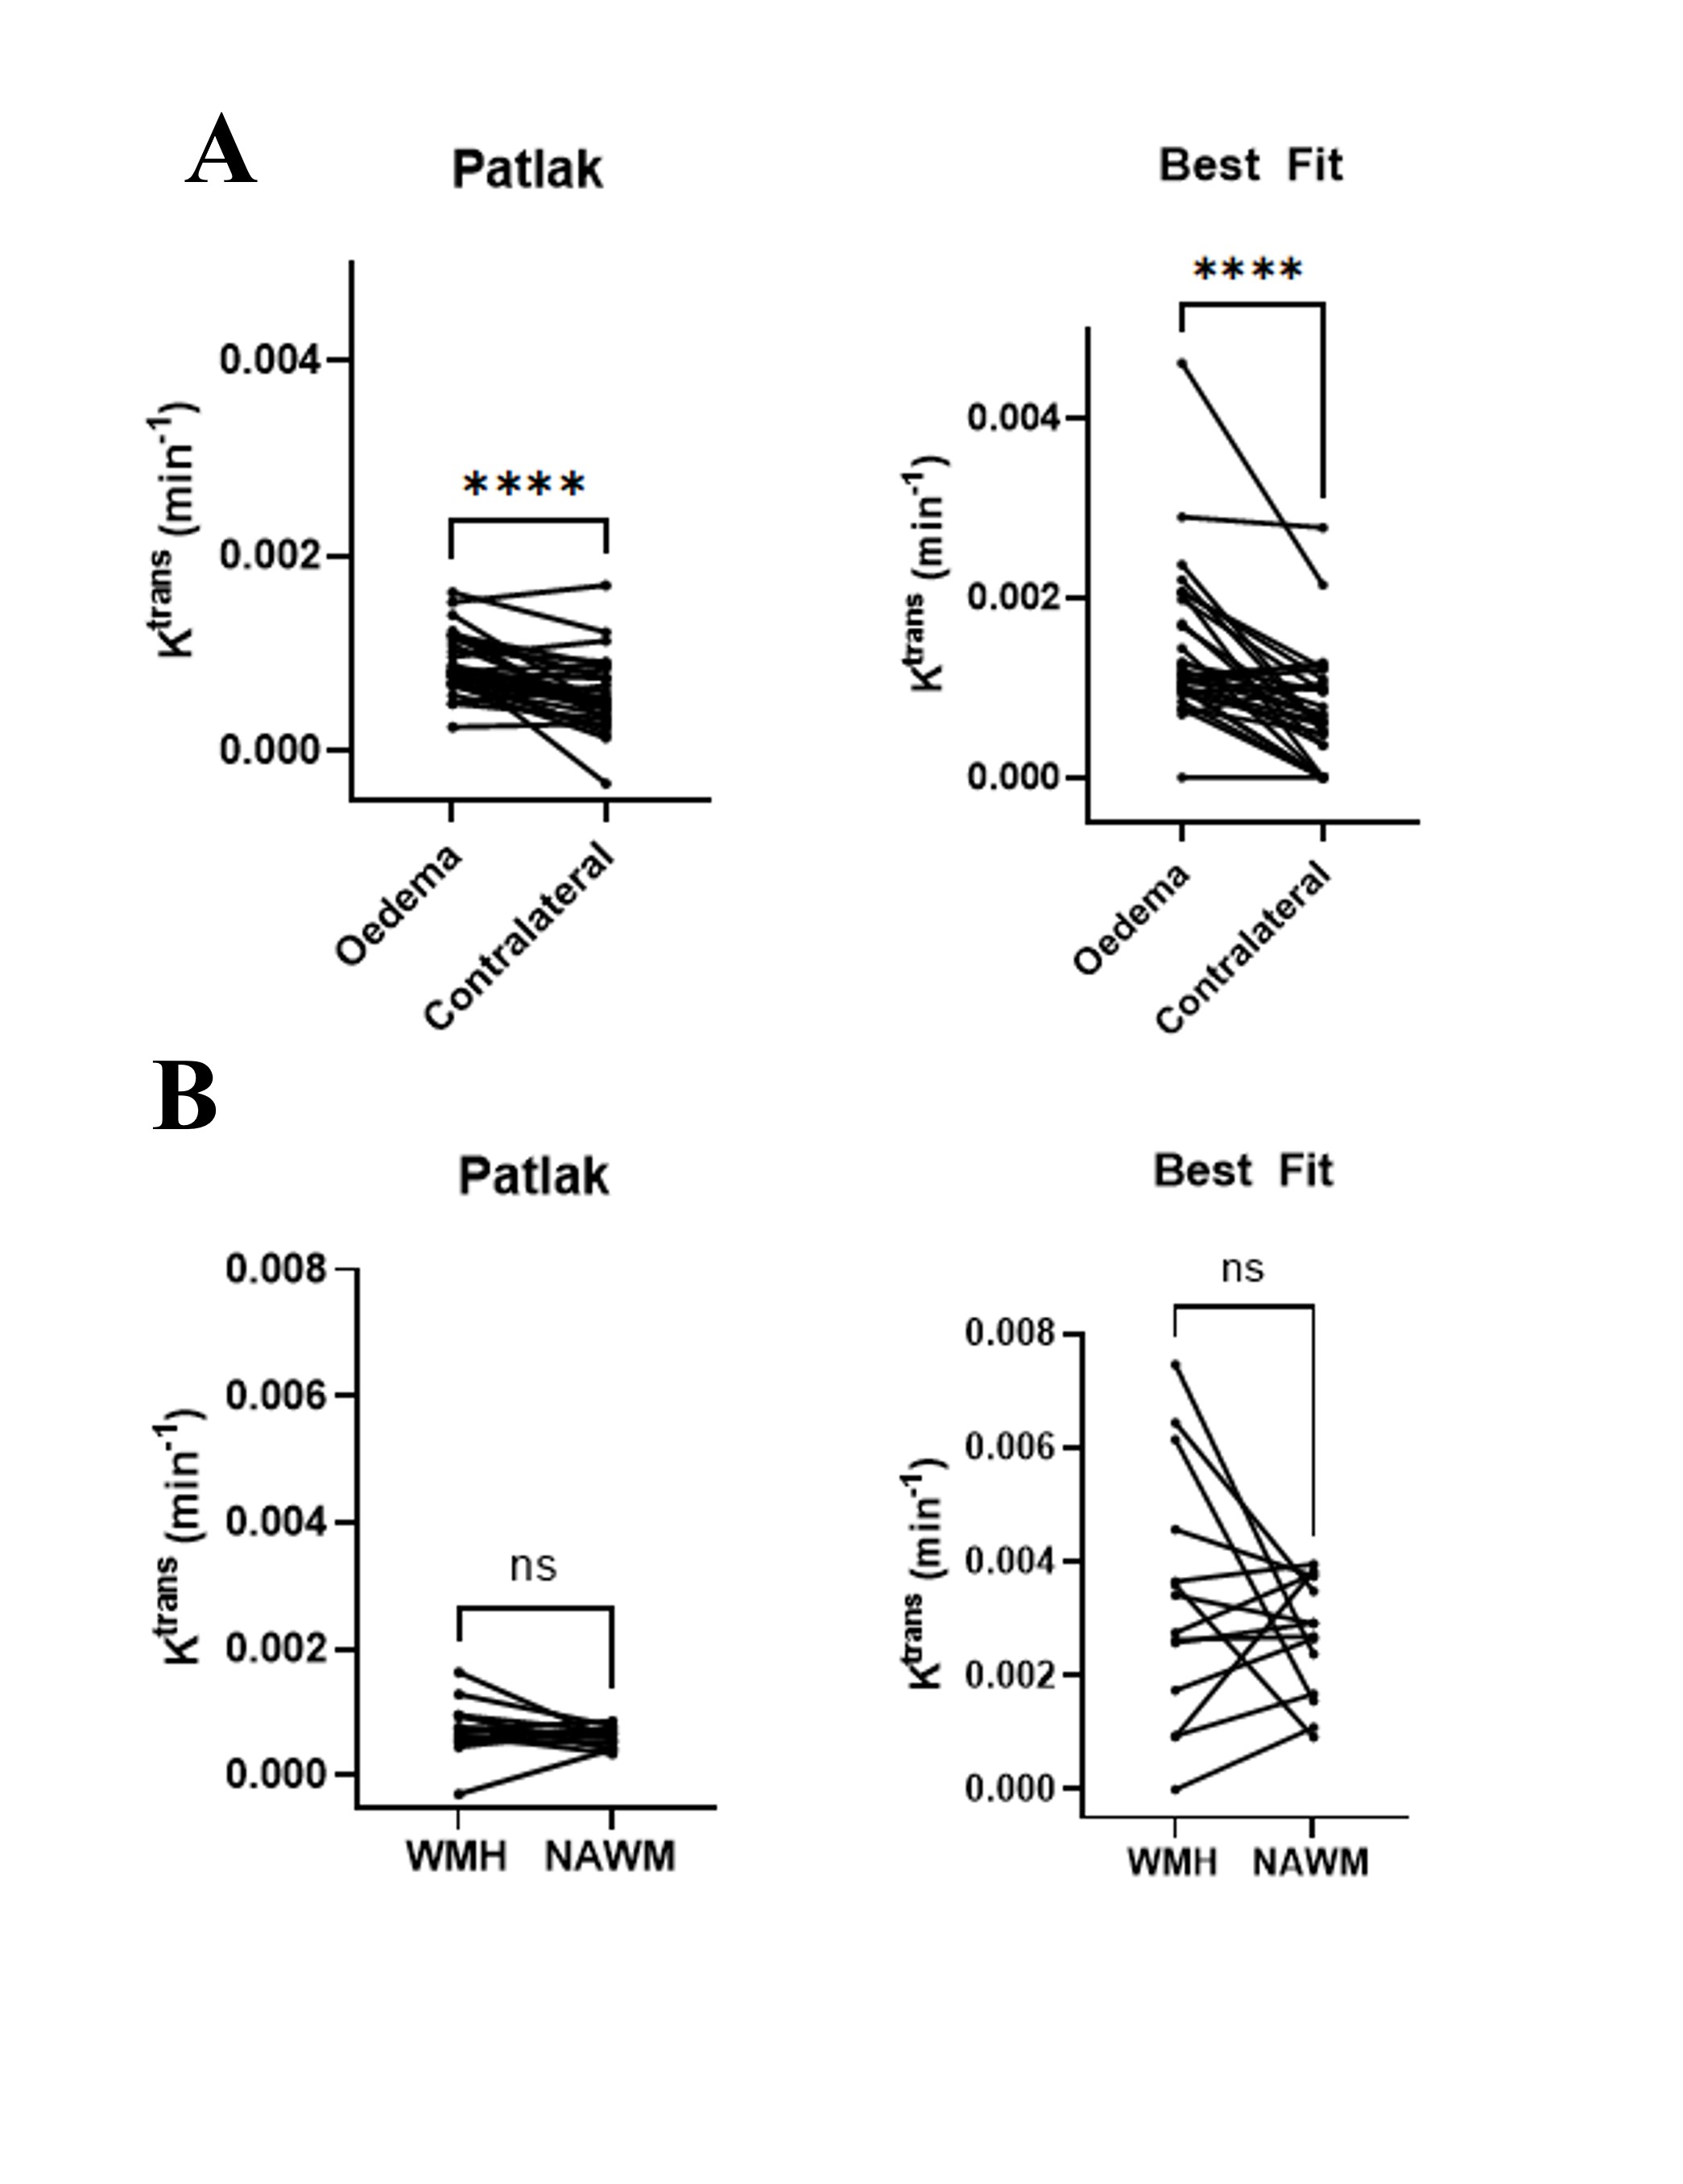
Figure 5 - Model comparisons in pathological brain regions. (A) Comparison of Ktrans values in the perihematomal oedema and contralateral control region for the Patlak and ‘best-fitting’ model. (B) Comparison of Ktrans values in the white matter hyperintensities and normal appearing white matter for the Patlak and ‘best-fitting’ model.