3268
The individuality of human brains when performing tasks1Department of Radiology, Michigan State University, East Lansing, MI, United States
Synopsis
Keywords: Data Processing, fMRI (task based)
Motivation: It is imperative to study individual brain functioning when performing tasks.
Goal(s): This study aims to develop a novel method to investigate the individuality of human brain functions.
Approach: The temporal correlation of a task-evoked activity with the time signal of every point in the brain quantifies the whole brain’s functional co-activity (FC). The spatial correlation of the FC maps of two task trials over the entire brain quantifies the degree of their co-activity, which measures the variation of brain activity when performing these two tasks.
Results: The measured trial-to-trial variation of the whole brain’s activity quantified individual brain functioning when performing tasks.
Impact: This study presents a novel method to investigate individual brain functioning when performing tasks. The quantified relationship of the whole brain activity with each performed task trial may characterizes the neural bases responsible for individual behavioral and clinical traits.
Introduction
BOLD-fMRI measures the whole brain’s activity at large-scale systems level1,2. Numerous fMRI studies have demonstrated its effectiveness and reliability in investigating the common features of brain functional organization at a group level, and the effects of brain disorders on brain activity. It is imperative, however, to study the functioning of an individual brain in order to understand the neural bases responsible for individual behavioral and clinical traits. Person-specific neuroimaging approaches in investigating individual brain functioning have been reported in the literature3-6. In this study we present a novel method to investigate task-evoked whole brain activity. The analysis is applied person-to-person and from trial-to-trial within each task category. It offers a means of characterizing the individuality of human brains when performing tasks.Methods and Materials
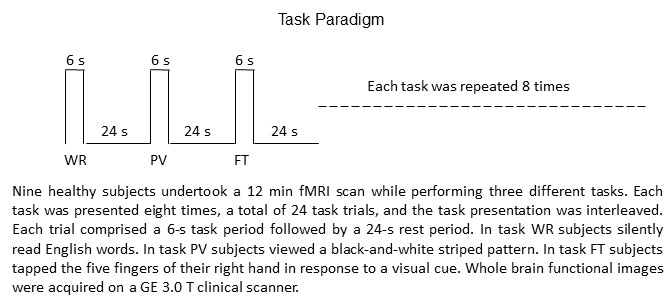
We extend our previous four studies7-10. Fig. 1 illustrates the task paradigm and image acquisition. Task-evoked brain activity can be characterized by an ideal BOLD response time signal11. For each task trial, the temporal correlation (TC) r of this ideal time signal with the time signal of every point in the brain yields a full spatial map that characterizes the entire brain’s functional co-activity (FC) relative to the ideal response. A given task should evoke similar FC maps with repeating the task. For any two task trials, regardless of whether they are the same task or not, the spatial correlation (SC) R of their corresponding two FC maps over the whole brain quantifies the similarity between these two maps. For each individual subject, the SC R values of all pairwise FC maps for all task trials measure the variations of these FC maps and therefore quantify the individuality of that subject in performing these tasks.Results
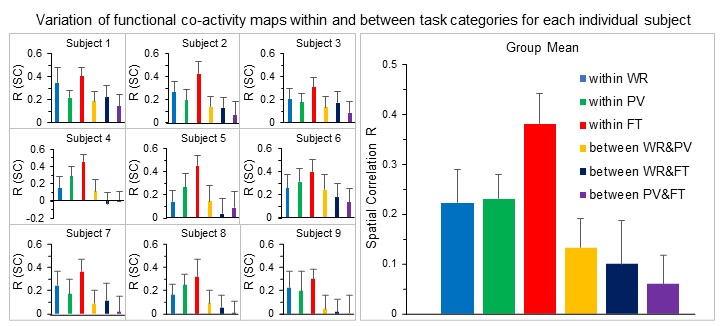
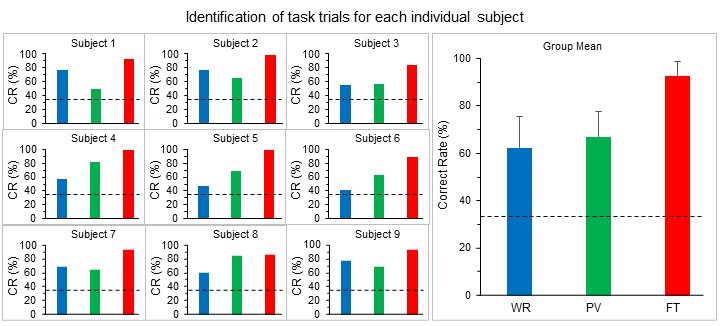
The ideal BOLD response was generated based on the 6-s on 24-s off task paradigm. A mask to cover the whole brain was also generated for each subject. We computed the TC r of the ideal BOLD response with the time signal of every voxel within the brain mask to yield the FC map for each task trial and each subject. Then, for each subject, we computed the SC R for all pairwise FC maps within each task category and all pairwise FC maps between any two task categories. For any paired FC maps, their corresponding SC R value measured the degree of the similarity of the whole brain’s activity in performing these two tasks, i.e., the larger the R value, the greater the similarity of the brain’s activity, offering a means of measuring trial-to-trial variation of the brain’s activity for each individual subject (Fig. 2).Each FC map uniquely characterized the whole brain’s activity when performing a given task trial for that subject, offering a marker to distinguish tasks based on their FC maps. To test this prediction, we chose one FC map from each task category and used these three FC maps as their corresponding task markers to predict the task type of each trial for the remaining 21 trials. For a given test trial, the predicted task type was the one with the largest SC R among the three chosen FC maps. There was a total of 512 combinations in choosing three FC maps from the three task categories and 21 test trials for each choice, resulting in a total of 10752 tests for each individual subject. For all subjects, the correct rate of identifying these task trials ranged from 41.2% to 77.4% for the WR trials, 50.0% to 84.5% for the PV trials and 83.9% to 99.8% for the FT trials, respectively (Fig. 3).
Discussion and Conclusions
The mean SC R within FT category had the largest value among all categories for each individual subject, showing the greatest similarity of the brain’s activity when performing the FT task (Fig. 2). The mean SC R within each of the other two task categories was substantially reduced for every subject, demonstrating that the whole brain’s activity varied substantially from trial-to-trial when performing these tasks. The mean SC R of paired FC maps between two task categories was relatively small in comparison to that within a task category and varied substantially from subject to subject, consistent with the expectation that the difference in the brain’s activity when performing two different tasks should be larger than that when performing the same task repeatedly. The correct rate of identifying task trials was substantially higher than that of random selection (Fig. 3), providing further evidence to demonstrate the robustness and reliability of the presented method in characterizing the individuality of human brains from trial to trial for individual subjects.Acknowledgements
No acknowledgement found.References
1. Ogawa, S., Lee, T. M., Kay, A. R. & Tank, D. W. Brain magnetic resonance imaging with contrast dependent on blood oxygenation. Proc Natl Acad Sci U S A 87, 9868-9872 (1990).
2. Kwong, K. K. et al. Dynamic magnetic resonance imaging of human brain activity during primary sensory stimulation. Proc Natl Acad Sci U S A 89, 5675-5679 (1992).
3. Finn, E. S. et al. Functional connectome fingerprinting: identifying individuals using patterns of brain connectivity. Nat Neurosci 18, 1664-1671, doi:10.1038/nn.4135 (2015).
4. Kong, R. et al. Spatial Topography of Individual-Specific Cortical Networks Predicts Human Cognition, Personality, and Emotion. Cereb Cortex 29, 2533-2551, doi:10.1093/cercor/bhy123 (2019).
5. Salehi, M., Karbasi, A., Barron, D. S., Scheinost, D. & Constable, R. T. Individualized functional networks reconfigure with cognitive state. Neuroimage 206, 116233, doi:10.1016/j.neuroimage.2019.116233 (2020).
6. Michon, K. J., Khammash, D., Simmonite, M., Hamlin, A. M. & Polk, T. A. Person-specific and precision neuroimaging: Current methods and future directions. Neuroimage 263, 119589, doi:10.1016/j.neuroimage.2022.119589 (2022).
7. Huang, J. Human brain functional areas of unitary pooled activity discovered with fMRI. Sci Rep 8, 2388, doi:10.1038/s41598-018-20778-3 (2018).
8. Huang, J. Greater brain activity during the resting state and the control of activation during the performance of tasks. Sci Rep 9, 5027, doi:10.1038/s41598-019-41606-2 (2019).
9. Huang, J. Dynamic activity of human brain task-specific networks. Sci Rep 10, 7851, doi:10.1038/s41598-020-64897-2 (2020).
10. Huang, J. A Holistic Analysis of Individual Brain Activity Revealed the Relationship of Brain Areal Activity with the Entire Brain's Activity. Brain Sci 13, doi:10.3390/brainsci13010006 (2022).
11. Friston, K. et al. Statistical parametric maps in functional imaging: A general linear approach. Hum Brain Mapp 2, 189-210 (1995).
Figures