3267
Quantitative and Qualitative Evaluation of Geometric Distortion Correction in Submillimetre fMRI for Accurate Functional Mapping at 7T1Institute of Neuroscience and Medicine 4, INM-4, Forschungszentrum Juelich, Juelich, Germany, 2Institute of Neuroscience and Medicine 11, INM-11, JARA, Forschungszentrum Juelich, Juelich, Germany, 3JARA - BRAIN - Translational Medicine, Aachen, Germany, 4Department of Neurology, RWTH Aachen University, Aachen, Germany
Synopsis
Keywords: Data Processing, Data Analysis, Geometric Distortion Correction, EPI, fMRI, Functional Mapping Accuracy, Submillimetre resolution, and Ultra-high field
Motivation: Distortion correction in EPI has been utilised in numerous fMRI studies. However, the impact of the distortion correction on submillimetre fMRI analysis remains largely unexplored.
Goal(s): This work performs quantitative and qualitative evaluation of geometric distortion correction with various criteria in submillimetre fMRI at 7T.
Approach: Submillimetre EPI (0.73 × 0.73 mm2) was employed for visual fMRI, and the distortion-corrected data were evaluated in terms of spatial resolution, functional mapping accuracy, and histogram distribution.
Results: This work demonstrates the effectiveness of distortion correction in submillimetre fMRI, revealing substantially enhanced mapping accuracy without significant deterioration in spatial resolution or functional activation distribution.
Impact: The quantitative and qualitative evaluation of EPI distortion correction presented in our work demonstrates the effectiveness of distortion correction in submillimetre fMRI at 7T, revealing substantially enhanced mapping accuracy without a significant deterioration in spatial resolution or functional activation distribution.
Introduction
The relatively high temporal resolution of echo-planar-imaging (EPI) makes it particularly adept at detecting time-dependent haemodynamic responses in the brain, leading to its widespread use in functional MRI (fMRI). Recent advances in MR hardware and imaging techniques allow EPI with a submillimetre voxel size, enabling its use for depicting neuronal activation with high mapping fidelity. However, the acquisition scheme of EPI makes it vulnerable to geometric distortions, which can significantly hinder accurate mapping of neuronal activities in submillimetre fMRI. To address this issue, one widely used method is to correct the geometric distortions using the reversed phase-encoding direction in EPI.1,2 Various software packages (e.g. AFNI, ANTs, COPE, and TOPUP etc.)3-7 have been developed for this purpose, and their use has been demonstrated in numerous previous submillimetre fMRI studies.8-14However, most of these fMRI studies preclude performance evaluation of distortion correction in comparison to uncorrected EPI, which leaves the impact of the distortion correction on submillimetre fMRI largely unexplored. Therefore, this work aims to perform quantitative and qualitative evaluation of geometric distortion correction in submillimetre (0.73 × 0.73 mm2) fMRI at 7T and assesses its effects on the spatial resolution, functional mapping accuracy and distribution of activated voxels.
Methods
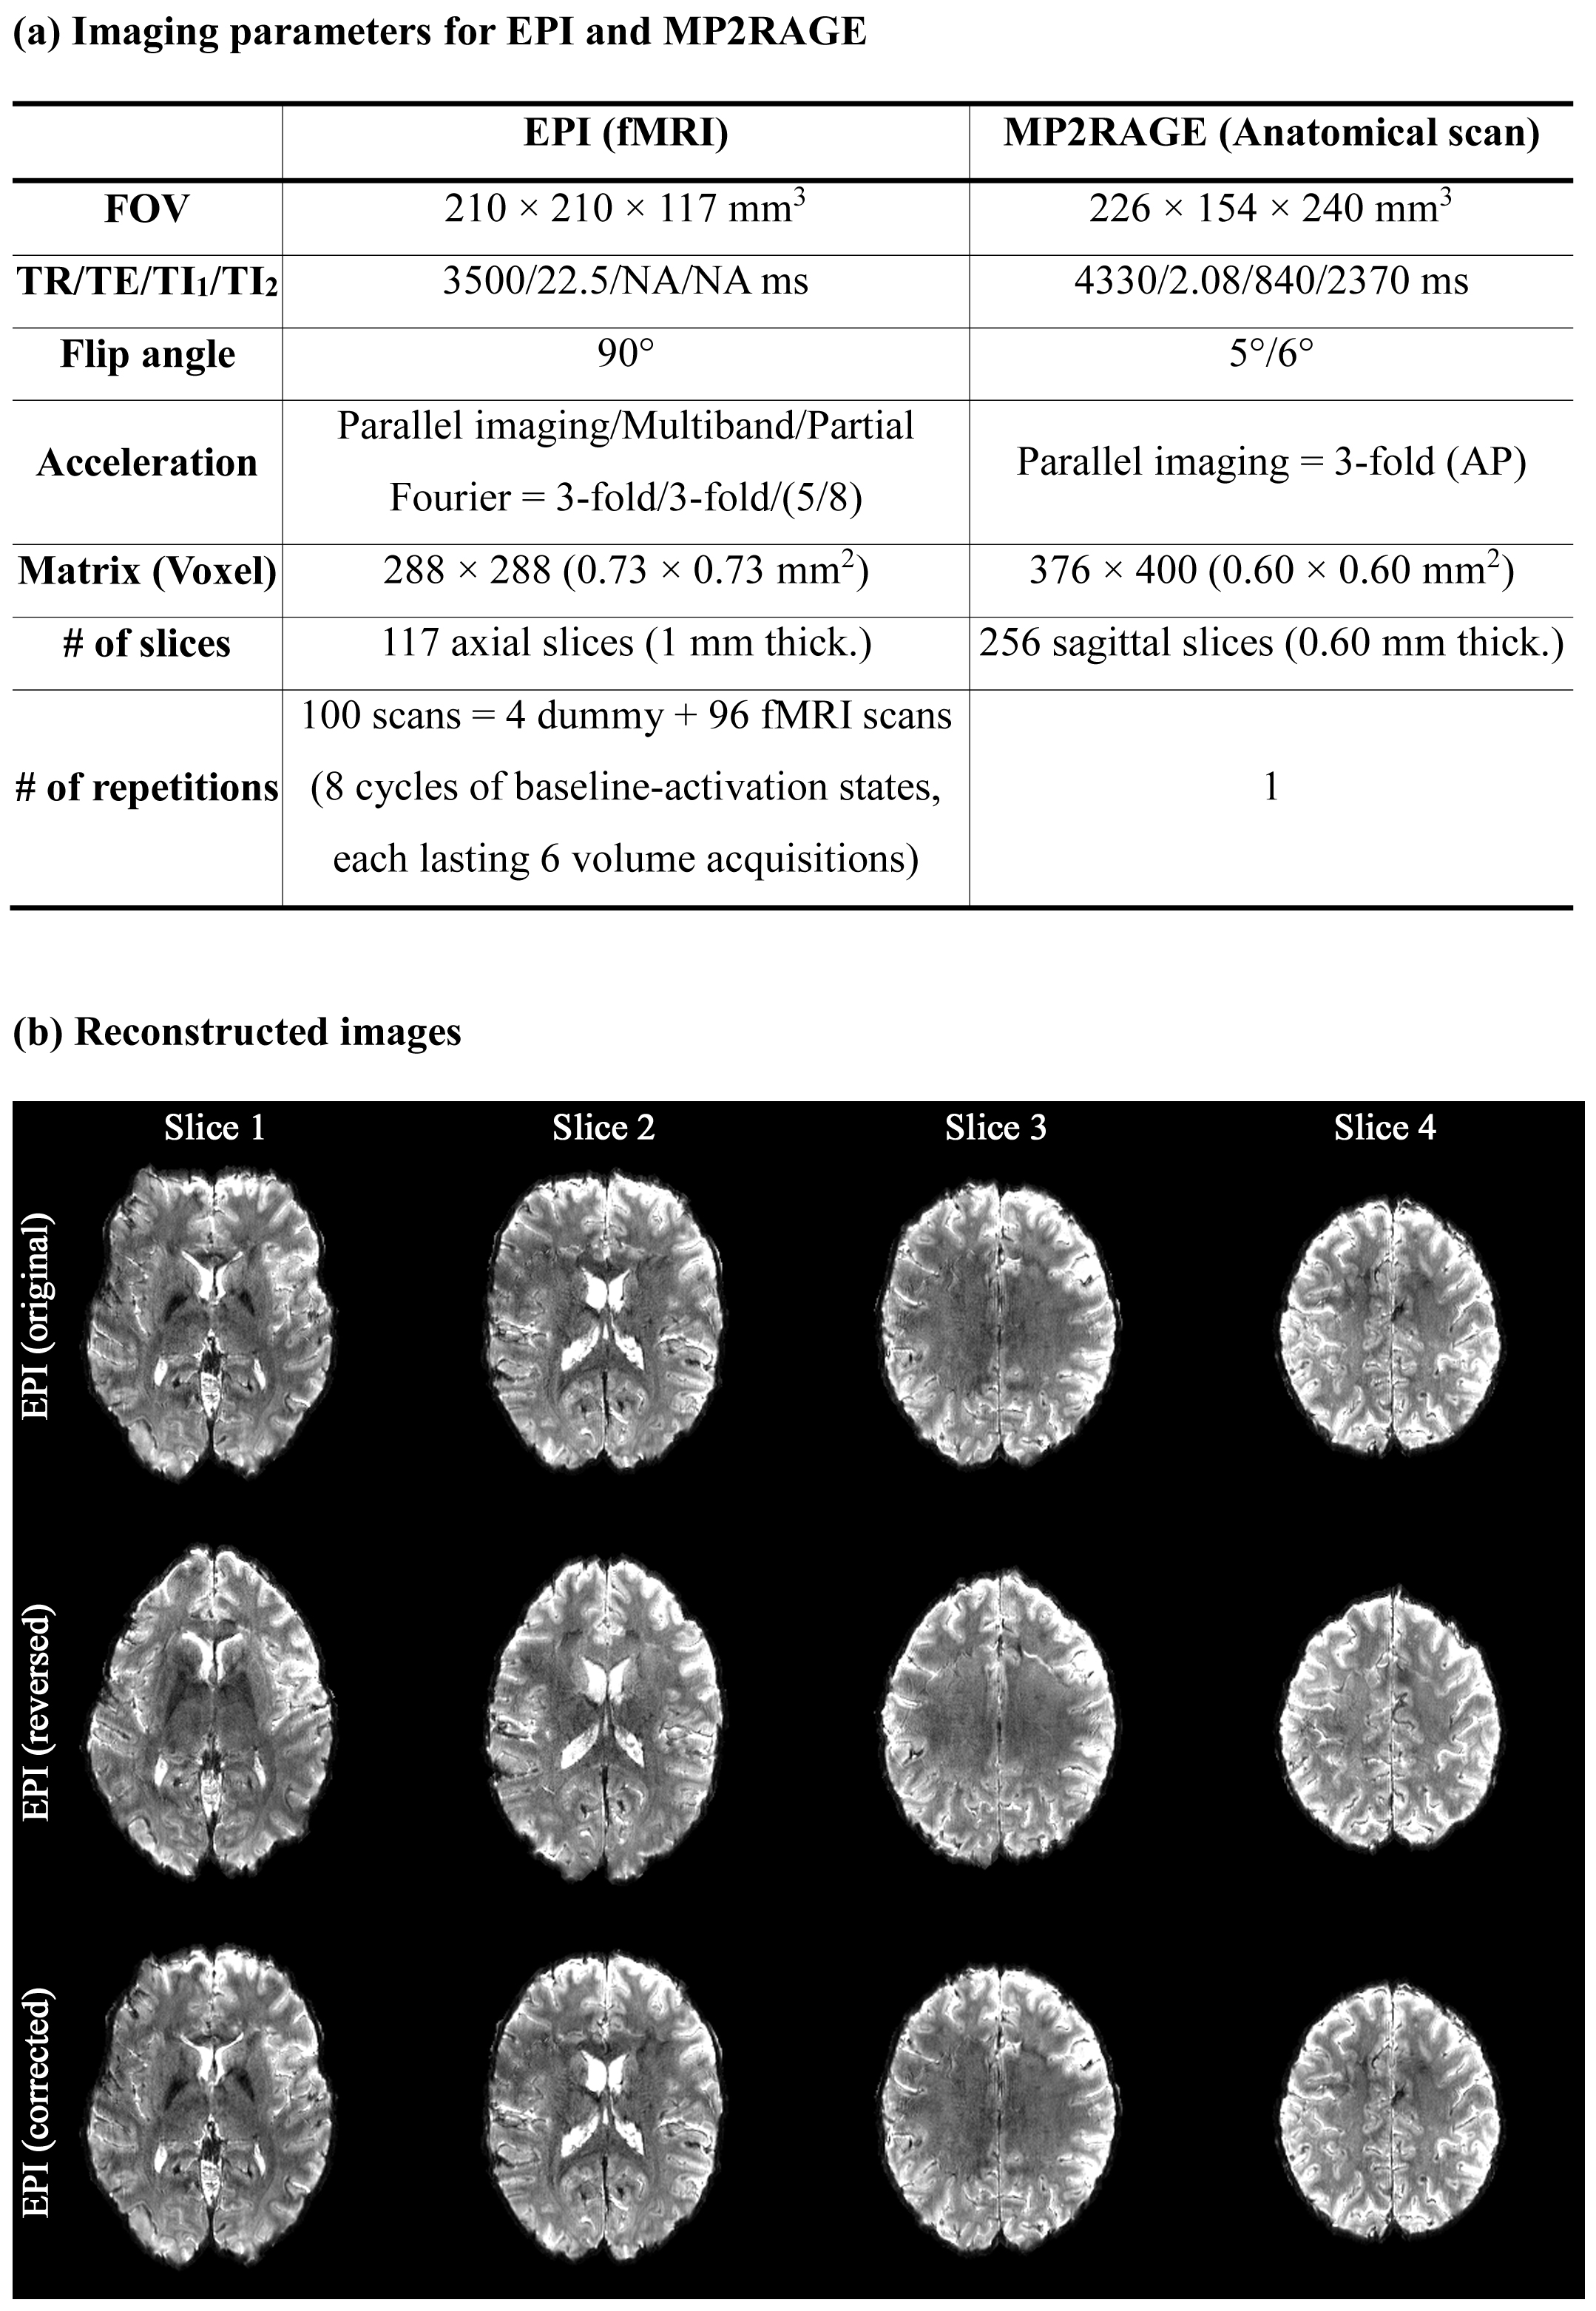
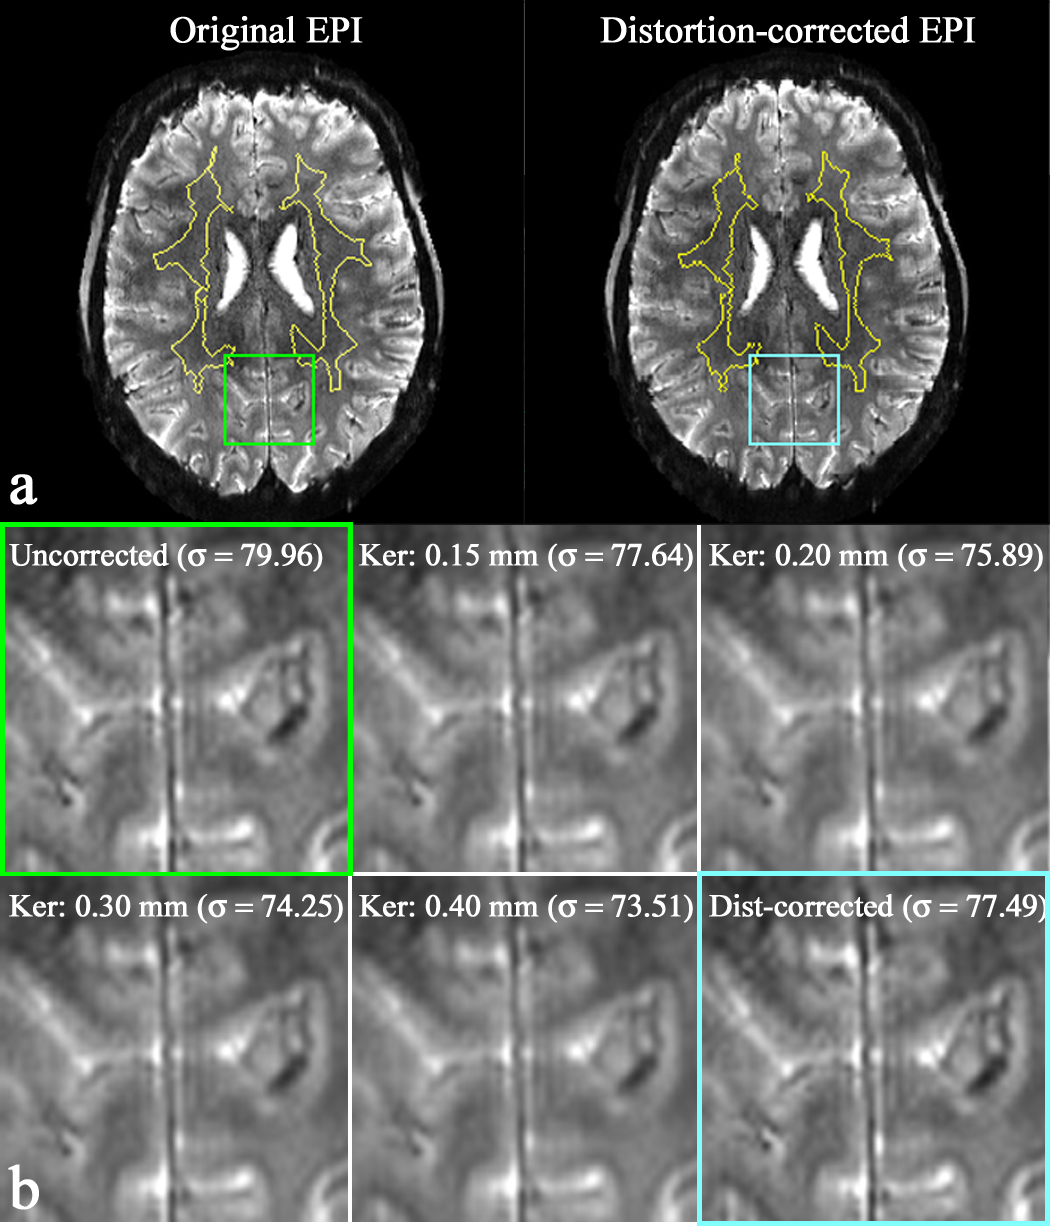
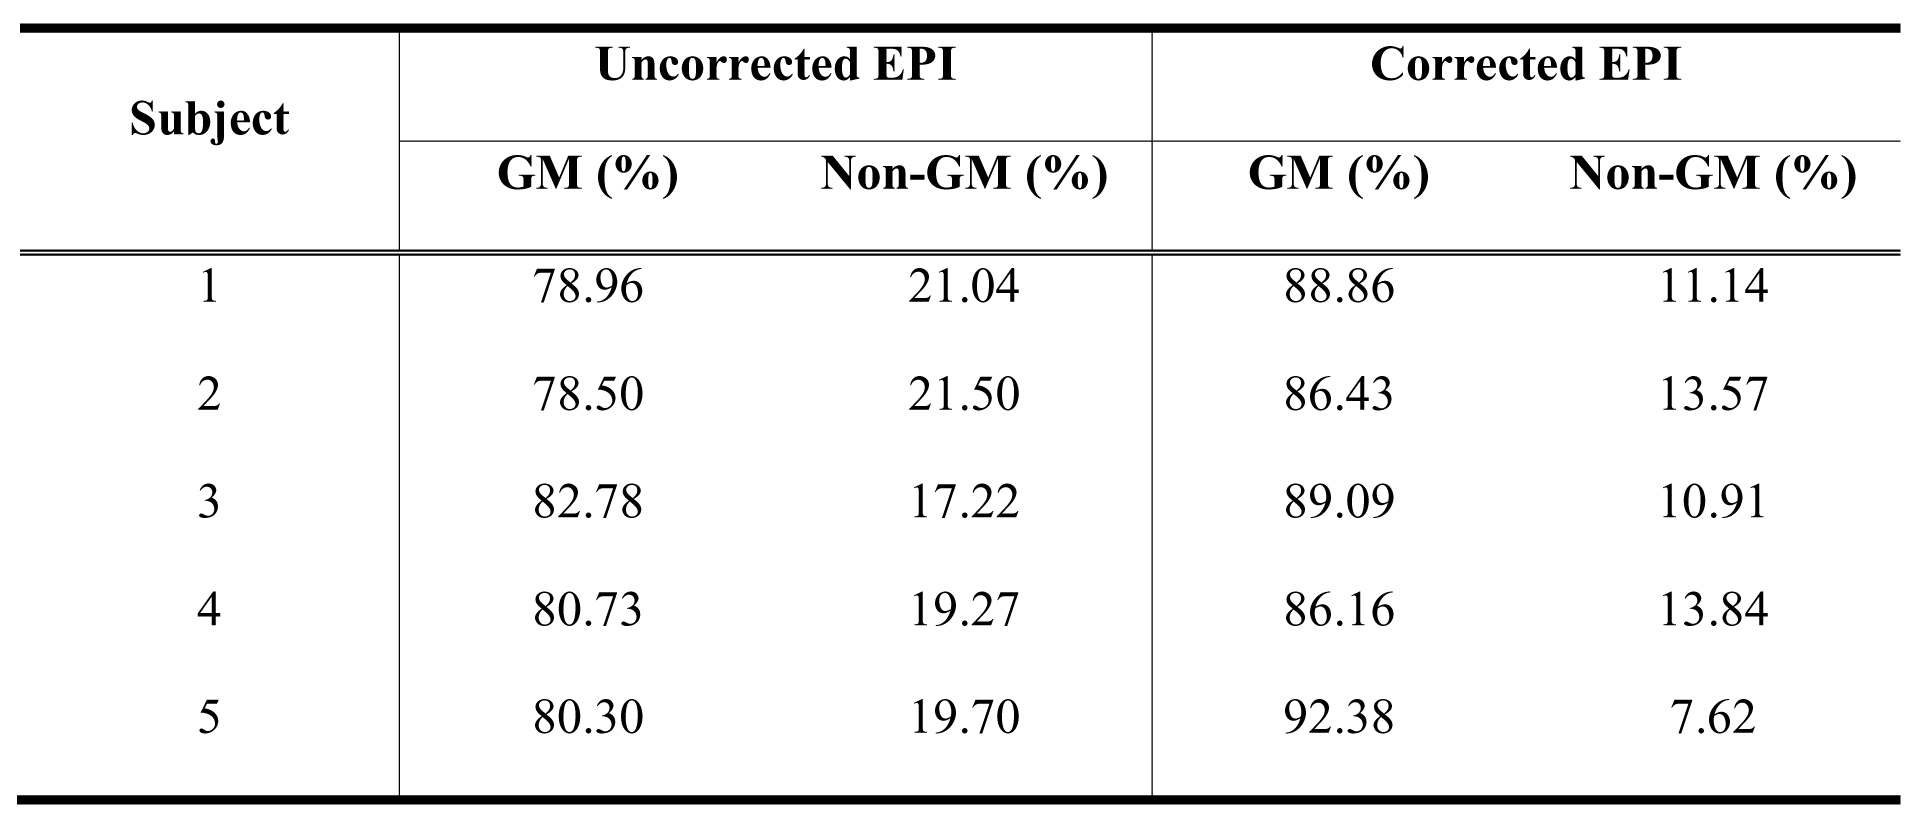
Visual fMRI, designed with a checkerboard paradigm, was performed using a whole-brain, submillimetre EPI protocol; see Fig. 1a for detailed imaging parameters. EPI with the reversed phase-encoding was simultaneously performed in the same fMRI session, as proposed in our previous work.10 Data sets from five healthy volunteers, screened with a standard safety procedure, were acquired on a Siemens Terra 7T scanner with a 1-Tx/32-Rx head coil. The distortion-corrected time-series data were obtained using ANTs4,5, and the fMRI analysis was performed individually for both the original and distortion-corrected data sets using SPM12.15The degree of spatial resolution degradation due to the unwarping process in the distortion correction was quantitatively investigated using an approach similar to that suggested in Renvall et al.16 Here, an original EPI image was spatially smoothed using a range of Gaussian kernel widths (i.e. 0.15, 0.2, 0.3 and 0.4 mm), and the standard deviation (STD) of the selected region-of-interest (ROI) in the white matter (WM) was computed for each case and then compared to that of the corrected EPI results. Furthermore, the accuracy of functional mapping was evaluated by calculating the ratio of activated voxels located in the grey matter (GM). Lastly, the potential impact of the distortion correction on functional activation was assessed using histogram analysis.
Results
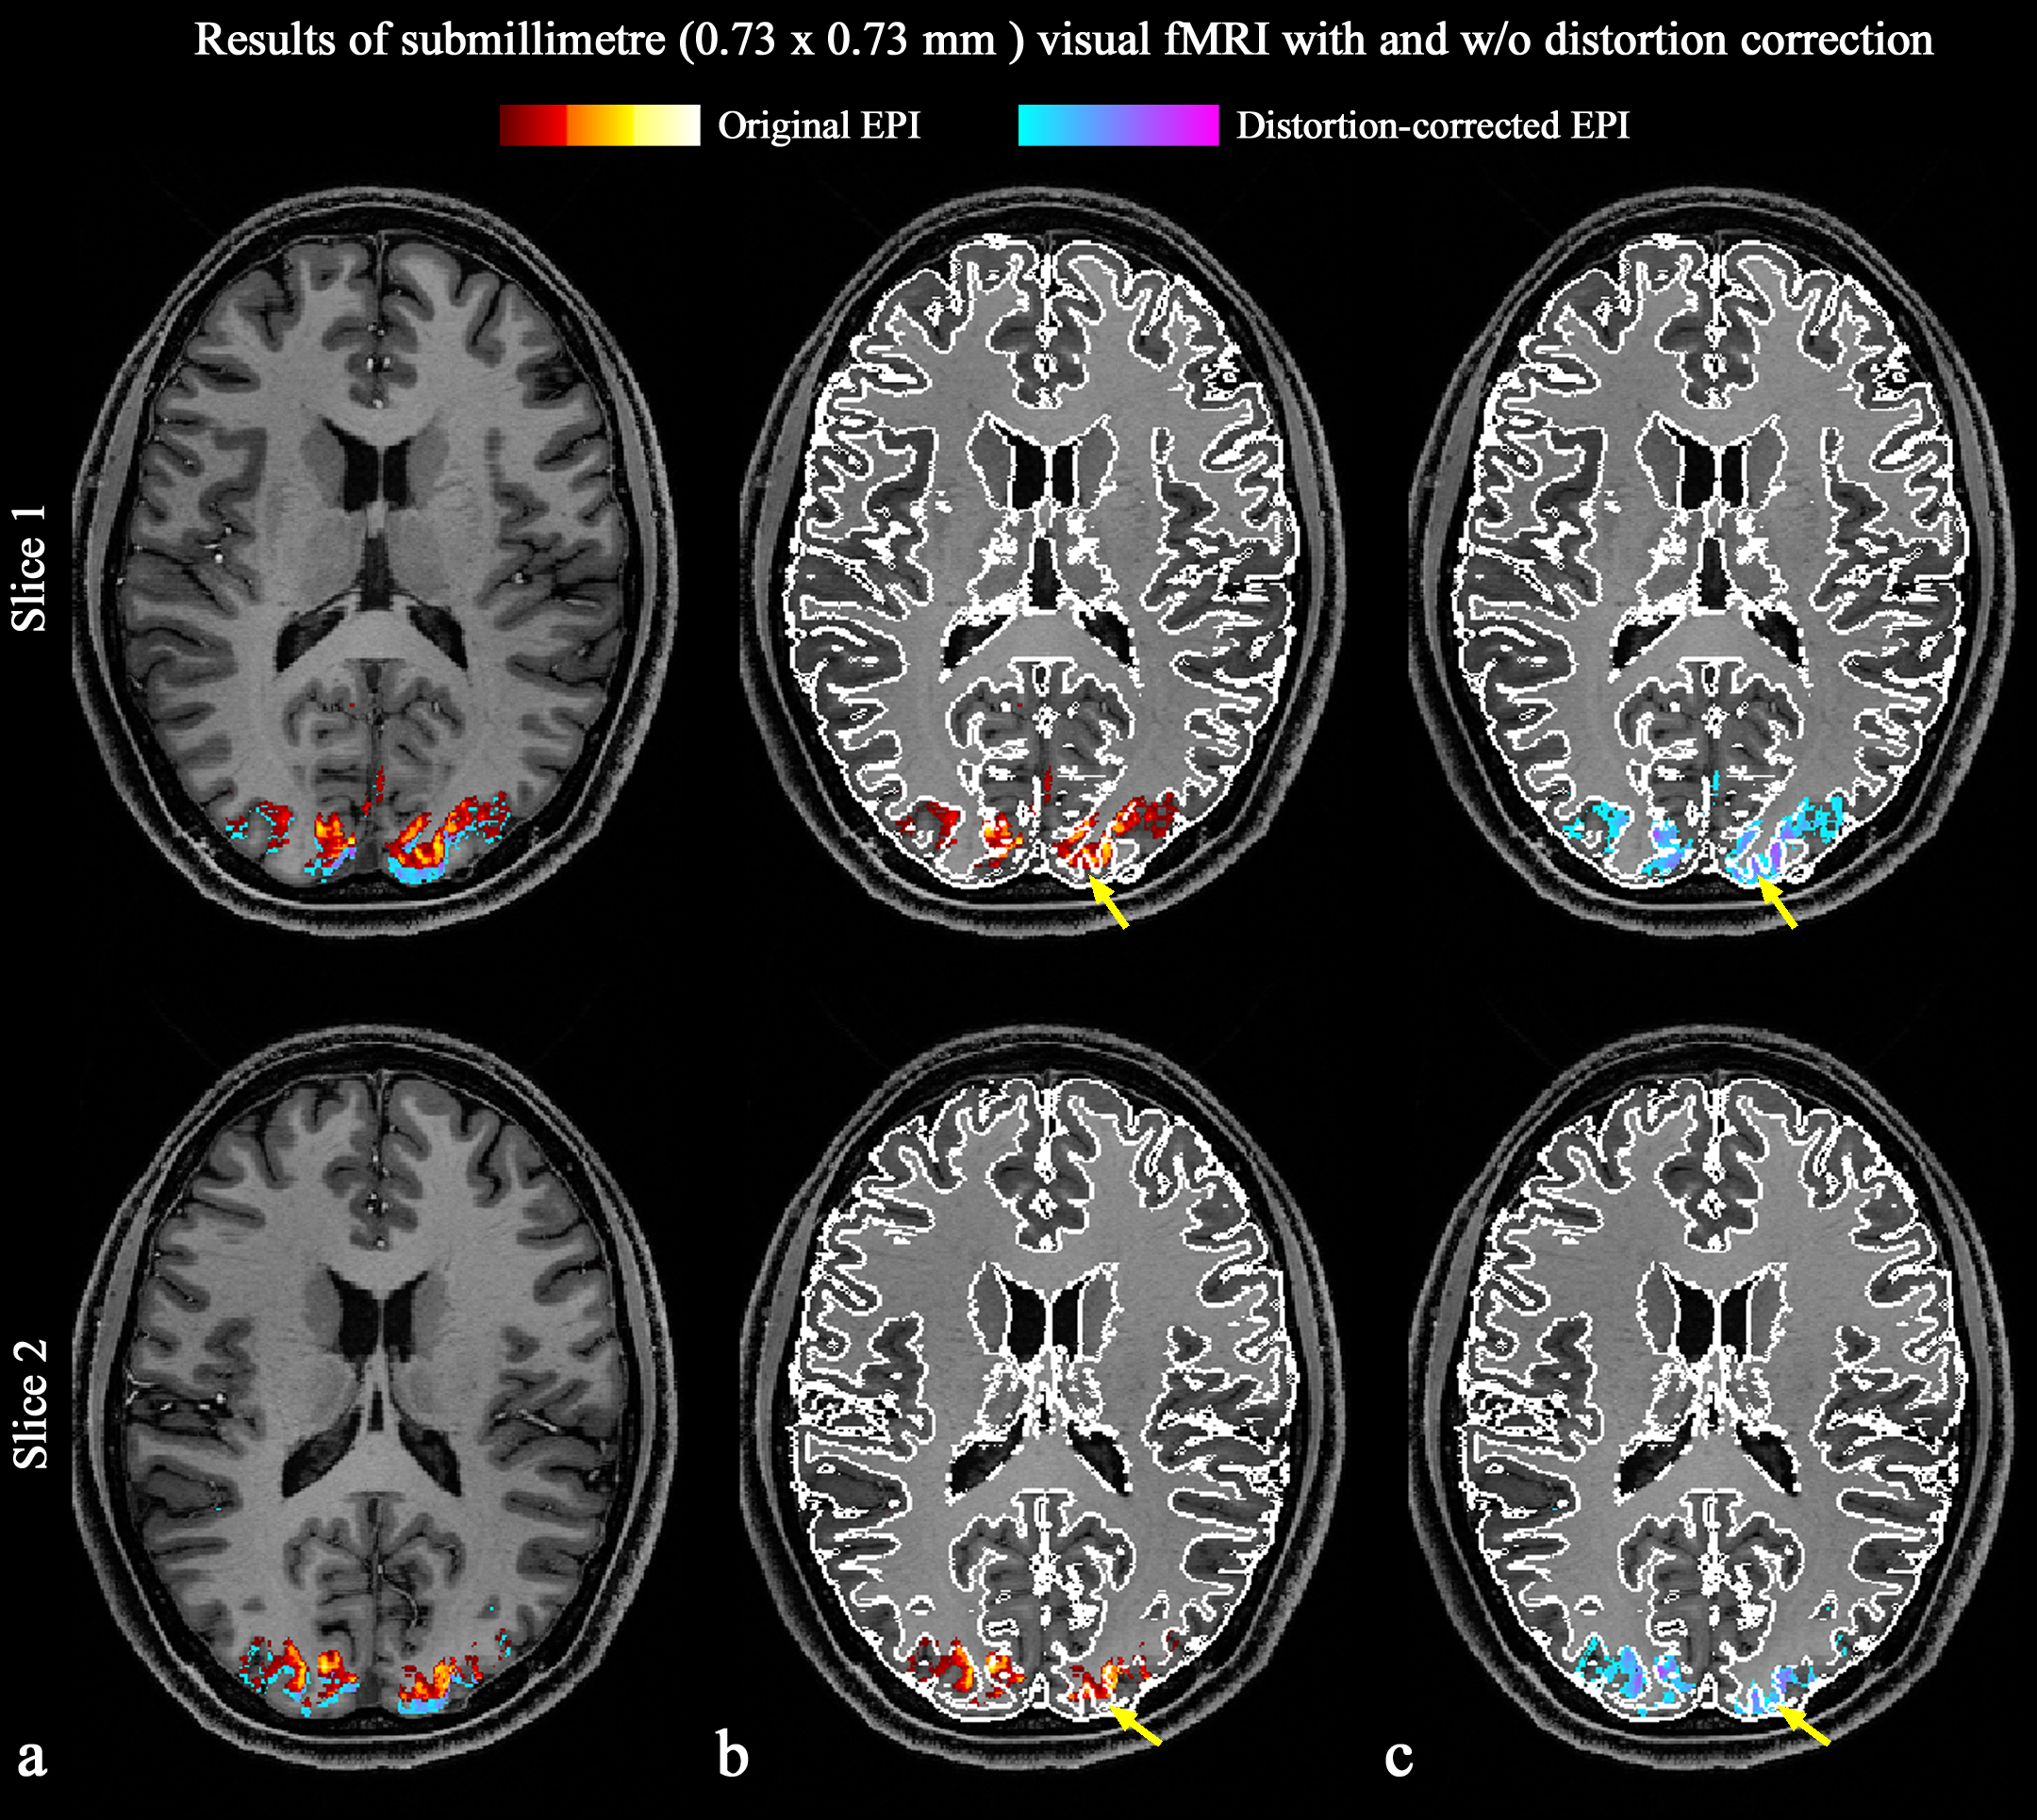
Figure 1b displays reconstructed original phase encoding, reversed phase encoding, and distortion-corrected EPI images at four representative slice locations. The distortion-corrected images depict no significant visible loss of the spatial resolution, which was also confirmed through the quantitative assessments of spatial resolution (see Fig. 2). Here, the STD of the selected yellow ROI in WM (ρ) was observed to decrease as the smoothing kernel width increased from 0.15 to 0.4 mm. Consequently, the degradation of spatial resolution can be visually verified in the enlarged representations of the rectangular ROIs. The STD of the distortion-corrected EPI was nearly identical to the original image smoothed with a kernel width of 0.15 mm, indicating that the loss of spatial resolution induced by the distortion correction was minimal.Figure 3 shows functional results obtained from the original and distortion-corrected fMRI data sets, each of which is overlaid on the respectively co-registered MP2RAGE scan. It is clear that the activated voxels from the distortion-corrected case are more accurately localised within the cortical ribbon. This was quantitatively verified with the ratio of activated voxels in GM. As shown in Fig. 4, the GM ratio substantially increased for all five subjects (i.e. on average, an 8.33% increase) as a consequence of the distortion correction.
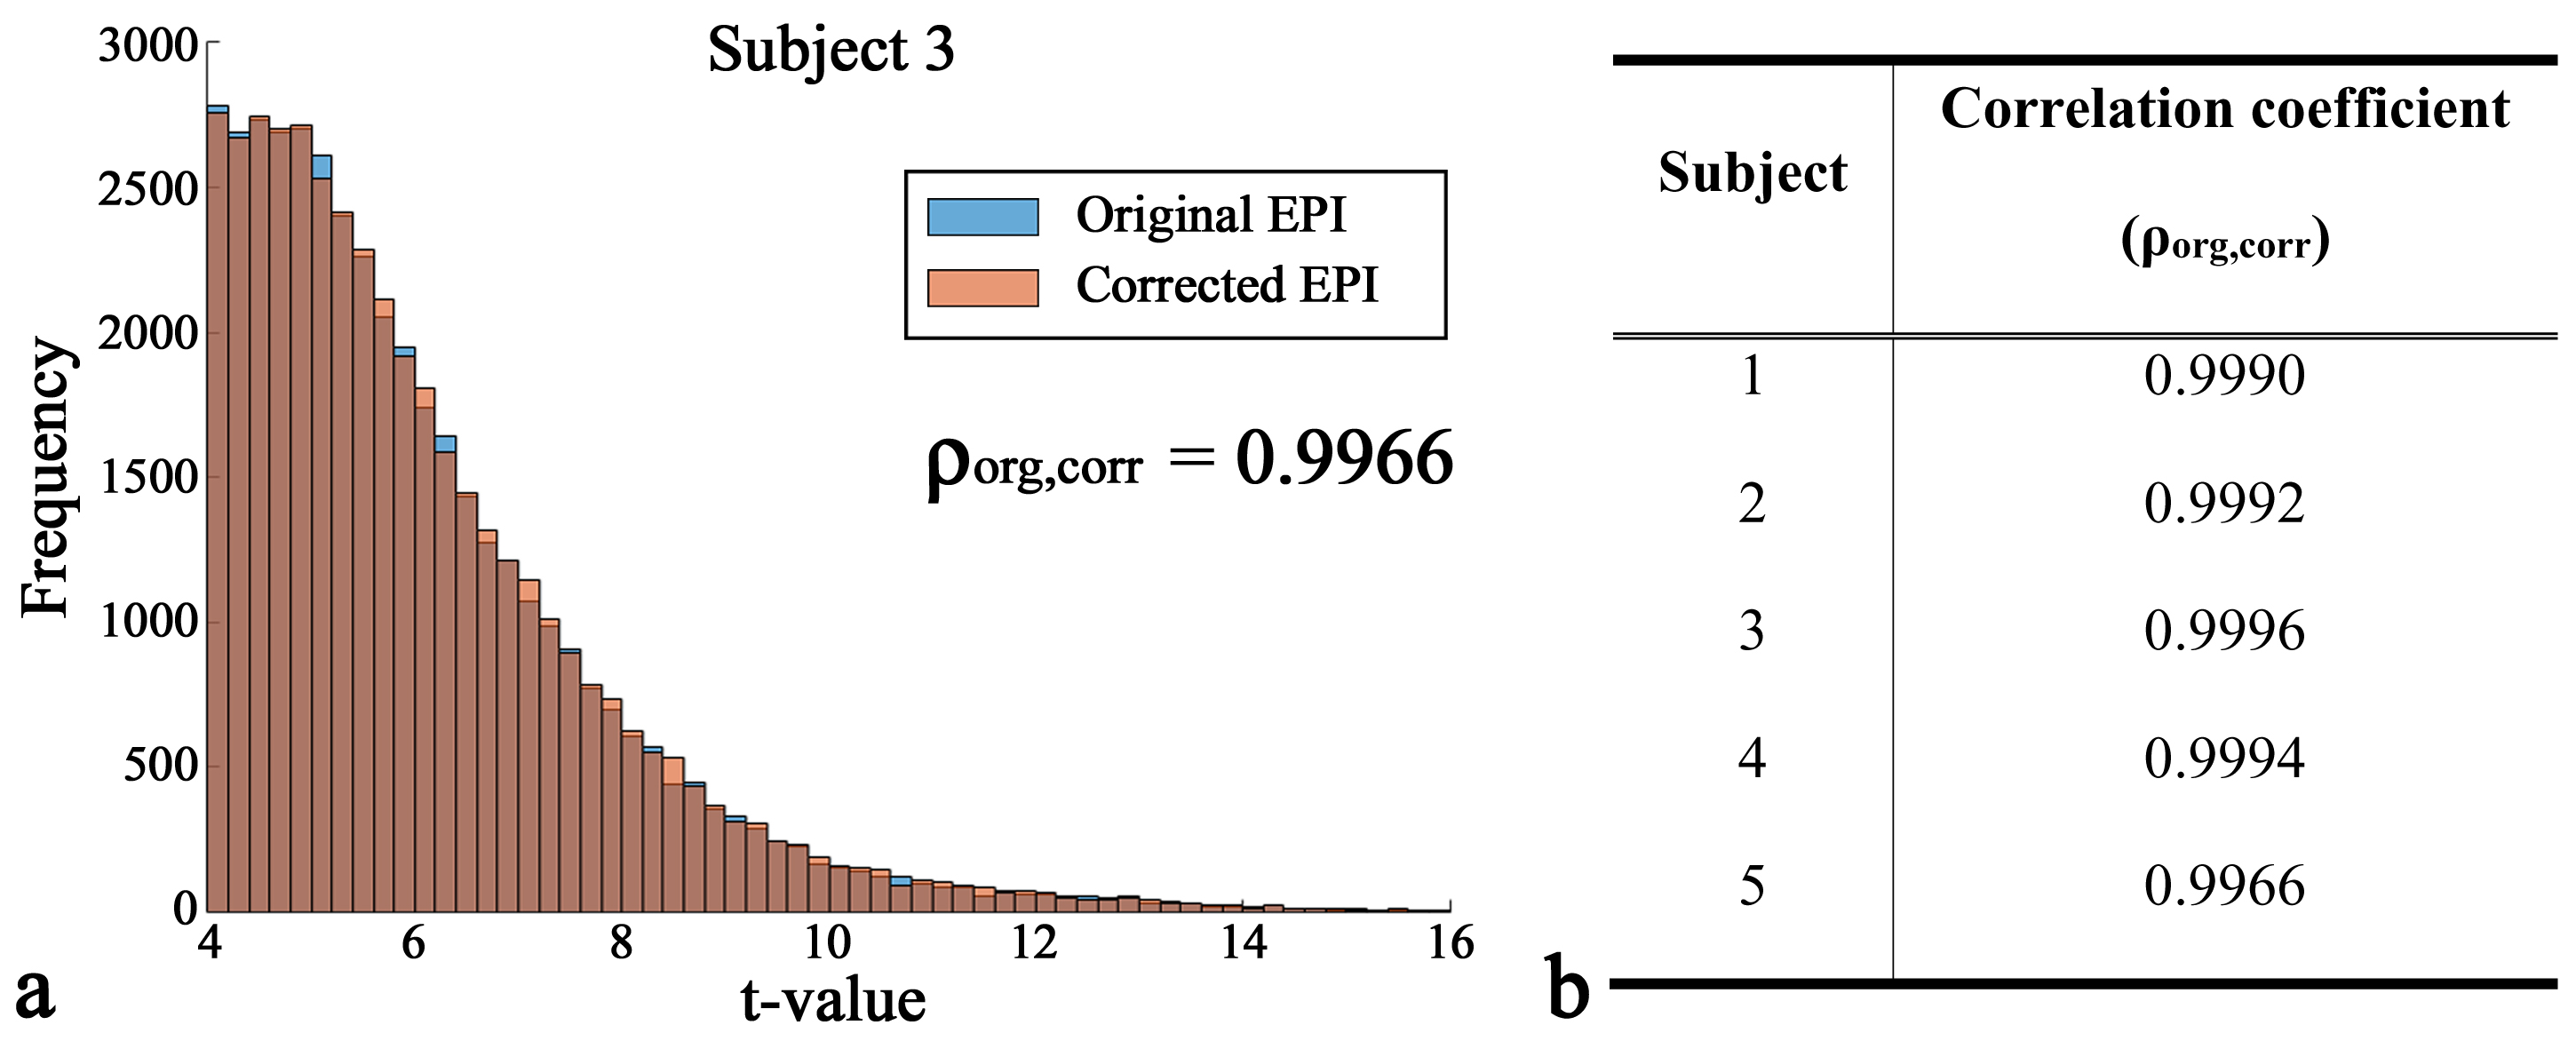
Figure 5a shows the histogram distribution of t-values obtained from the original and distortion-corrected results for a representative subject, which exhibit very similar features. The computed correlation coefficient (0.9996) between the two histograms indicates a high degree of similarity, a pattern consistently observed in the results from other subjects (Fig. 5b). This suggests distortion correction has no significant effect on the distribution of functional activation.
Discussion and conclusions
This work performs quantitative and qualitative evaluation of distortion correction in submillimetre fMRI at 7T and demonstrates improved mapping accuracy without significant degradation of spatial resolution or alternation of the functional activation distribution. The presented results provide direct insight into the effectiveness of distortion correction for submillimetre fMRI using the ANTs method. However, the performance of other distortion-correction software will be assessed in future work to determine the most optimal method.Acknowledgements
No acknowledgement found.References
- Chang H, Fitzpatrick JM. A technique for accurate magnetic resonance imaging in the presence of field inhomogeneities. IEEE Trans Med Imaging. 1992;11(3):319-29. doi: 10.1109/42.158935.
- Morgan PS, Bowtell RW, McIntyre DJ, Worthington BS. Correction of spatial distortion in EPI due to inhomogeneous static magnetic fields using the reversed gradient method. J Magn Reson Imaging. 2004 Apr;19(4):499-507.
- https://afni.nimh.nih.gov/
- Avants BB, Tustison NJ, Song G, Cook PA, Klein A, Gee JC. A reproducible evaluation of ANTs similarity metric performance in brain image registration. Neuroimage. 2011 Feb 1;54(3):2033-44. doi: 10.1016/j.neuroimage.2010.09.025. Epub 2010 Sep 17.
- https://github.com/ANTsX/ANTs
- https://support.brainvoyager.com/documents/Available_Tools/Available_Plugins/Cope/CopePluginHelp/index.html
- Andersson JL, Skare S, Ashburner J. How to correct susceptibility distortions in spin-echo echo-planar images: application to diffusion tensor imaging. Neuroimage. 2003 Oct;20(2):870-88.
- Jia K, Zamboni E, Rua C, Goncalves NR, Kemper V, Ng AKT, Rodgers CT, Williams G, Goebel R, Kourtzi Z. A protocol for ultra-high field laminar fMRI in the human brain. STAR Protoc. 2021 Mar 26;2(2):100415. doi: 10.1016/j.xpro.2021.100415.
- Kashyap S, Ivanov D, Havlicek M, Huber L, Poser BA, Uludağ K. Sub-millimetre resolution laminar fMRI using Arterial Spin Labelling in humans at 7 T. PLoS One. 2021 Apr 26;16(4):e0250504. doi: 10.1371/journal.pone.0250504.
- Yun SD, Erhan G, Shah NJ. A simultaneous measurement of opposite-phase-encoding EPI in a single fMRI session for the reduction of acquisition time and SAR at 7T. Proceedings of the 32nd Annual Meeting of ISMRM. International Society for Magnetic Resonance in Medicine, Toronto; 2023. (abstract 1161).
- Jia K, Zamboni E, Kemper V, Rua C, Goncalves NR, Ng AKT, Rodgers CT, Williams G, Goebel R, Kourtzi Z. Recurrent Processing Drives Perceptual Plasticity. Curr Biol. 2020 Nov 2;30(21):4177-4187.e4. doi: 10.1016/j.cub.2020.08.016.
- Kashyap S, Ivanov D, Havlicek M, Poser BA, Uludağ K. Impact of acquisition and analysis strategies on cortical depth-dependent fMRI. Neuroimage. 2018 Mar;168:332-344. doi: 10.1016/j.neuroimage.2017.05.022.
- Huang P, Correia MM, Rua C, Rodgers CT, Henson RN, Carlin JD. Correcting for superficial bias in 7T gradient echo fMRI. Front Neurosci 2021; 15:715549.
- Marquardt I, Schneider M, Gulban OF, Ivanov D, Uludağ K. Cortical depth profiles of luminance contrast responses in human V1 and V2 using 7 T fMRI. Hum Brain Mapp 2018; 39(7): 2812-2827.
- https://www.fil.ion.ucl.ac.uk/spm/software/spm12/
- Renvall V, Witzel T, Wald LL, Polimeni JR. Automatic cortical surface reconstruction of high-resolution T1 echo planar imaging data. Neuroimage. 2016 Jul 1;134:338-354.
Figures