3261
Blood-to-CSF Water Exchange Time Estimation Using a multi-PLD, multi-TE 3D RARE Stack-of-Spirals ASL Sequence1Department of Diagnostic Radiology and Nuclear Medicine, University of Maryland, Baltimore, Baltimore, MD, United States, 2Diagnostic Radiology and Nuclear Medicine, University of Maryland, Baltimore, Baltimore, MD, United States, 3Siemens Healthineers, Philadelphia, PA, United States, 4Department of Radiology, Leiden University Medical Center, Leiden, Netherlands, 5Leiden Institute for Brain and Cognition(LIBC), Leiden, Netherlands, 6C.J. Gorter MRI Center, Department of Radiology, Leiden University Medical Center, Leiden, Netherlands, 7Siemens Healthineers, Madrid, Spain, 8Department of Radiology, línica Universidad de Navarra, Pamplona, Spain, 9Idisna, Instituto de Investigación Sanitaria de Navarra, Spain, Spain, 10Perelman School of Medicine, University of Pennsylvania, Philadelphia, PA, United States, 11Department of Neurology, University of Pennsylvania, Philadelphia, PA, United States
Synopsis
Keywords: Pulse Sequence Design, Arterial spin labelling, multiple-TE ASL
Motivation: To assess the blood-CSF barrier on a Siemens platform using a multi-TE 3D RARE stack-of-spirals ASL sequence.
Goal(s): To obtain high-quality fitted blood-to-csf time images.
Approach: A 3D RARE pCASL sequence with multiple-TE acquisitions was used to collect ASL images. To cope with the low SNR issue in blood-CSF barrier ASL imaging, a denoising technique of locally adaptive low rank regularization with collaborative data selection was applied to images.
Results: The fitted blood-to-csf time images generated from denoised control and label images showed significantly improved image quality. The Bland-Altman Plot shows a good agreement between the test and retest scans using the sequence.
Impact: Blood-CSF barrier ASL implemented in the Siemens platform showed good test-retest reliability with the help of advanced denoising. The denoising technique can be used for ASL applications to provide high-quality images.
Introduction
Cerebrospinal fluid (CSF) is a key component in the brain waste clearance system. CSF is mainly produced through the blood-CSF barrier (BCSFB). A promising non-invasive method for mapping BCSFB function is the ultra-long post-labeling-delay (PLD) and echo-time (TE) based arterial spin labeling (ASL) perfusion MRI (BCSFB-ASL) (1). This study aims to assess the feasibility of BCSFB-ASL implemented on a Siemens platform using a 3D RARE background suppressed (BS) stack-of-spirals readout pCASL sequence (2,3). To cope with the ultra-low SNR issue in BCSFB-ASL, we also aimed to evaluate the effects of denoising using an extension of a novel method (4).Materials and Methods
Four healthy volunteers (4 males, age 32.2 ± 3.0 years) provided written informed consent, and the study was approved by the local IRB. MRI examinations were conducted at 3 T (MAGNETOM Prisma, Siemens Healthineers, Erlangen, Germany). Each volunteer underwent two separate MRI sessions two weeks apart. T1-weighted images were acquired at each session for coregistration. The 3D RARE pCASL sequence (2,3) was modified to allow multiple-TE acquisitions. Figure 1 shows the sequence diagram. Acquisition parameters include labeling duration=2s, TR/TE = 7000/7.7 ms, 3.8 mm isotropic resolution, FOV = 240 × 240 mm², 5/8 slice partial Fourier, 36 partitions, 4-shot spiral readout with R=2 slice acceleration. Twenty ASL pairs were acquired and included 7 TEs (7.7 + n*215.6 ms, n=0:6). A single echo time was used for the M0 scan. The multiple-TE ASL acquisitions were repeated three times at a PLD of 2, 2.5, and 3 seconds. Background suppression was achieved using four presaturation pulses and three FOCI pulses. The total scan time for each session was 35 minutes and 20 seconds.We applied denoising to the images, using locally adaptive low rank regularization with collaborative data selection inspired by recent denoising technologies (4,5). The multi-PLD and multi-TE perfusion difference and M0 images were input to the extended kinetic model described in Ref. (1). Fitting outputs include CBF, arterial transit time, and blood-to-CSF exchange time (Tb2csf). These images were subsequently registered into the MNI brain space using the transform estimated by FSL from the T1-weighted image for each subject . The spatially registered images were averaged across subjects for each session. Test-retest reliability of the CBF and Tb2csf measurement was assessed using the Bland-Altman plot.Results
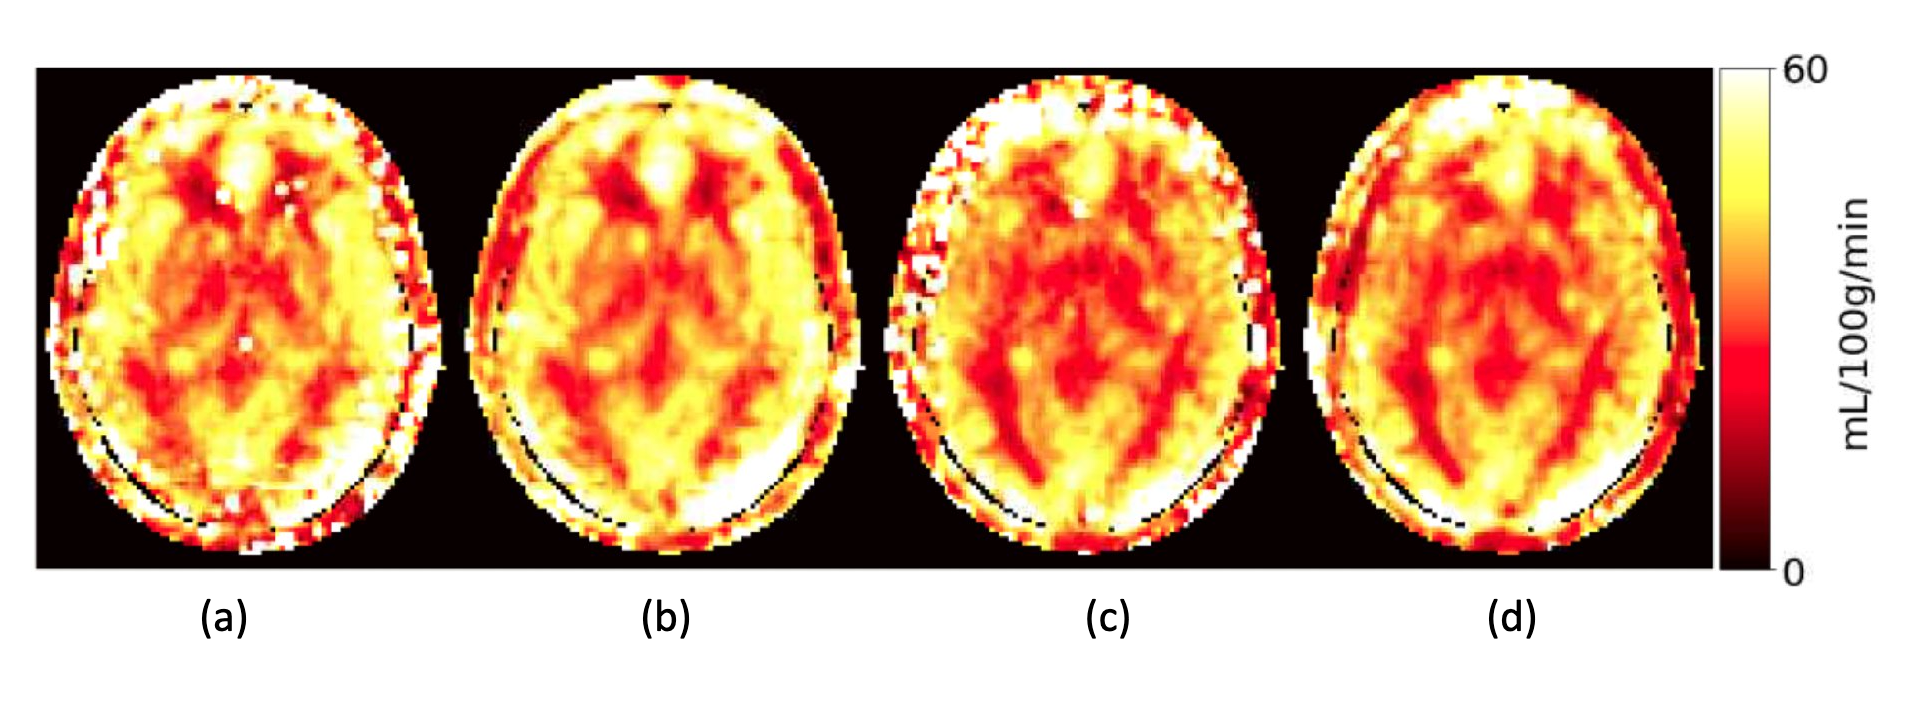
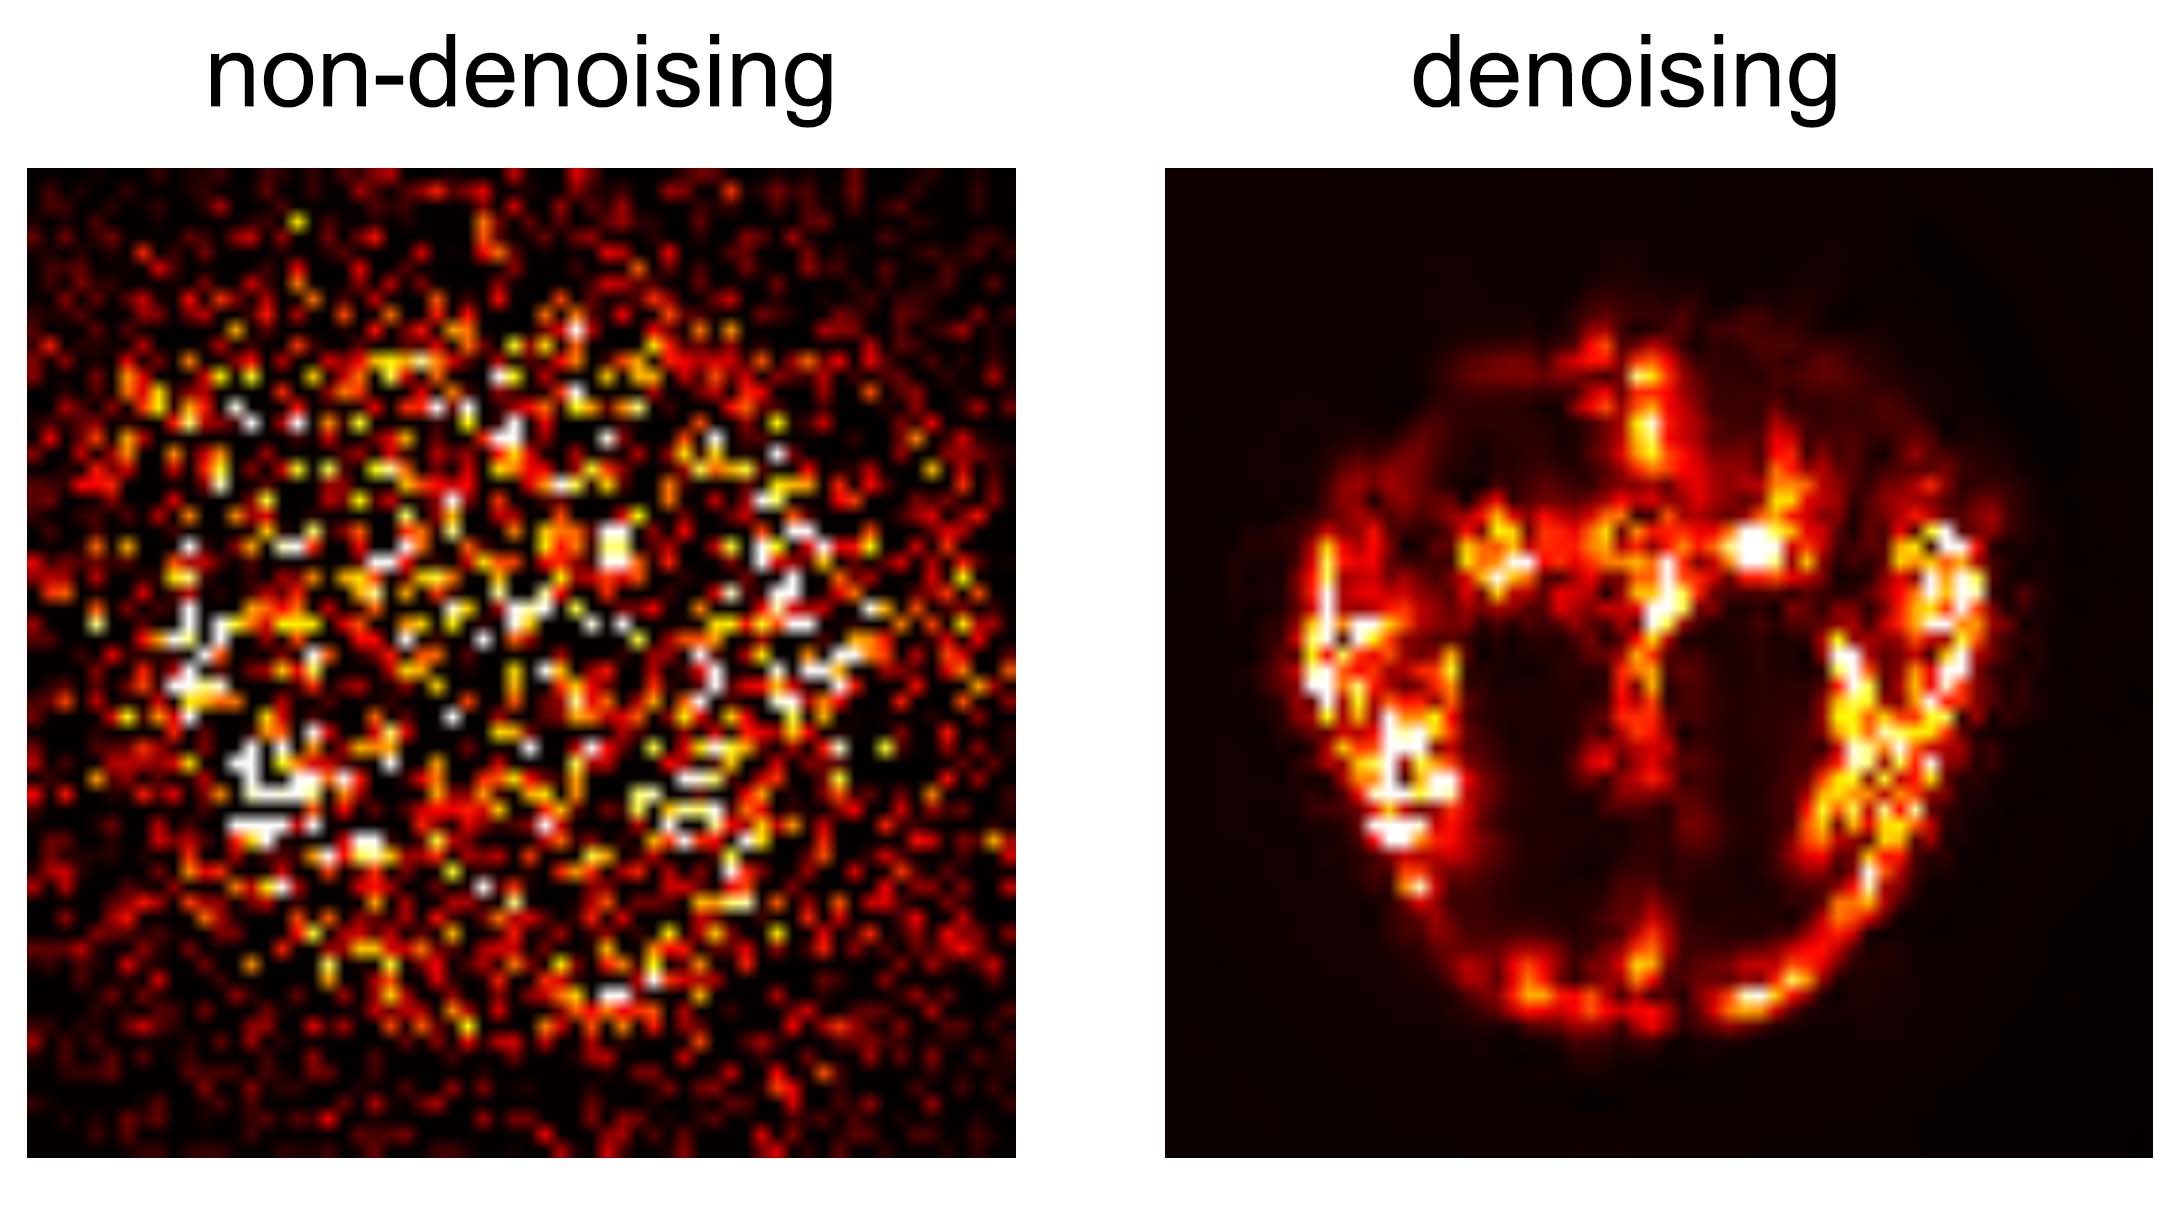
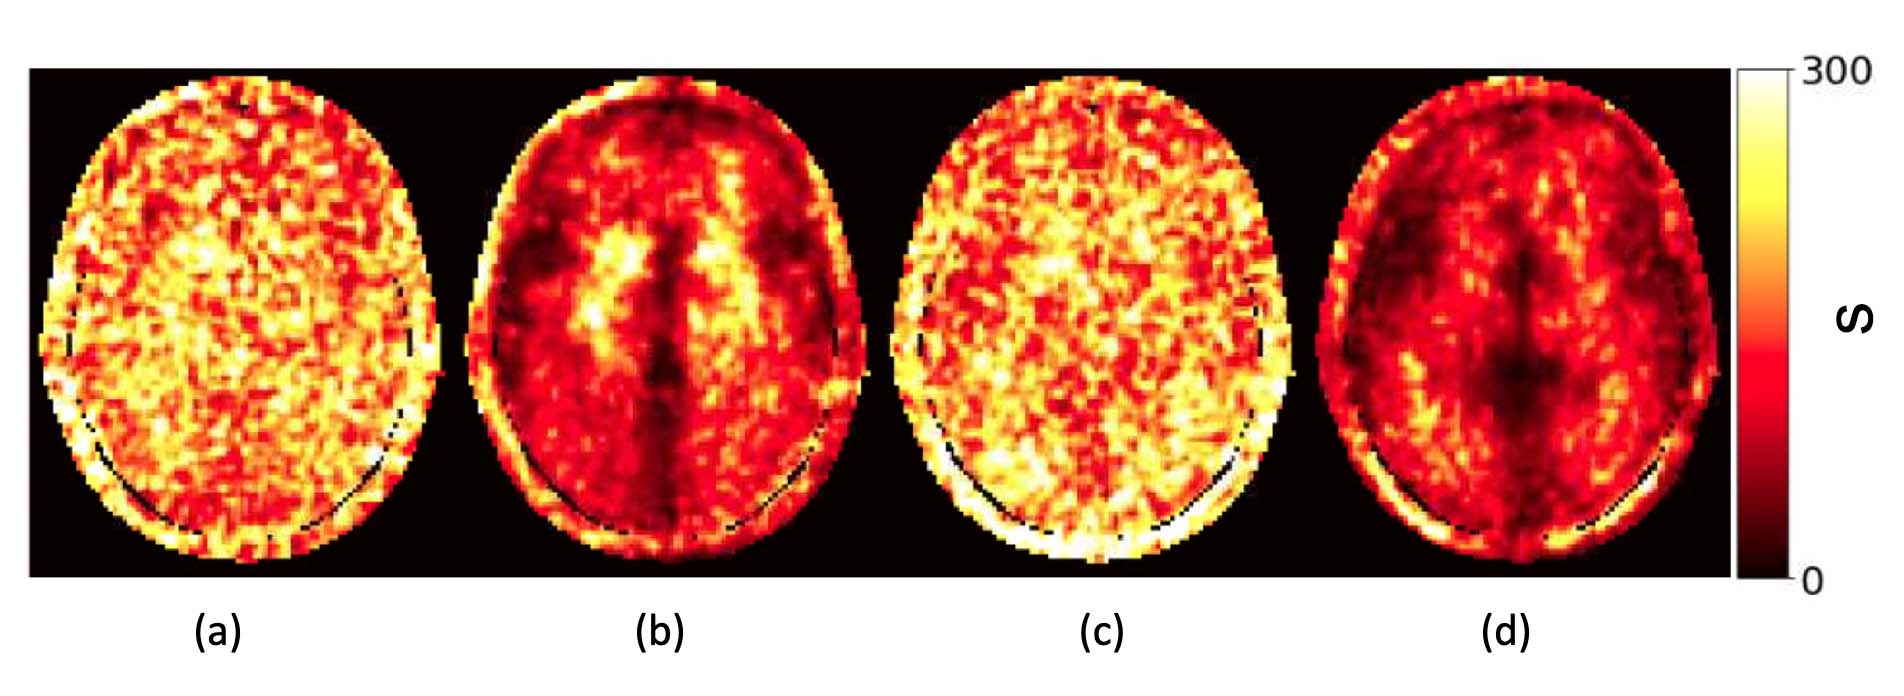
Figure 2 displays the average CBF maps. Both sessions showed similar image contrast. Denoising did not show obvious improvement except for outliers in lateral ventricle in the first session, as illustrated in Fig. 2(a). The representative perfusion images acquired at TE5 (870.1 ms) are displayed in Fig. 3. The non-denoised image (Fig. 3 left) exhibited a noise-like pattern, rendering brain structures indistinct. In contrast, the denoised image (Fig. 3 right) clearly showed the underlying tissue structure, which suggested the denoising markedly improved the perfusion image quality.Figure 4 shows the mean Tb2csf maps. Denoising clearly reduced noise in the fitted Tb2csf image. The Tb2csf value after denoising was similar to that reported in Ref. (1). Similar contrast patterns were observed in both non-denoised and denoised Tb2csf maps in insula, middle temporal cortex, and prefrontal cortex. Cortical and subcortical areas near the ventricles and subarachnoid space showed relatively lower Tb2csf, indicating a relatively faster blood-to-CSF water exchange therein.
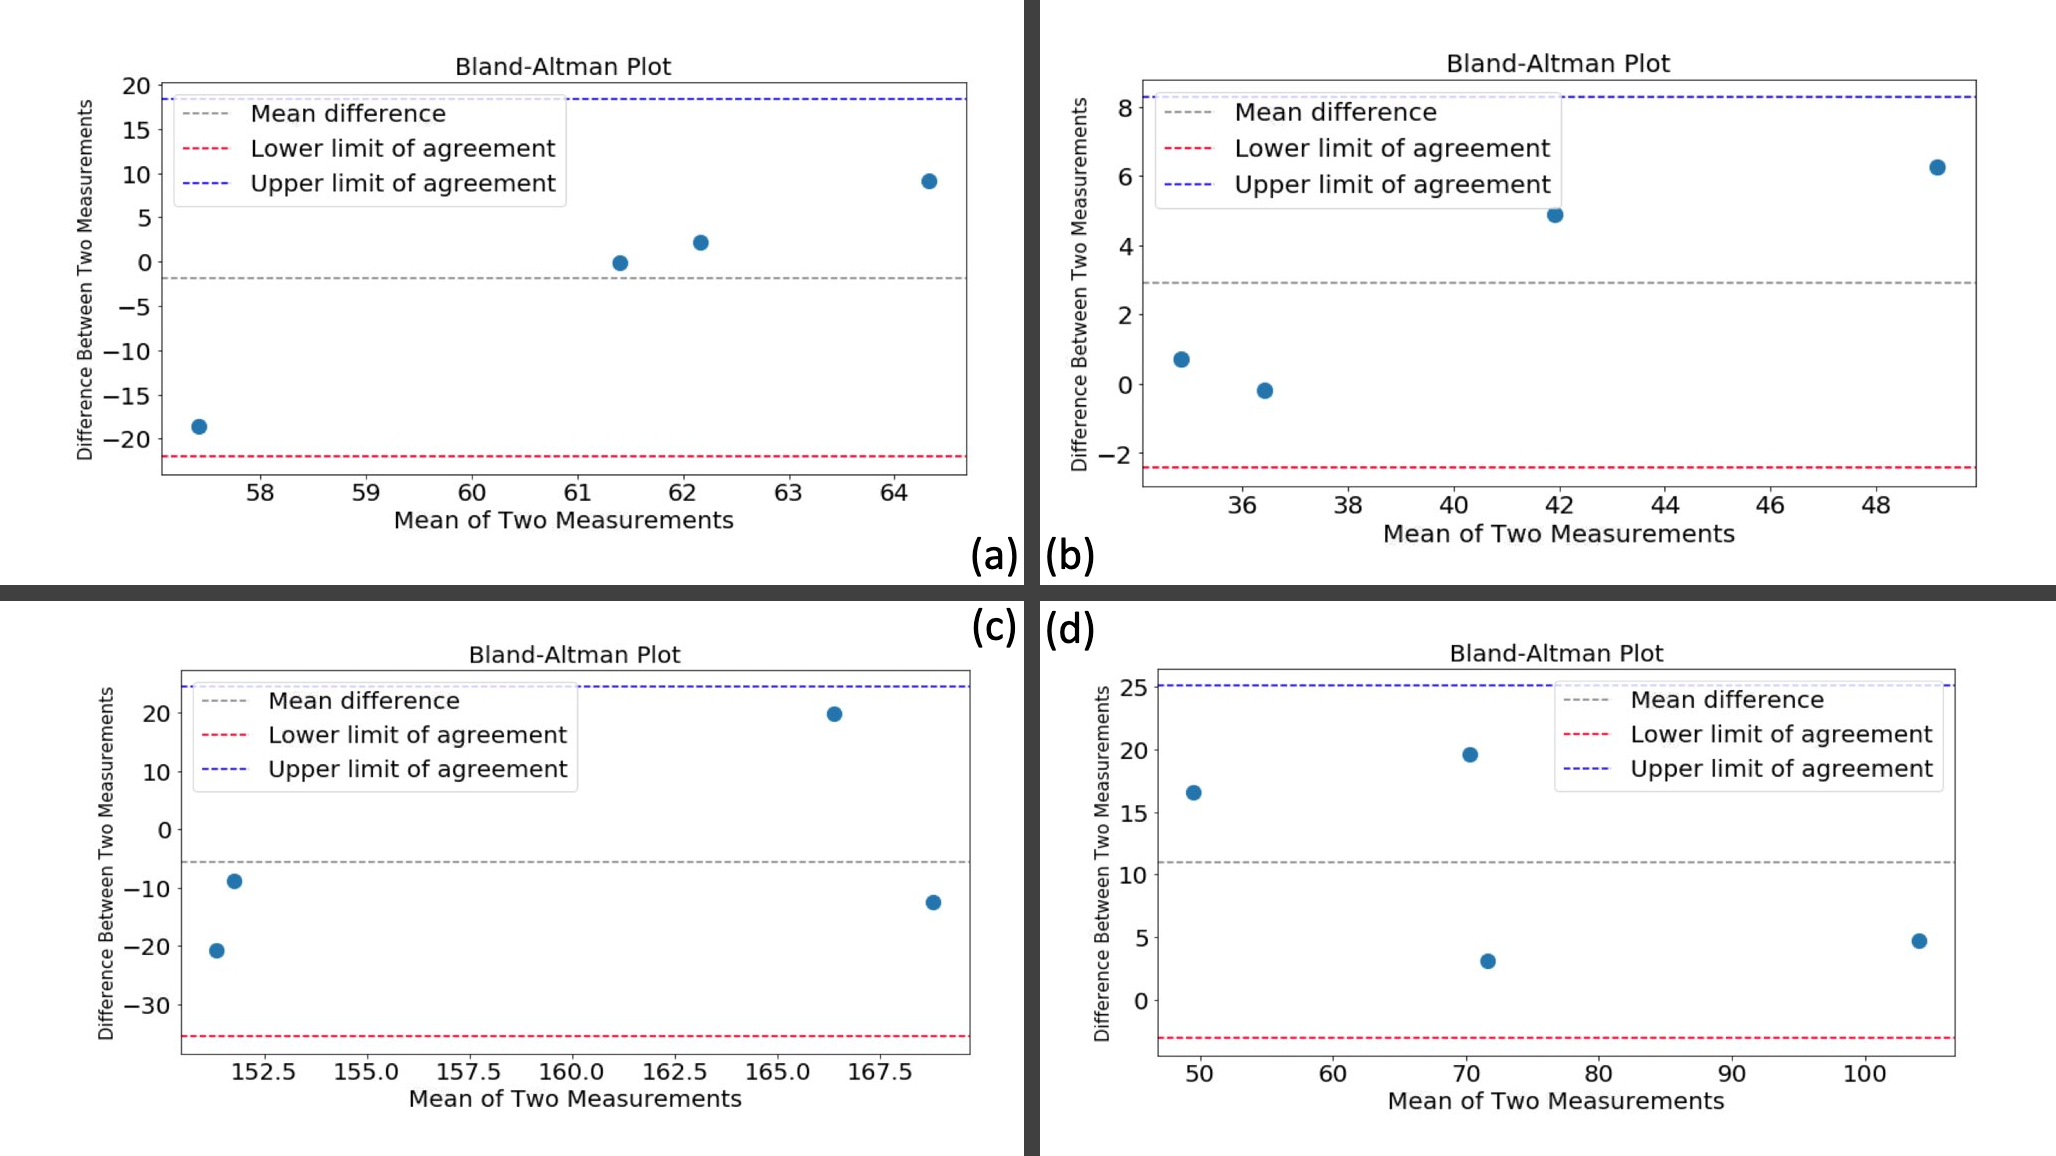
The Bland-Altman Plot in Fig. 5 shows a good agreement between the test and retest scans. The test-retest mean for the non-denoised CBF is marginally higher compared to the denoised CBF, yet the discrepancy between them is consistent. In the case of CSF, the denoising process results in markedly lower signal intensity and a reduced variance in the test-retest acquisitions.
Discussion and conclusion
BCSFB-ASL implemented in Siemens platform showed good test-retest reliability with the help of advanced denoising. The fitted Tb2csf value was in line with those reported in the seminal BCSFB-ASL work (1). While more data are required, this study confirms the feasibility of using ultra-long PLD and TE to estimate Tb2csf using a different imaging sequence and a MRI vendor platform than the original report.Acknowledgements
This work was supported by NIH grants: R01AG060054, R01AG070227, R01EB031080-01A1, R21AG082345, R21AG080518, P41EB029460-01A1 and 1UL1TR003098.References
1. Petitclerc L, Hirschler L, Wells JA, Thomas DL, van Walderveen MA, van Buchem MA, van Osch MJ. Ultra-long-TE arterial spin labeling reveals rapid and brain-wide blood-to-CSF water transport in humans. Neuroimage. 2021 Dec 15;245:118755.
2. Vidorreta M, Wang Z, Rodriguez I, et al. Comparison of 2D and 3D single-shot ASL perfusion fMRI sequences. Neuroimage. 2013;66:662-671.
3. Vidorreta M, Wang Z, Chang YV, et al. Whole-brain background-suppressed pCASL MRI with 1D-accelerated 3D RARE Stack-Of-Spirals readout. PLoS One 2017;12(8):e0183762.
4. Liu H, Li B, Li Y, Welsh R, Wang Z, “ASL MRI Denoising via Multi Channel CollaborativeLow-Rank Regularization”, SPIE Medical Imaging, Feb. 2024, San Diego, USA.
5. Liu H, Zhang J, Xiong R, “Image denoising based on correlation adaptive sparse modeling”, IEEE International Conference on Acoustics, Speech and Signal Processing (ICASSP), 2021 Jun 6 (pp. 2060-2064).
Figures
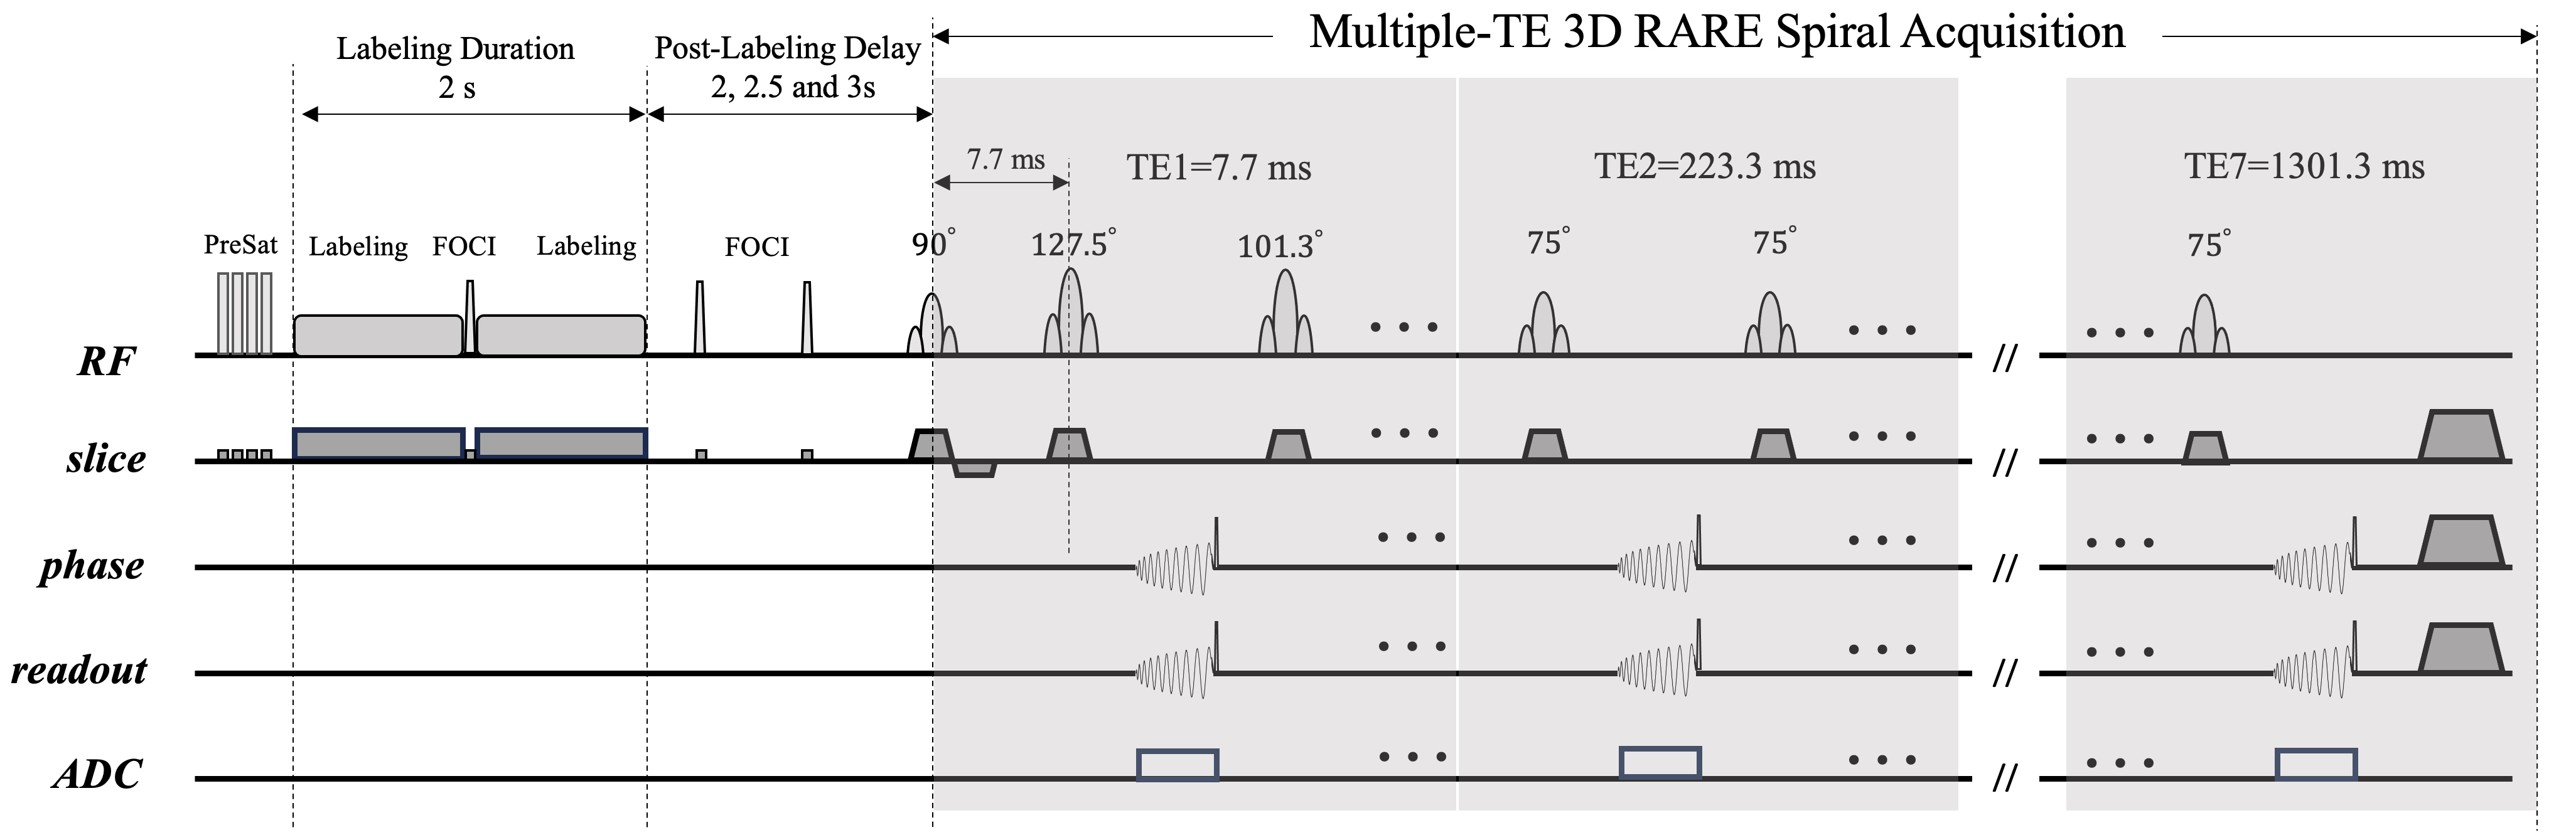
Figure 1. The diagram of multiple-TE 3D stack-of-spirals ASL sequence.Background suppression (BS) was implemented through four presaturation pulses and three slice-selective Frequency Offset Corrected Inversion (FOCI) pulses. The labeling duration is set at 2 seconds. This sequence encompasses a total of seven echo times (TEs) at 7.7 ms, 223.3 ms, 438.9 ms, 654.5 ms, 870.1 ms, 1085.7 ms, and 1301.3 ms.