3250
Towards brain blood metabolite measurement using MRS with pseudo-continuous arterial spin labeling1Physical Sciences Research Platform, Hurvitz Brain Sciences Program, Sunnybrook Research Institute, Toronto, ON, Canada, 2Wellcome Centre for Integrative Neuroimaging, FMRIB Division, Nuffield Department of clinical Neurosciences, University of Oxford, Oxford, United Kingdom, 3Department of Medical Biophysics, University of Toronto, Toronto, ON, Canada
Synopsis
Keywords: Pulse Sequence Design, Pulse Sequence Design, Arterial Spin Labelling; Spectroscopy
Motivation: Single voxel spectroscopy allows us to measure the metabolite signal within a voxel in the brain. There are strides to mathematically segment this signal based on tissue type: grey matter, white matter, and cerebral spinal fluid. However, blood is also an important component to this signal as the brain is heavily vascularized.
Goal(s): We wish to better understand the MR signal contribution coming from blood in the brain.
Approach: Borrowing from imaging-based pCASL, we’ve combined the RF tagging pulse train to a standard PRESS sequence, creating SVS-pCASL.
Results: With our preliminary testing, we observed an ASL effect on the unsuppressed water signal.
Impact: MRS provides us with useful information regarding the metabolite signals. However, one key component is overlooked, blood. Combining pCASL RF tagging with PRESS to create SVS-pCASL, our preliminary results show an ASL effect on unsuppressed water signal in the brain.
Introduction
Standard single-voxel magnetic resonance spectroscopy (MRS) measures the signatures of metabolites within a user-selected volume of interest (VoI). This signal arises from metabolites within all tissues in this VoI. In the brain, there are strides to mathematically separate the signal between grey and white matter, and cerebral spinal fluid1. However, there is another volume that might also influence the resulting metabolite signal: blood. The brain is heavily vascularized, having a blood volume of approximately 5.4ml per 100g of grey matter tissue and 2.6ml per 100g of white matter tissue2.In the imaging realm, Arterial Spin Labeling3 (ASL) is an increasingly popular MRI-based method used for visualizing and quantifying cerebral blood flow without the use of contrast-agents. In its most basic form, ASL acquisitions consists of two scan conditions: tag and control. For "tag" scans, RF pulse(s) invert the blood in a slice inferior to the imaging plane. During the Post Labelling Display (PLD) time, the labelled blood flows into the brain vessels and capillaries and then imaging slices are acquired. For "control" scans, no tagging is performed. The subtraction of these two scans provides a perfusion-weighted image. Pseudo-Continuous ASL4 (pCASL) is a widely used labeling scheme where a train of short inversion pulses are utilized for tagging and control, offering high SNR while staying within SAR limits. While ASL is commonly used to assess blood water perfusion in the brain, it has yet to be used, to our knowledge, to assess blood metabolite signals in the brain.
We have developed a pulse sequence for single voxel spectroscopy with pseudo-continuous arterial spin labeling (SVS-pCASL), which combines the RF tagging pulse train from pCASL5 with a standard PRESS MRS localization sequence.
Methods
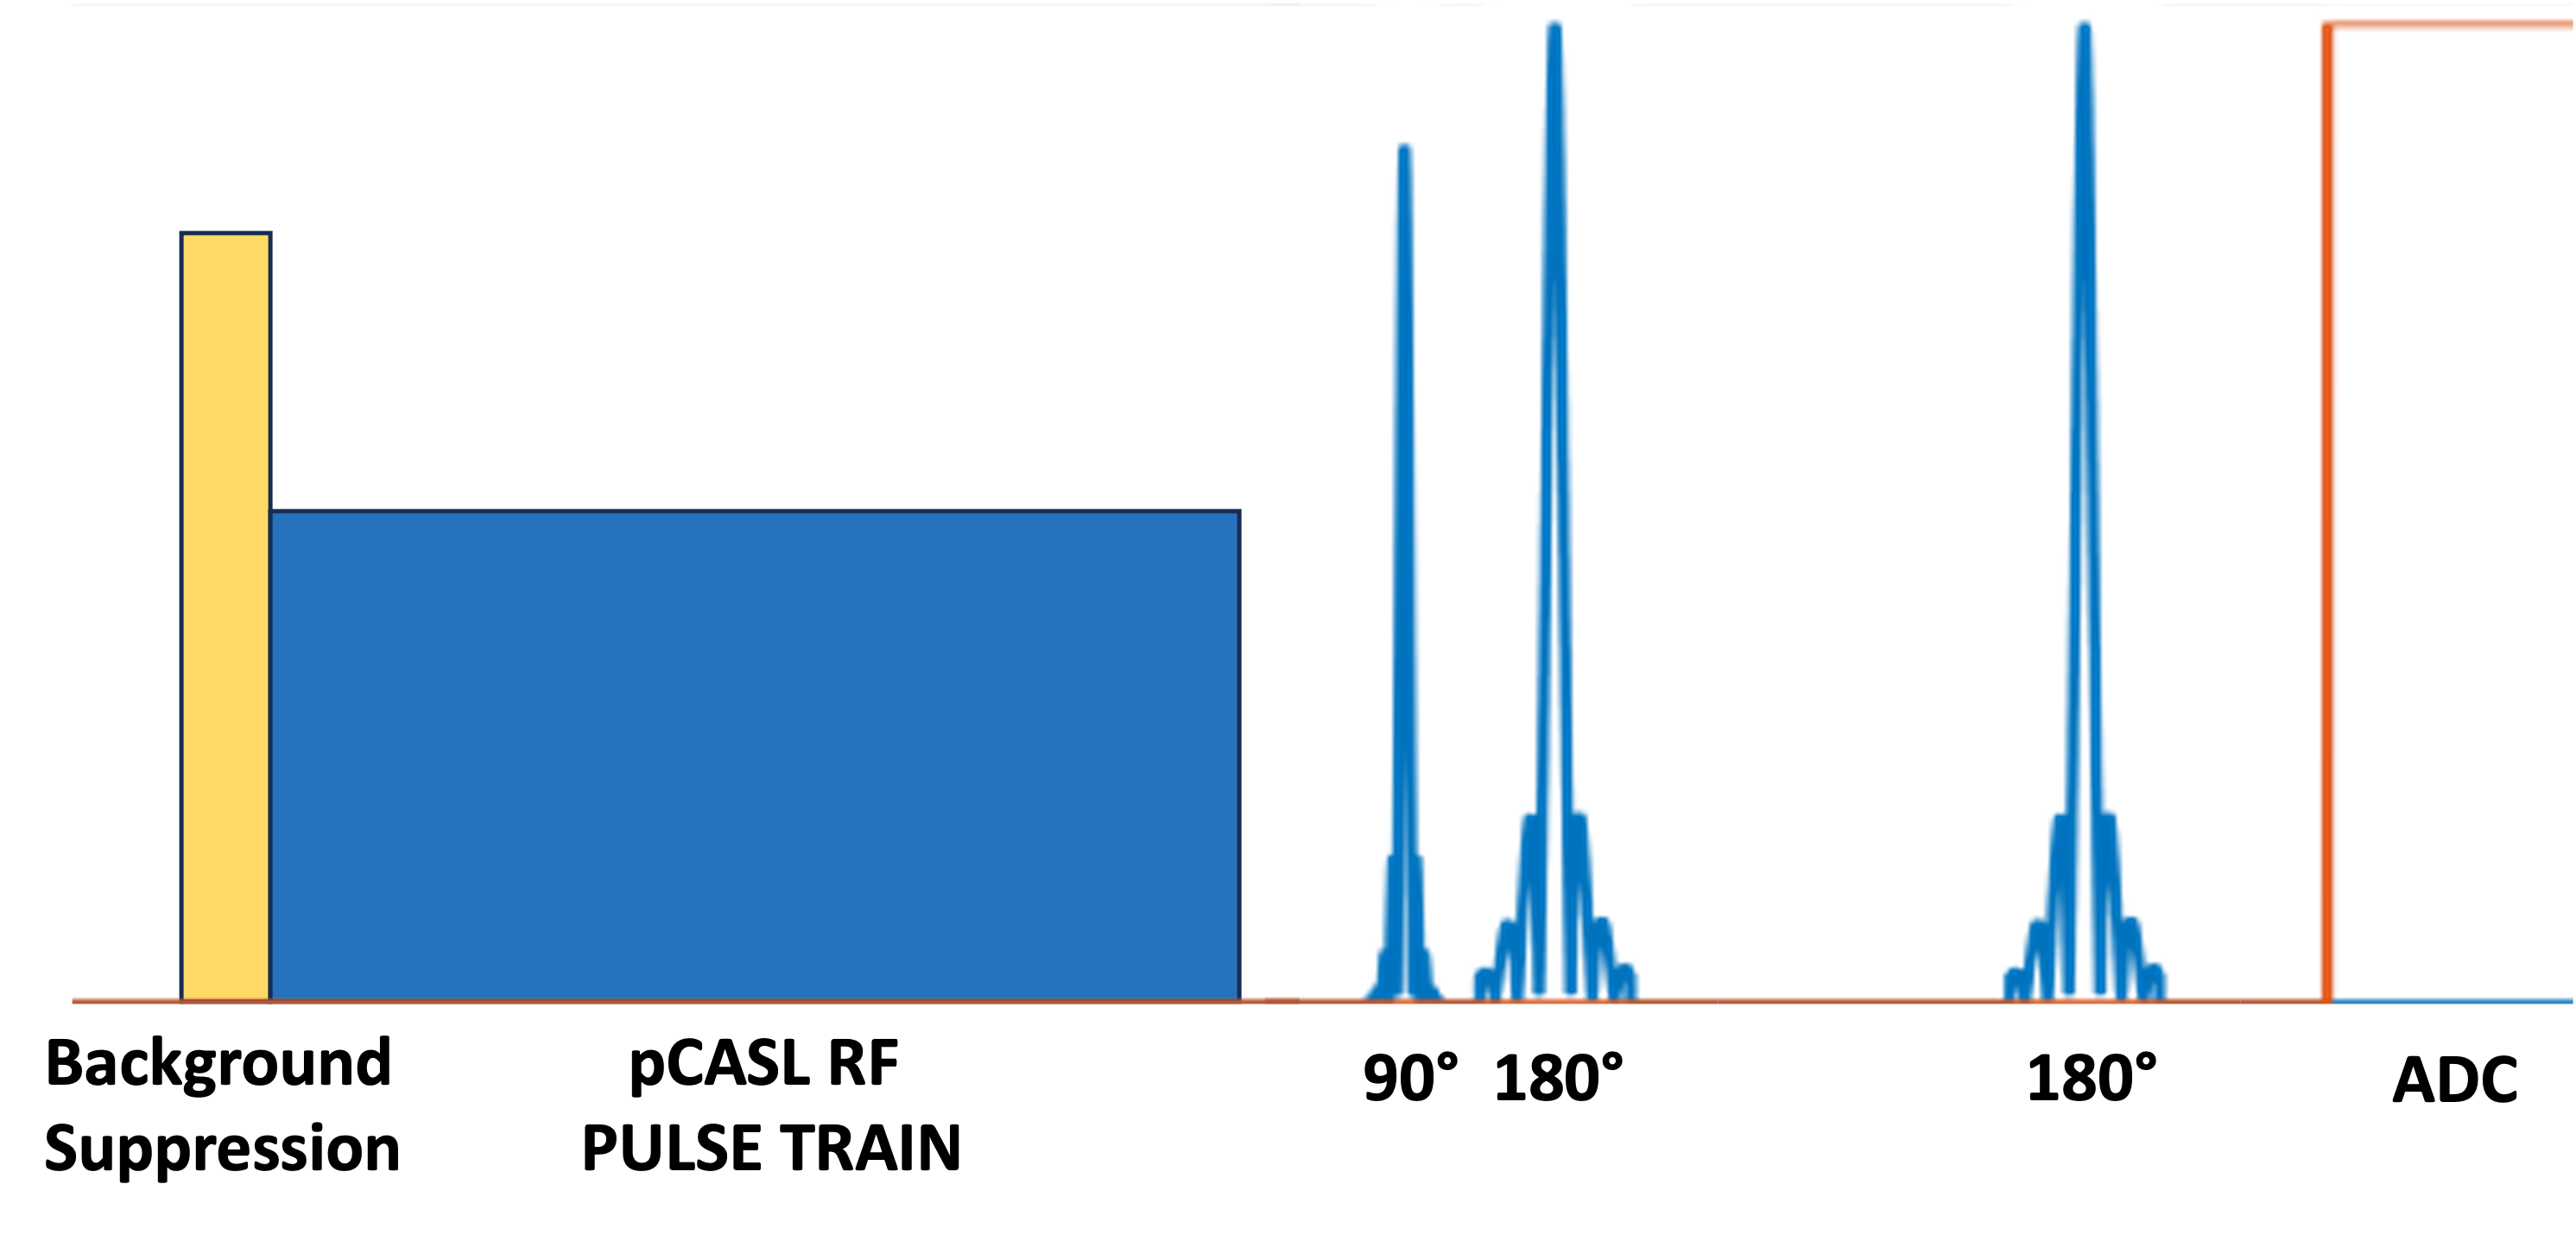
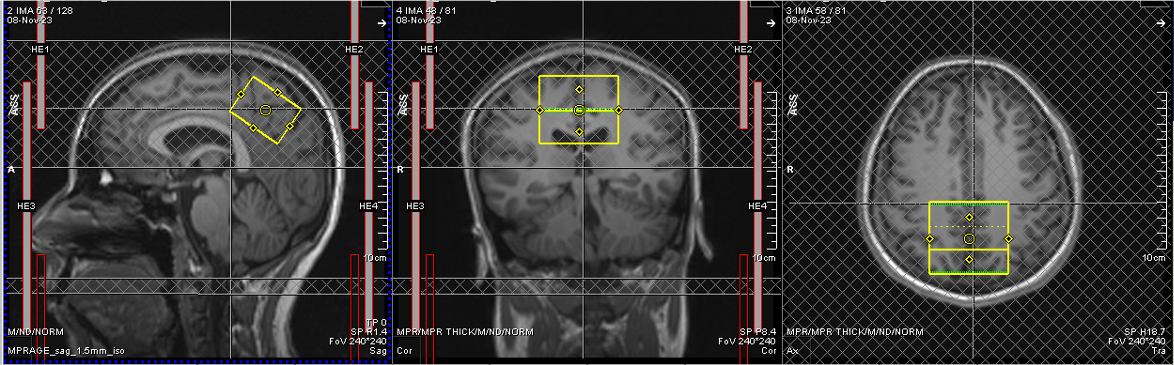
The pulse sequence is shown in Figure 1. Background suppression6 (BGS) and pCASL RF pulse trains are performed prior to excitation. The outer volume suppression (OVS) pulses that are natively included in the Siemens svs_se sequence were adapted for prescription of the background suppression and pCASL slabs.As a proof of concept, we wanted to first see if we can achieve an ASL effect on unsuppressed water. One healthy volunteer (27 F) was scanned using a 3T Siemens Prisma-XR (Erlangen, Germany) using a 20-channel head and neck coil. A 50 (RL) x 37 (AP) x 27 (SI) voxel (50cc) was placed in the parietal region (Figure 2). The pCASL labelling slabs was placed below the cerebellum and background suppression slabs was placed in line of the VoI. We acquired spectra with and without BGS and used PLD times of: 100ms, 200ms, 300ms, 500ms, 800ms, 1000ms, 1300ms, 1500ms, and 1800ms.
The following parameters were used for the pCASL pulse train: gaussian RF pulse; RF duration = 500 us; total tag duration = 1000ms; number of pulses = 666; flip angle = 20 degrees; mean tag gradient = 0.8 mT/m, tag gradient amplitude = 6 mT/m. MRS scanning parameters were: TR = 4s, TE = 30ms, number of points = 2048, spectral width = 2000 Hz, number of averages = 8.
All processing was performed using the FID-A processing toolbox (Github.com/CIC-methods/FID-A). Data was coil combined, frequency and phased corrected using spectral registration7, then averaged. A different spectrum was made from subtracting the averaged control spectrum from the averaged tagged spectrum.
Results
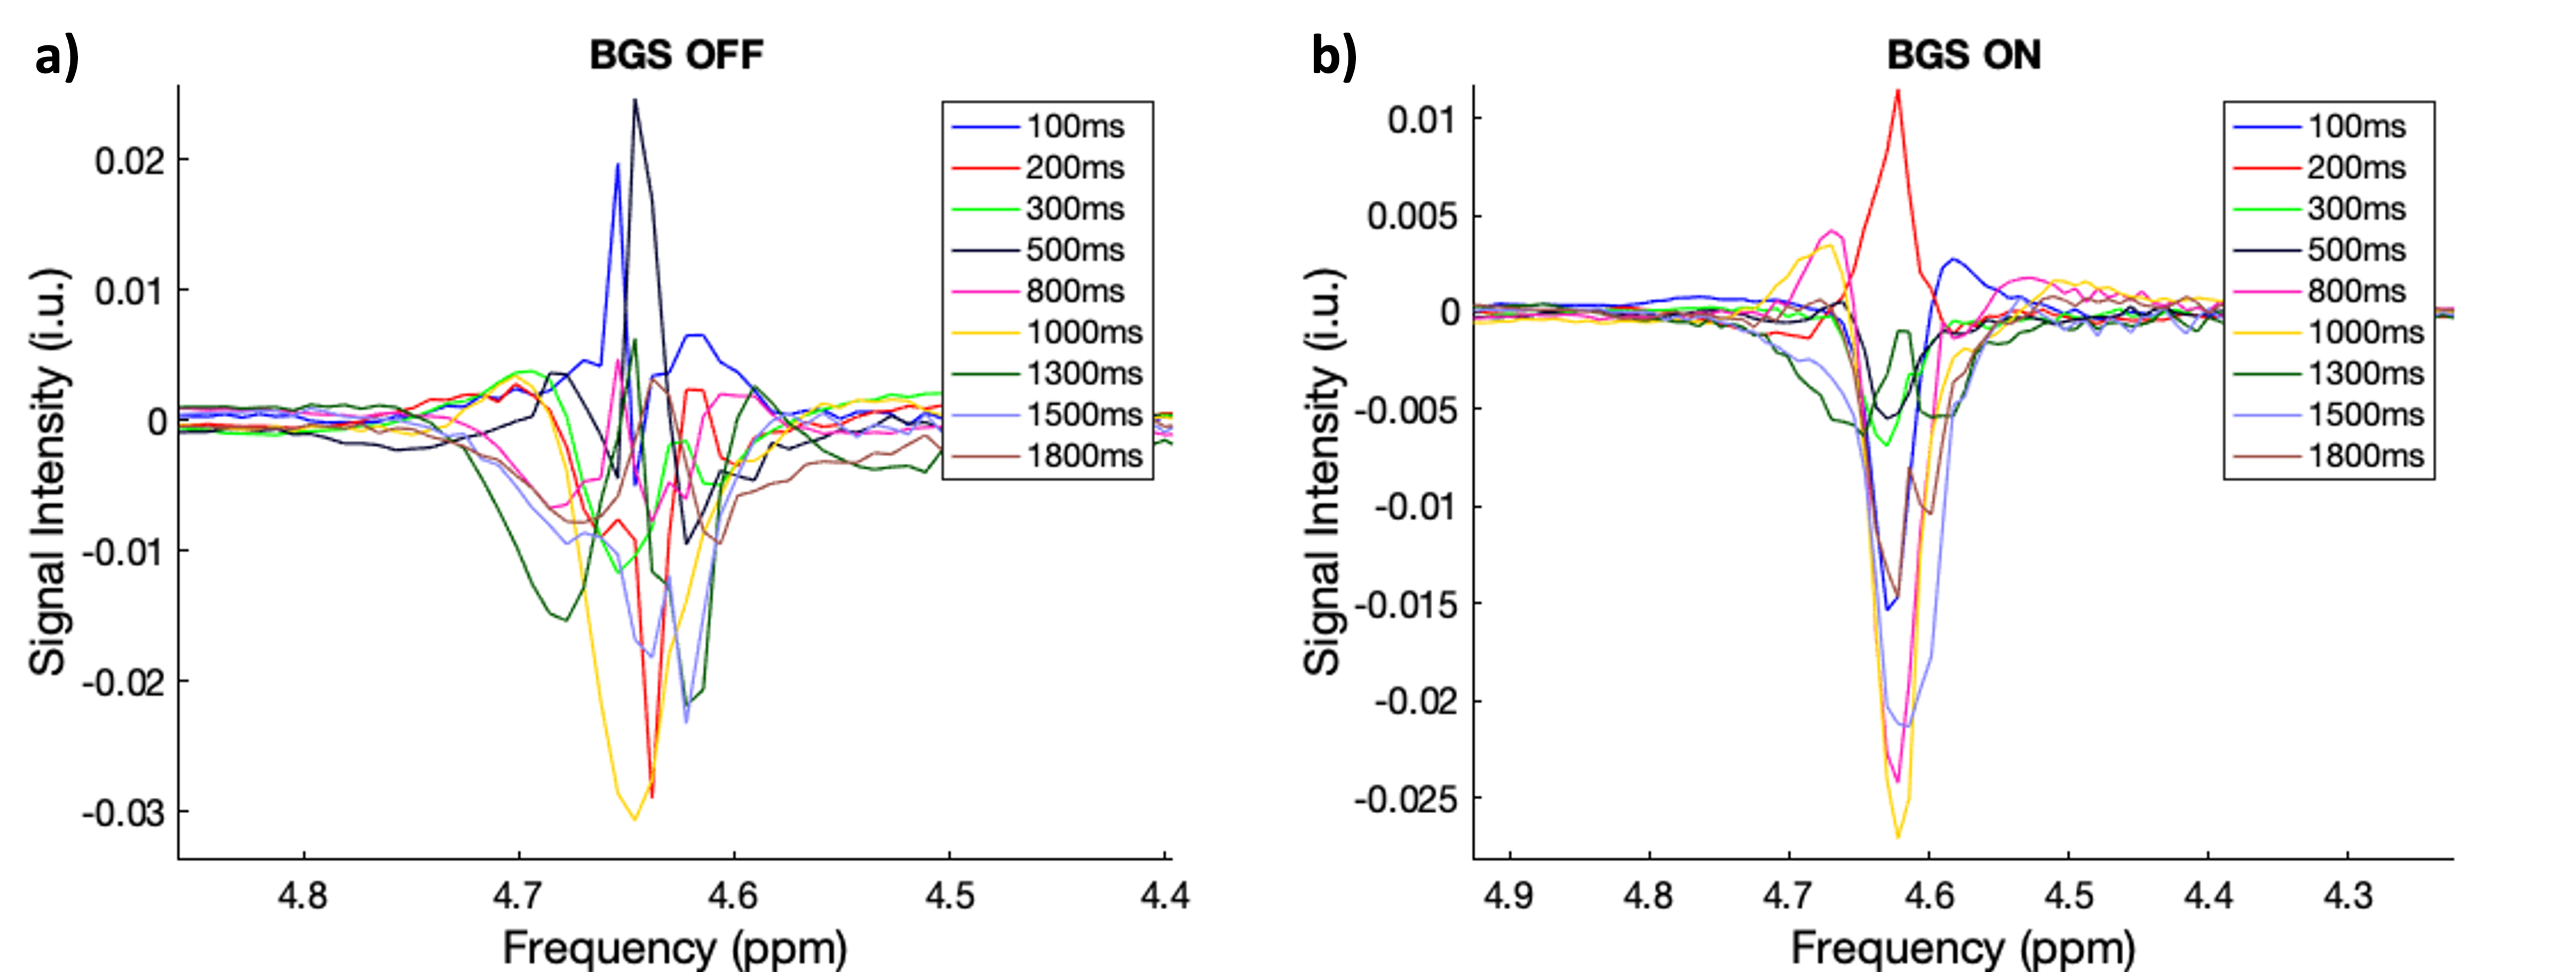
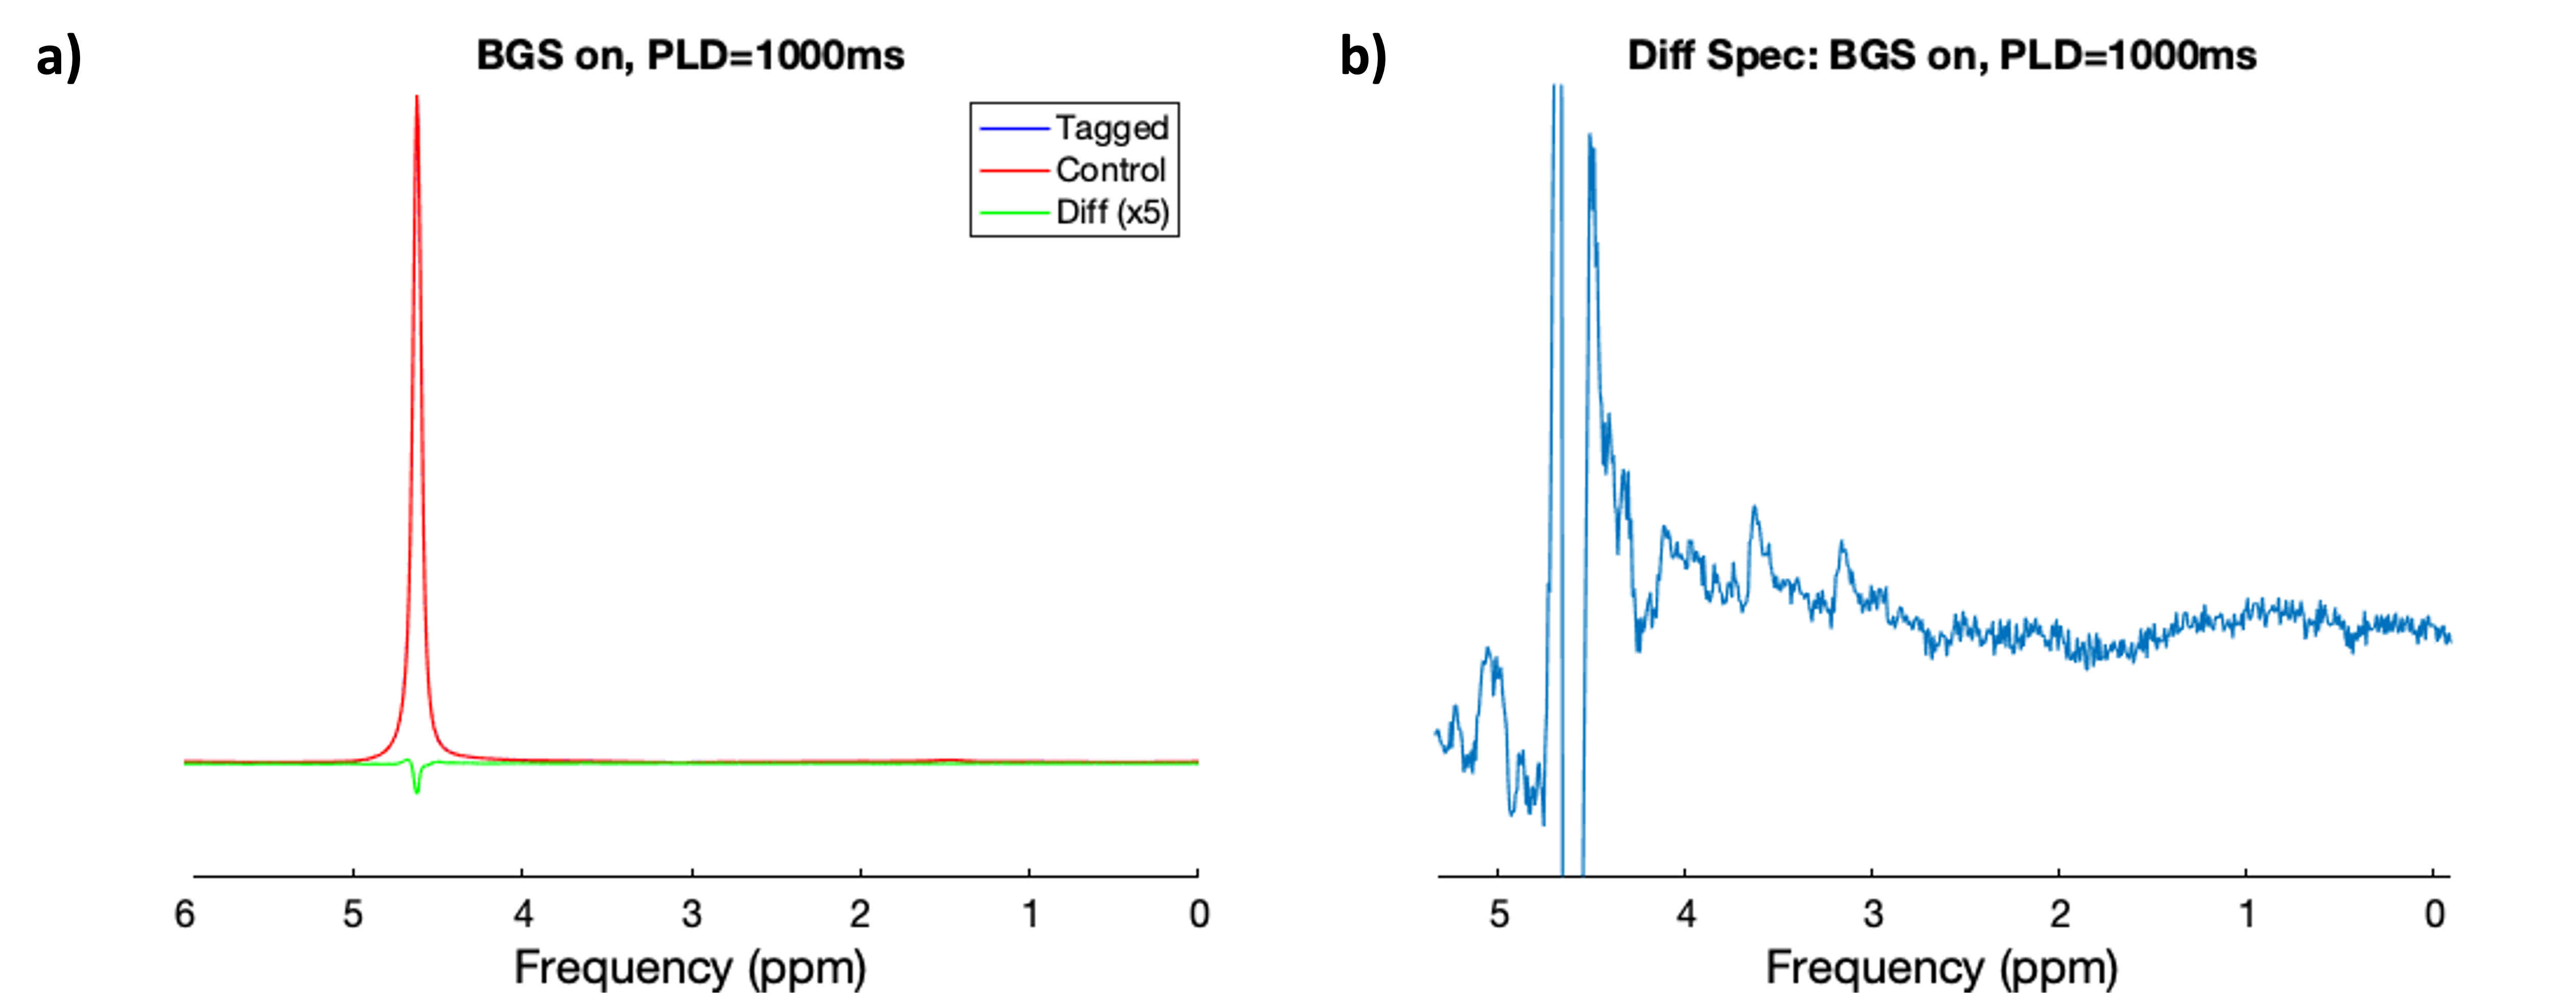
The plots of the difference spectrum with and without BGS are shown in Figure 3. We can observe that the subtracted water peak intensity is negatively increasing, bottoming out at PLD = 1000ms. A closer look of the tagged, control and difference spectra with BGS and PLD=1000ms are shown in Figure 4.Discussion
In our first preliminary scans of SVS-pCASL, we were able to observe an ASL effect in our scans and determine that a PLD of 1000ms will give us maximum signal difference. With only 8 averages we already can see some peaks between 3-3.7 ppm. However, it is too early to know the significance of these signals, more in-vivo scans are necessary to determine whether they’re real or not. With these results we are optimistic that with further fine-tuning of our sequence and acquisition we can develop SVS-pCASL into a valuable sequence.Acknowledgements
I would like to thank my friends at Sunnybrook for all their support. I couldn't have done it without them!
References
1. Gasparovic, C., Chen, H., & Mullins, P. G. (2018). Errors in 1 H-MRS estimates of brain metabolite concentrations caused by failing to take into account tissue-specific signal relaxation. NMR in biomedicine, 31(6), e3914. https://doi.org/10.1002/nbm.3914
2. Li, W, Liu, D, van Zijl, PCM, Qin, Q. Three-dimensional whole-brain mapping of cerebral blood volume and venous cerebral blood volume using Fourier transform–based velocity-selective pulse trains. Magn Reson Med. 2021; 86: 1420–1433. https://doi.org/10.1002/mrm.28815
3. Detre, J. A., Leigh, J. S., Williams, D. S., & Koretsky, A. P. (1992). Perfusion imaging. Magnetic resonance in medicine, 23(1), 37–45. https://doi.org/10.1002/mrm.1910230106
4. Dai, W., Garcia, D., de Bazelaire, C., & Alsop, D. C. (2008). Continuous flow-driven inversion for arterial spin labeling using pulsed radio frequency and gradient fields. Magnetic resonance in medicine, 60(6), 1488–1497. https://doi.org/10.1002/mrm.21790
5. Okell, T. W., Chappell, M. A., Kelly, M. E., & Jezzard, P. (2013). Cerebral blood flow quantification using vessel-encoded arterial spin labeling. Journal of cerebral blood flow and metabolism : official journal of the International Society of Cerebral Blood Flow and Metabolism, 33(11), 1716–1724. https://doi.org/10.1038/jcbfm.2013.129
6. Günther, M., Oshio, K., & Feinberg, D. A. (2005). Single-shot 3D imaging techniques improve arterial spin labeling perfusion measurements. Magnetic resonance in medicine, 54(2), 491–498. https://doi.org/10.1002/mrm.20580
7. Near, J., Edden, R., Evans, C. J., Paquin, R., Harris, A., & Jezzard, P. (2015). Frequency and phase drift correction of magnetic resonance spectroscopy data by spectral registration in the time domain. Magnetic resonance in medicine, 73(1), 44–50. https://doi.org/10.1002/mrm.25094
Figures