3240
Novel Sampling Schemes of Spin-locking Times to Improve Reproducibility of Quantitative 3D T1rho Mapping1Department of Medical Physics, Memorial Sloan Kettering Cancer Center, New York, NY, United States, 2Department of Radiology, Albert Einstein College of Medicine and Montefiore Medical Center, Bronx, NY, United States, 3MR Clinical Science, Philips Healthcare, Cambridge, MA, United States, 4Department of Radiology, Memorial Sloan Kettering Cancer Center, New York, NY, United States
Synopsis
Keywords: Data Acquisition, Quantitative Imaging, T1rho, Reproducibility, TSLs Sampling, Magnetization Preparation
Motivation: Reproducibility of T1rho measurements is crucial for longitudinal studies, as highly reproducible measurements are needed to detect treatment-induced changes in tissue properties.
Goal(s): To evaluate two novel sampling schemes of spin-locking times (TSLs) to improve the reproducibility of T1rho quantification in inhomogeneous fields (B1/B0) compared to previously reported TSL-sampling schemes.
Approach: T1rho sequences with three different T1rho preparation modules and four TSL-sampling schemes were used for repeated scans of phantom and volunteers to evaluate reproducibility in each case.
Results: The proposed TSL-sampling schemes produced significantly better reproducibility (i.e., lower coefficient of variation) than the previously reported TSL-sampling schemes.
Impact: The proposed novel TSL-sampling schemes may enable T1rho relaxation parameter as a robust biomarker of imaging tissues with a slow-motional process despite B1/B0 inhomogeneities.
INTRODUCTION
Reproducibility of MR parameter quantification is paramount for application as a clinical biomarker. T1rho-relaxation is sensitive to slow-motional water-macromolecular interactions1, and previous studies have demonstrated the clinical potential of T1rho-imaging in the brain, heart, liver, and knee1-4. However, T1rho-prepared magnetization oscillates in the presence of B1/B0 inhomogeneities, leading to “banding-artifacts,” which increase T1rho measurement variability5. Previously reported, precision-guide-sampling (PG)6 has shown SNR advantage over linear-sampling (LS), leading to more accurate measurement of T1rho-values6. However, it doesn't improve reproducibility. Therefore, an alternative scheme which has high SNR and reproducibility is needed.This study presents two novel TSL-sampling schemes to improve the reproducibility of T1rho-imaging. A combination of three commonly used T1rho-preparation modules and four TSL-sampling schemes was used to compare the T1rho-quantification reproducibility using phantom and volunteer experiments.
METHODS
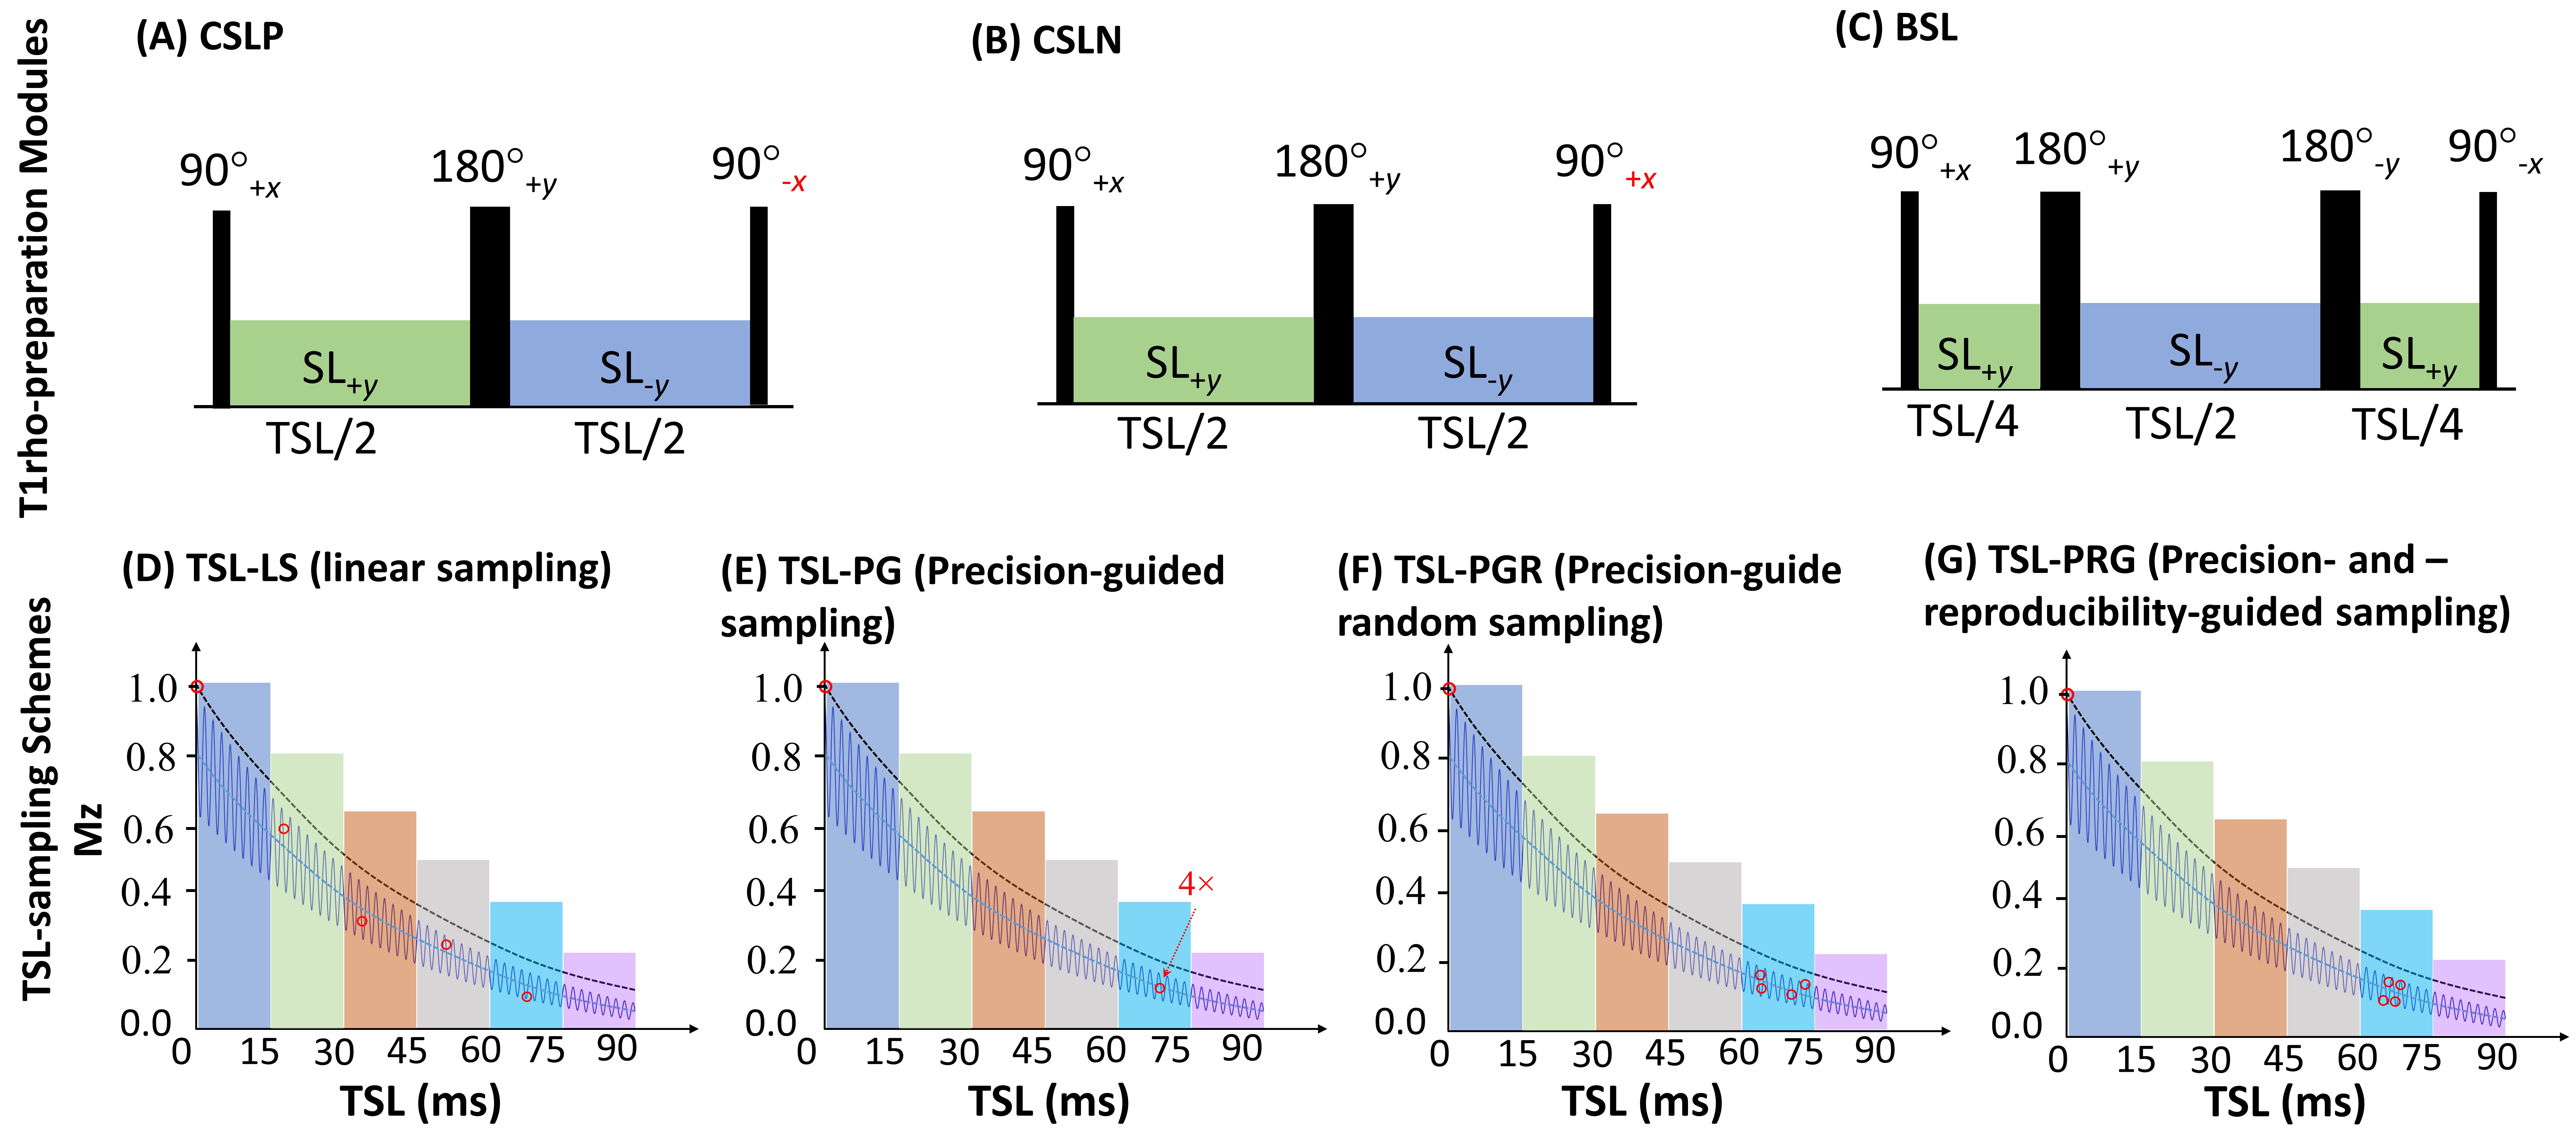
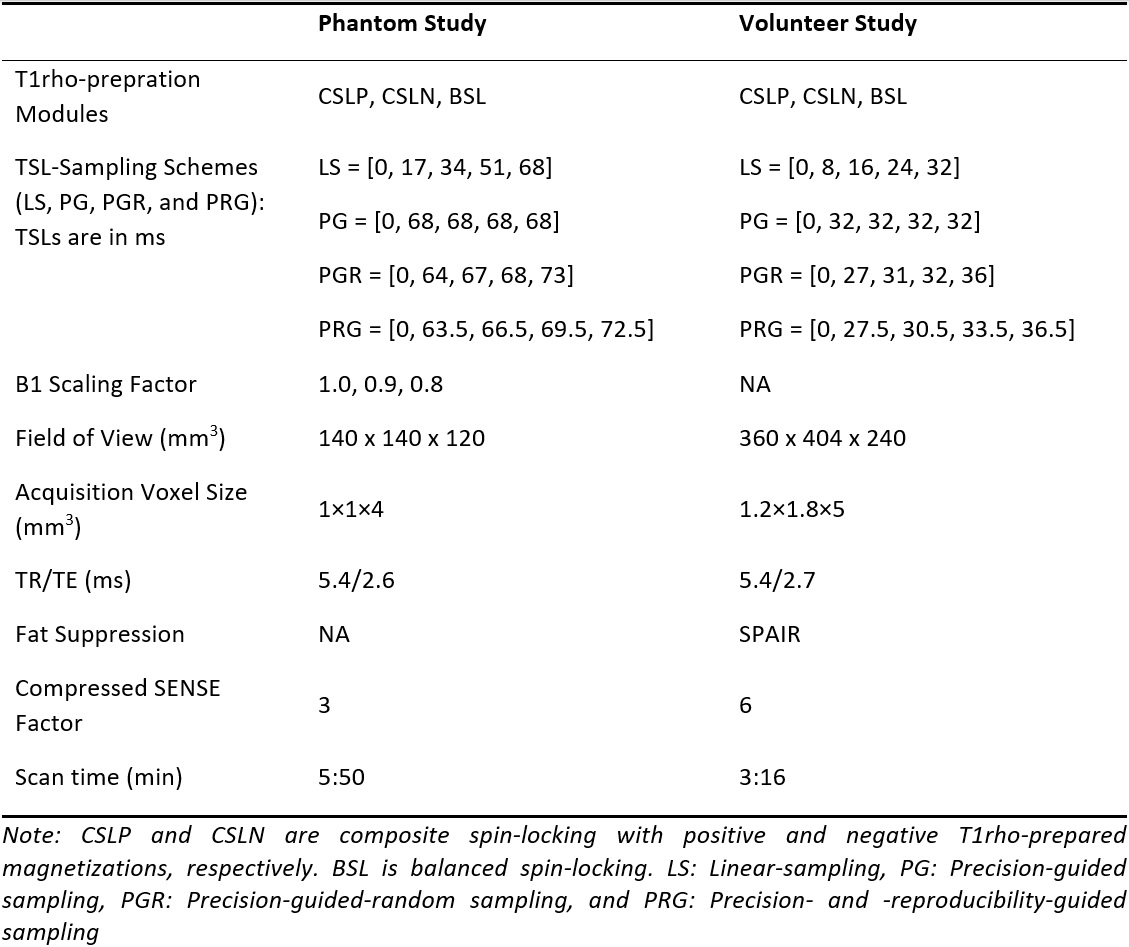

The three T1rho-preparation modules used in this study were: composite-spin-locking with positive (CSLP) and negative (CSLN) magnetizations and balanced-spin-locking (BSL)5,7, as shown in Figure 1A-C. This study compares LS and PG-sampling schemes with two newly proposed TSL-sampling schemes: precision-guided random sampling (PGR) and precision- and reproducibility-guided sampling (PRG)8, as shown in Figure 1D-G. This study used LS as five-TSLs sampled in a constant time interval between 0ms and the maximum TSL (TSLmax), whereas PG has 0ms and four repeated TSLs around TSLmax6. Departed from PG-sampling, the higher TSLs are randomly chosen close to TSLmax in PGR-sampling. Whereas, in PRG-sampling, higher TSLs were chosen to be an equal time interval of ΔTSL=1/(2*fosc), near TSLmax, where fosc represents the frequency of magnetization oscillations which is approximately half of spin-locking frequency based on simulation8.The volunteer and phantom studies used a 3T-MRI scanner (Ingenia Elition X, Philips Healthcare, Best, The Netherlands). In the phantom study, eight repeated scans were conducted on a phantom with three pairs of tubes with different T1rho-values (Figure 2A). In each repeated scan, the RF pulses were intentionally adjusted to the nominal B1 with scaling factors of 1.0, 0.9, and 0.8 times to assess B1-offest’s impact on T1rho quantification. T1rho-maps were generated for five slices (0, ±1.8cm, ±3.6cm from the center).
Three volunteers’ thigh muscles underwent five-repeated scans using 3D T1rho-imaging, 3D T1-weighted imaging, and mDixon sequences. Fixation modules and image registration were deployed for consistent positioning. The muscle regions were segmented using mDixon images to compare T1rho-values at the pixel level and evaluate reproducibility (Figure 2B). B0-maps from mDixon defined the ranges of B0 field inhomogeneities (0-200Hz).
Table 1 presents scan details and parameters for both studies. Before curve-fitting to generate T1rho-map using a complex-valued data9, the 3D-volumes of TSLs were registered using Elastix10. The coefficient of variation (CoV) of T1rho-values for each B0/B1 field region was evaluated. Additionally, a paired t-test was used to determine the statistical significance of the phantom study.
RESULTS
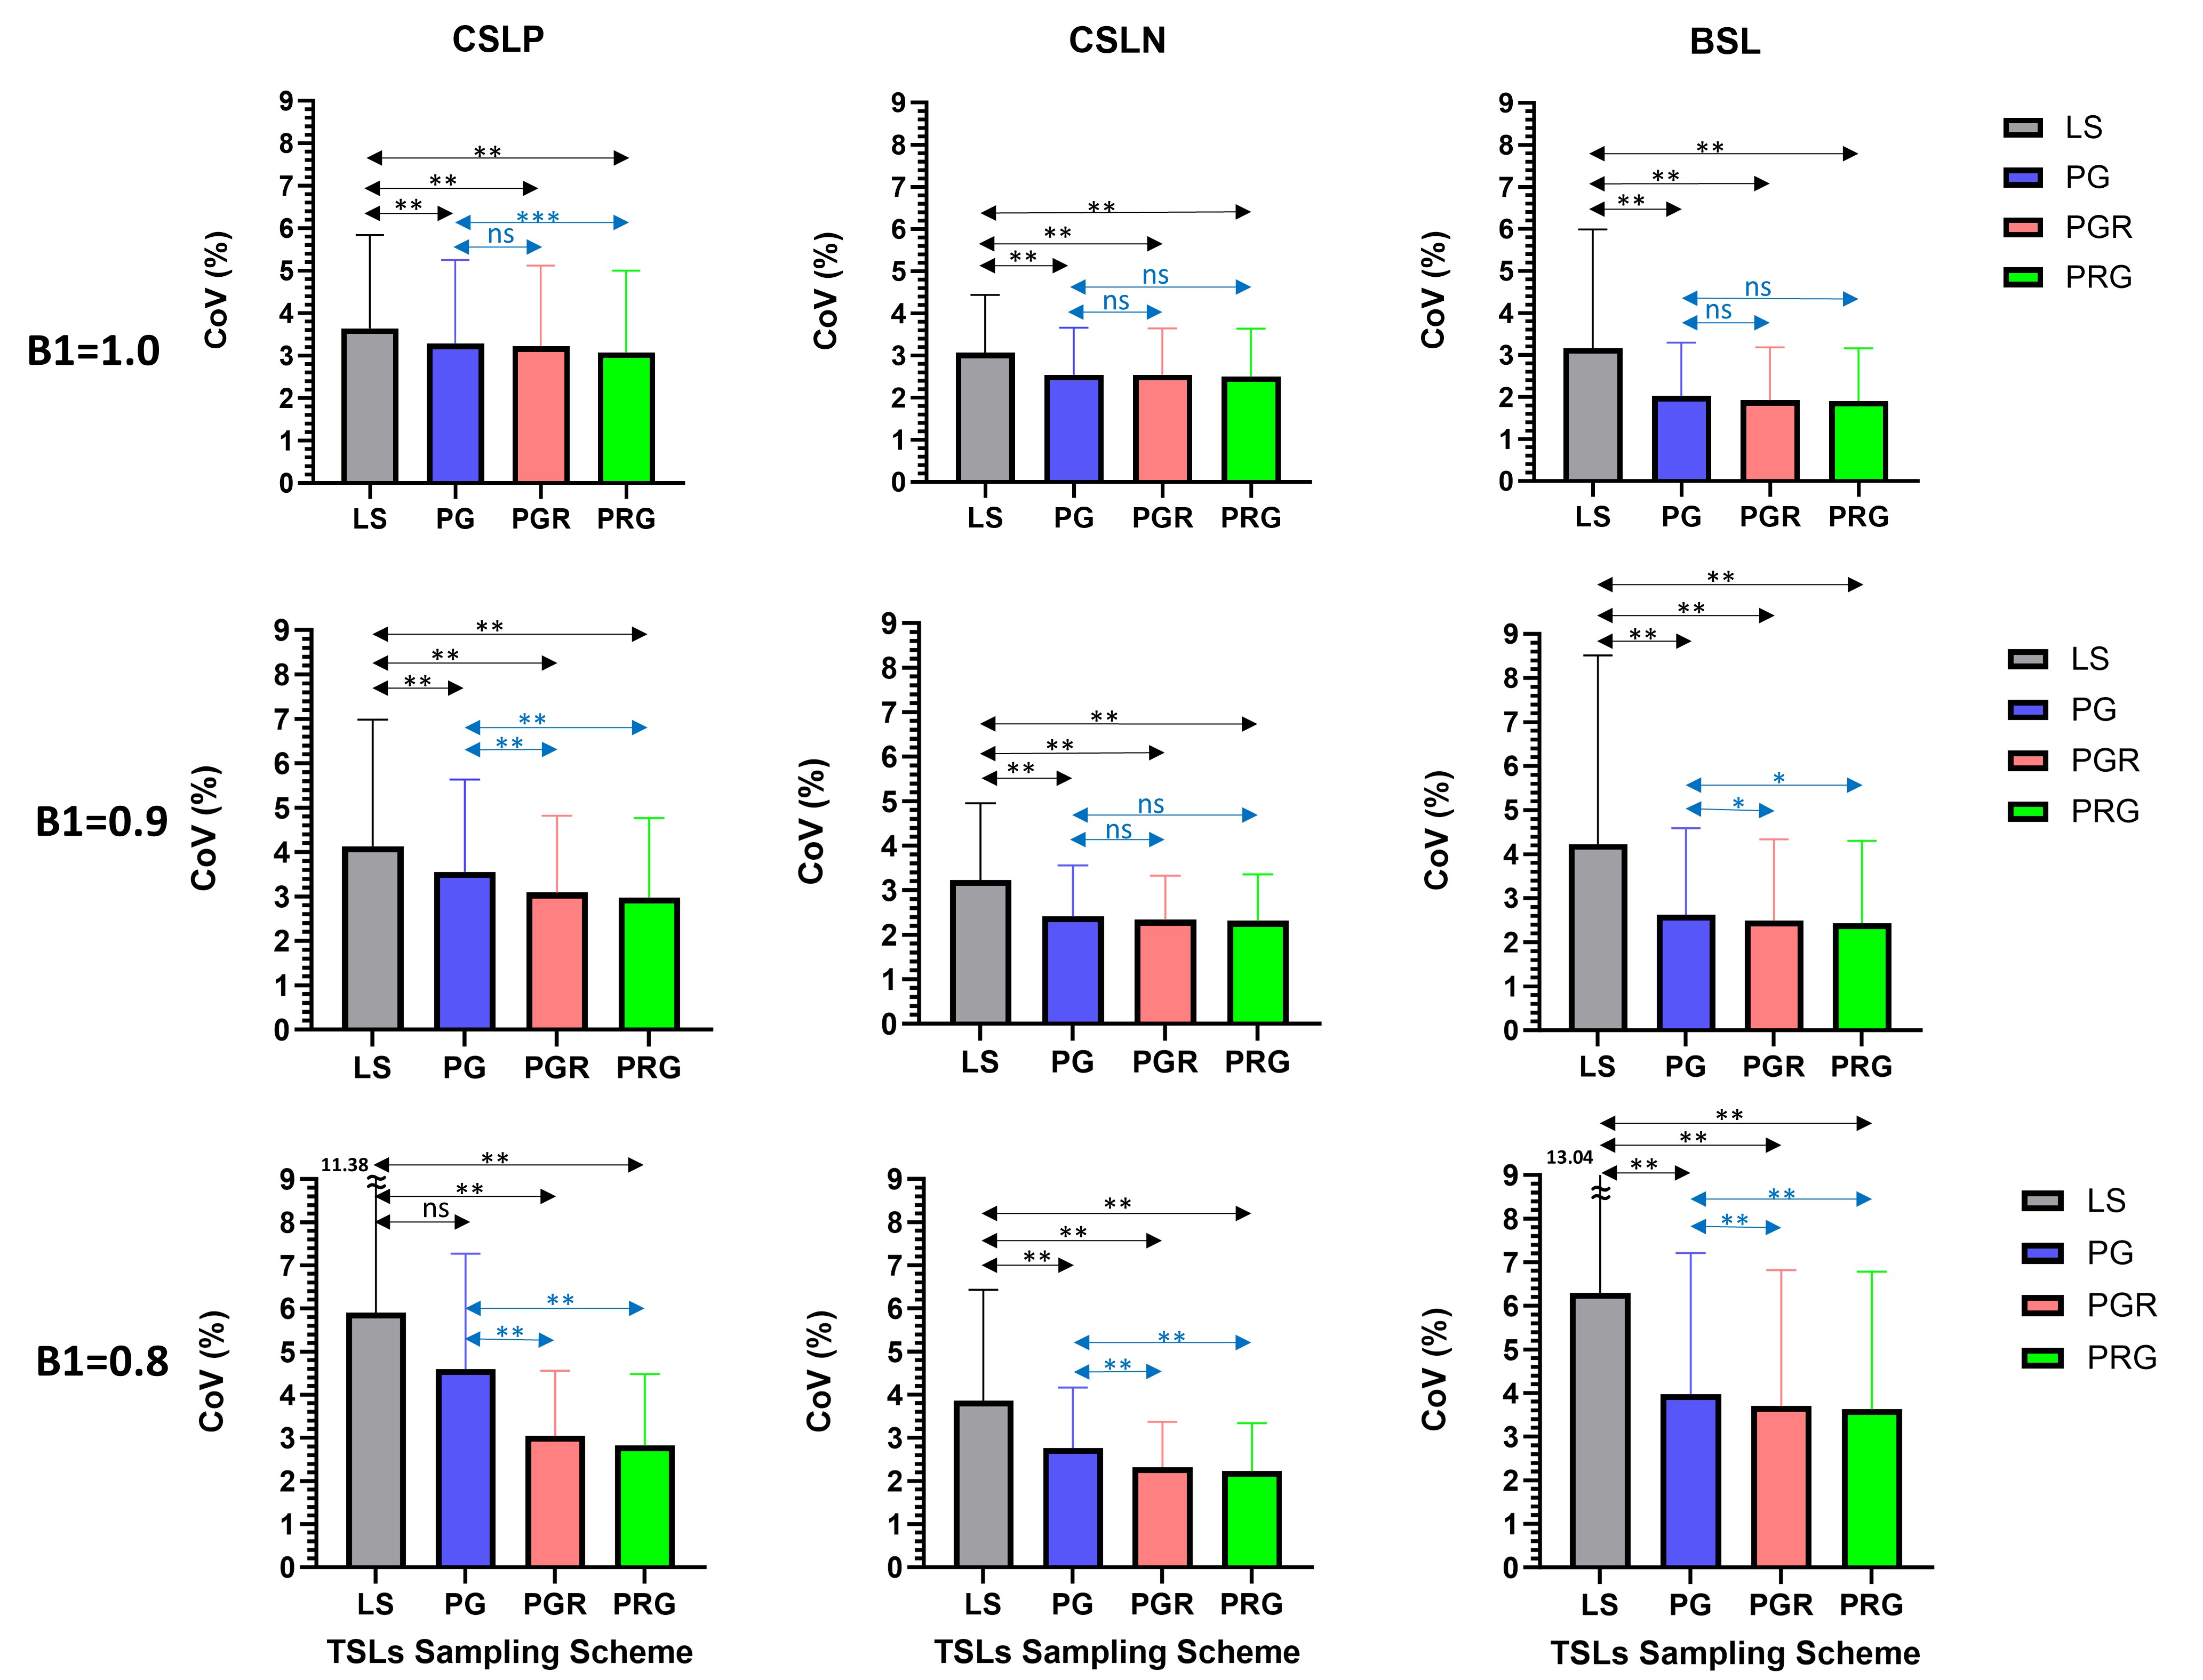
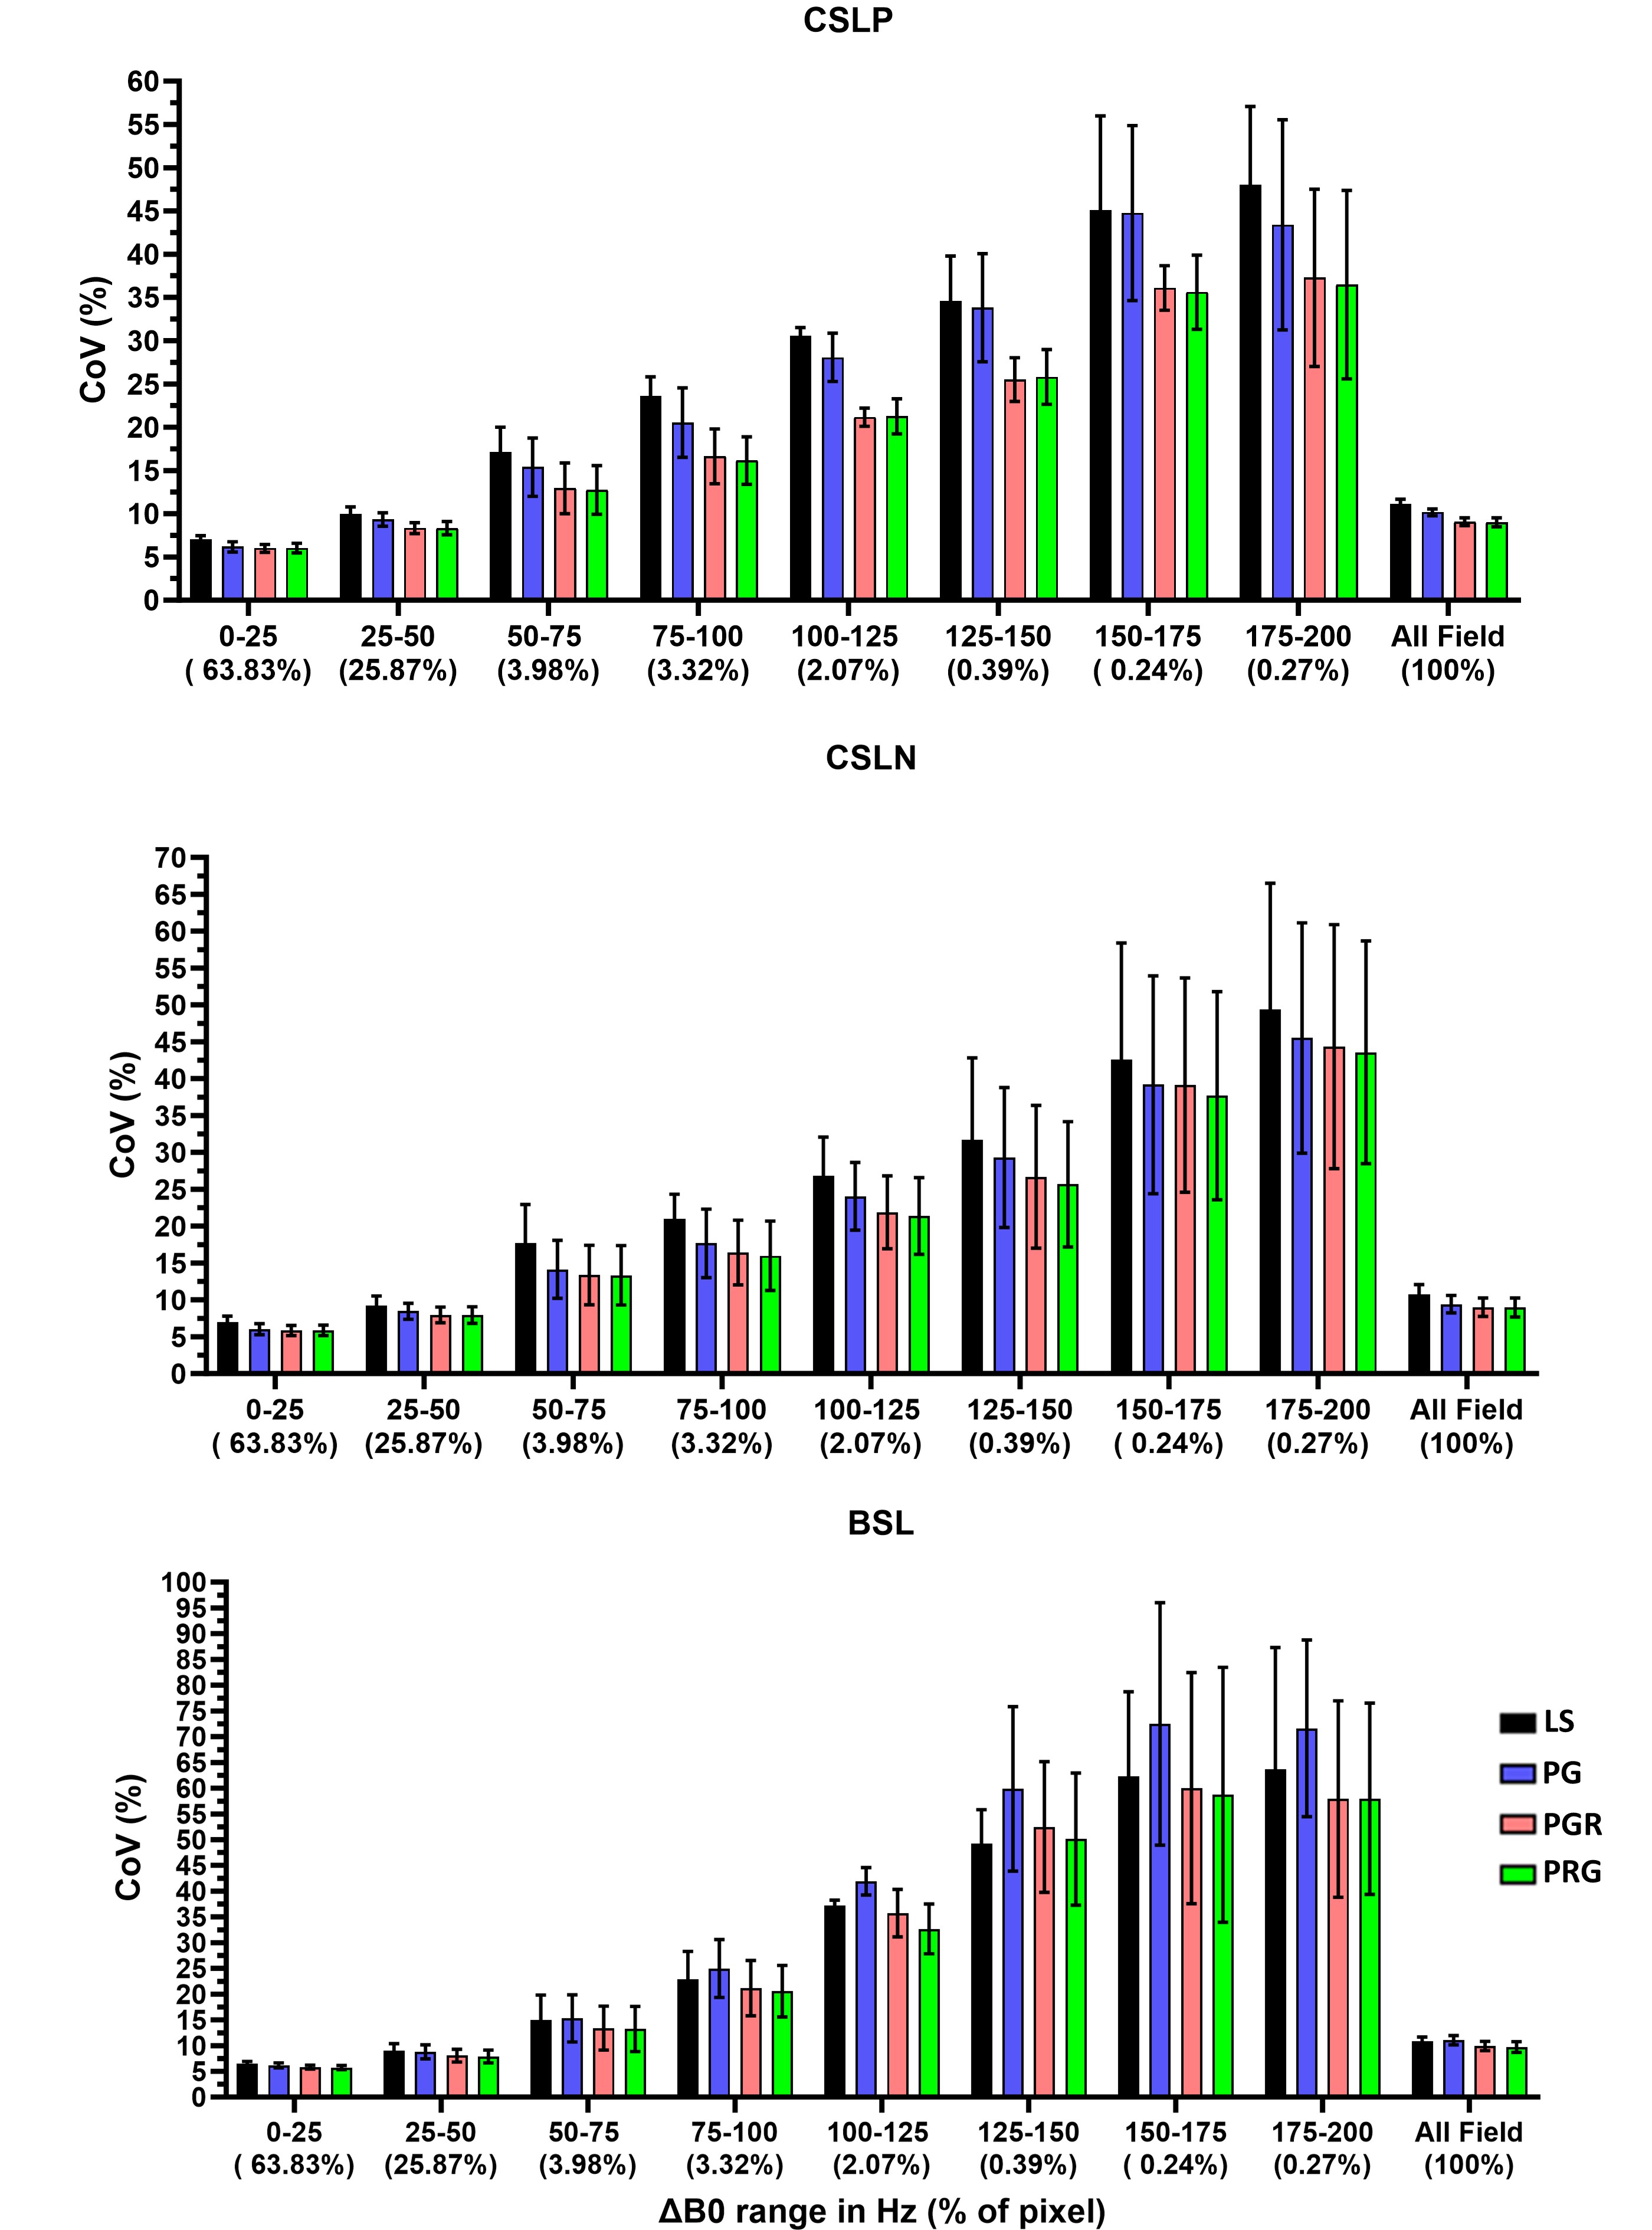
The phantom study presented consistently lower mean CoV for PGR- and PRG-schemes (2.7% and 2.6%) than LS and PG (4.1% and 3.1%) for all cases with different T1rho-preparations and B1-offsets. Moreover, PGR and PRG showed statistically lower COV than PG for B1-scaling=0.8. Figure 3 presents the detailed results with different B1-offsets.Volunteer study also observed lower mean CoV in PGR (9.3%) and PRG (9.2%) compared to LS (10.9%) and PG (10.2%). These differences were higher in large B0-offsets (>50Hz). Figure 4 shows the means CoV of T1rho-values for the three volunteers. The CoV-values were reduced by 30% (CSLP), 24% (CSLN), and 12% (BSL), with the proposed sampling schemes compared to linear-sampling.
DISCUSSION
The reproducibility of T1rho measurements is crucial, especially when considering the increased T1rho variability caused by B0/B1-offsets. This study demonstrated that PGR- and PRG-schemes produce more consistent T1rho measurements compared to LS- and PG-schemes, particularly in scenarios with higher B0/B1 inhomogeneities. It was also confirmed that PG performed better than LS-scheme since it uses higher TSLs to avoid high signal oscillation at lower TSLs. The proposed methods, PGR and PRG, further improved on PG to take advantage of multiple sampling points at high TSLs to average out the oscillation, leading to more consistent T1rho measurement, even with high B0/B1 inhomogeneities. The results consistently showed lower T1rho-quantification variations with PGR- and PRG-schemes, especially with 50-125Hz B0-offsets in the volunteer study, and phantom study with B1-scaling=0.8. Although there were instances where LS- or PG-schemes (BSL-preparation-module) performed slightly better with >125Hz B0-offsets, these cases were rare; over 99% of pixels fell within <125Hz B0-offsets.CONCLUSION
The study demonstrated that the proposed two novel TSL-sampling schemes significantly improved the reproducibility of T1rho-quantification in both phantom and volunteer studies. This makes quantitative T1rho-imaging a promising technique for assessing treatment responses in longitudinal studies.Acknowledgements
The work was supported by NIH Grant R01-AR076328.References
- Li X, Han ET, Busse RF, et al. In vivo T1ρ mapping in cartilage using 3D magnetization‐prepared angle‐modulated partitioned k‐space spoiled gradient echo snapshots (3D MAPSS). Magn Reson Med 2008;59(2):298-307.
- Qi Peng, Can Wu, Li X, et al. Isotropic High-Resolution Brain T1rho Mapping with 3D FLAIR MAPSS at 3T. Proc. Intl. Soc. Mag. Reson. Med. 2020; 28
- Haikun Q, Aurelien B, Thomas K. Respiratory motion-compensated high-resolution 3D whole-heart T1𝜌 mapping. J Cardiovasc Magn Reson. 2020;22(1):12.
- Okuaki T, Takayama Y, Nishie A, et al. T1ρ mapping improvement using stretched-type adiabatic locking pulses for assessment of human liver function at 3 T. Magnetic Resonance Imaging. 2017; 40:17-23.
- Witschey II WR, Borthakur A, Elliott MA, et al. Artifacts in T1ρ-weighted imaging: Compensation for B1 and B0 field imperfections. J Magn Reson 2007; 186(1):75-85.
- Johnson CP, Thedens DR, Magnotta VA. Precision-guided sampling schedules for efficient T1ρ mapping. J Magn Reson Imaging. 2015; 41(1):242-250.
- Gram M, Seethaler M, Gensler D, et al. Balanced spin-lock preparation for B1-insensitive and B0-insensitive quantification of the rotating frame relaxation time T1𝜌. Magn Reson Med. 2021; 85(5):2771-2780.
- C Wu, Q Peng. Novel Sampling Strategy for Improved Reproducibility in Quantitative T1rho Mapping. Proc. AAPM 2021; 63
- Peng Q, Wu C, Kim J, et. Al. Efficient phase‐cycling strategy for high‐resolution 3D gradient‐echo quantitative parameter mapping. NMR in Biomedicine. 2022;35(7):e4700.
- Klein S, Staring M, Murphy K, et. Al. Elastix: a toolbox for intensity-based medical image registration. IEEE Trans Med Imaging. 2010;29(1):196-205. (https://elastix.lumc.nl/)
Figures