3233
Brain metabolism in patients with Tuberous Sclerosis Complex1Radiology, JHU SOM, Baltimore, MD, United States, 2Neurology, Kennedy Krieger Institute, Baltimore, MD, United States
Synopsis
Keywords: Epilepsy, Epilepsy
Motivation: To better understand the underlying pathophysiology of brain lesions in patients with tuberous sclerosis complex (TSC).
Goal(s): To apply both conventional and spectrally-edited MR spectroscopic imaging (MRSI) to patients with TSC, and to quantify metabolite levels in lesions and normal-appearing brain.
Approach: Anatomical MRI and high-resolution MRSI was performed in 9 subjects with TSC at 3T. Spectra were quantified in lesions and normal appearing brain.
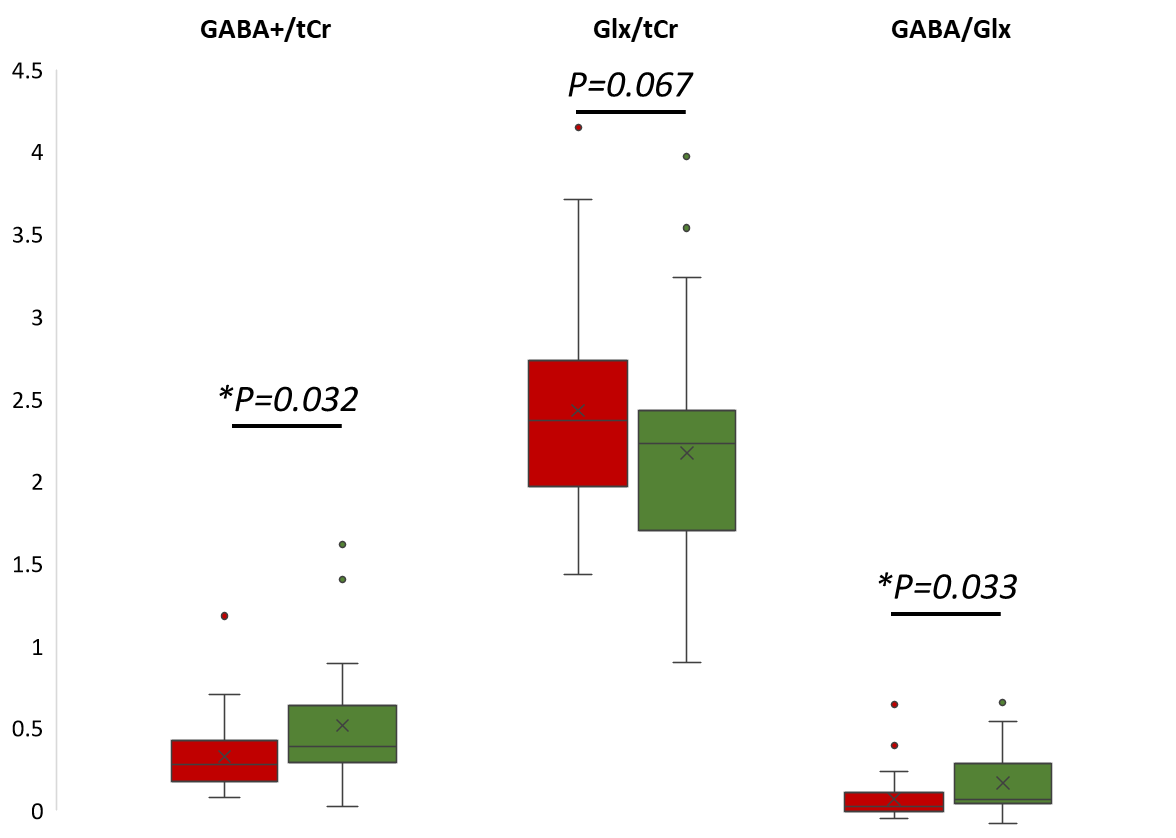
Results: Lesion metabolite levels expressed relative to total creatine showed significant decreases in GABA+ , tNAA and tCho (p < 0.05) compared to normal-appearing white matter. The ratio of GABA+/Glx was also significantly lower in lesions (p = 0.03).
Impact: These preliminary data in 9 subjects suggest that TSC lesions are characterized by neuronal loss or dysfunction, and possible neurotransmitter imbalance. Future work is required to relate these findings to neurological symptoms, including seizure frequency and cognitive impairment.
Introduction
Tuberous Sclerosis Complex (TSC) is a genetic disorder that affects the brain, skin, kidneys, heart, eyes and lungs. There are an estimated 1 million affected individuals worldwide with TSC1. Brain involvement is frequent in TSC, with seizures occurring in more than 80% of patients, as well as a high rate of learning difficulties, cognitive impairment, and behavioral problems. Multifocal brain lesions, including cortical tubers, subependymal nodules and giant-cell astrocytoma, are frequently identified on conventional MRI.Relatively few studies have looked at brain metabolism or neurotransmitter levels in TSC 2, and findings have been variable. The current study reported here applied high-resolution multi-slice MRSI at 3T to investigate brain metabolism in patients with TSC; both conventional- and edited-MRSI scans were performed in order to probe a range of metabolites, including GABA.
Methods
The study was approved by the JHMIRB and each participant, or their legally authorized representative, gave written informed consent. 9 TSC subjects (5M/4F, age 14.8 ± 6.2, min 7, max 31 years) were enrolled. Inclusion criteria included a genetic or clinical diagnosis of TSC according to the 2012 International Tuberous Sclerosis Complex Consensus Conference.A 50-minute MR protocol including anatomical MRI, B0 field maps for 2nd-order shim correction, conventional and GABA-edited multi-slice MRSI, and a water reference MRSI was implemented (Philips 3T ‘Ingenia Elition’, 32-channel head coil). The conventional and edited-MRSI sequences used hypergeometric dualband (HGDB) water and lipid suppression pulses and outer-volume suppression (OVS) 3 . All MRSI scans were performed with three 15mm oblique-axial slices (2.5 mm gap), 14x18 matrix (circular k-space sampling), nominal voxel size 12x12x14 mm (≈2.2 cm3). For GABA-editing, sequence parameters were TR/TE 1.8s/68ms, 4 excitations, edit ON/OFF 1.9/0.7 ppm, BW = 150 Hz, scan time 23m 40s 4. Parameters for conventional MRSI were TR/TE 1.75s/20ms, 1 excitation, scan time 5m 50s; and for water MRSI TR/TE 0.85s/20ms, 1 excitation, scan time 2m 48s. The bottom slice was prescribed at the level of the lateral ventricles, with the top slice at the vertex.
Reconstruction of MRSI data was performed in ‘Osprey’. Retrospective motion compensation was applied on raw k-space data prior to spatial fast Fourier transformation (FFT) as described previously 5. After spatial transformation, coil combination and phase-correction were applied using information from the water reference scan. Metabolite estimates were derived with linear-combination modeling using sequence-specific basis sets and quantified relative to total creatine (tCr). GABA-edited MRSI was analyzed with an optimized LCM approach for GABA-edited spectra 6 . MRSI ROIs in lesions and contralateral normal-appearing white matter were selected based on FLAIR MRI, visualized using the ‘FSLeyes’ software package 7.
Metabolite ratios were compared between lesions and normal appearing contralateral white matter using simple unpaired 2 sample, 1 tailed t-test. The level of significance was set at p < 0.05.
Results
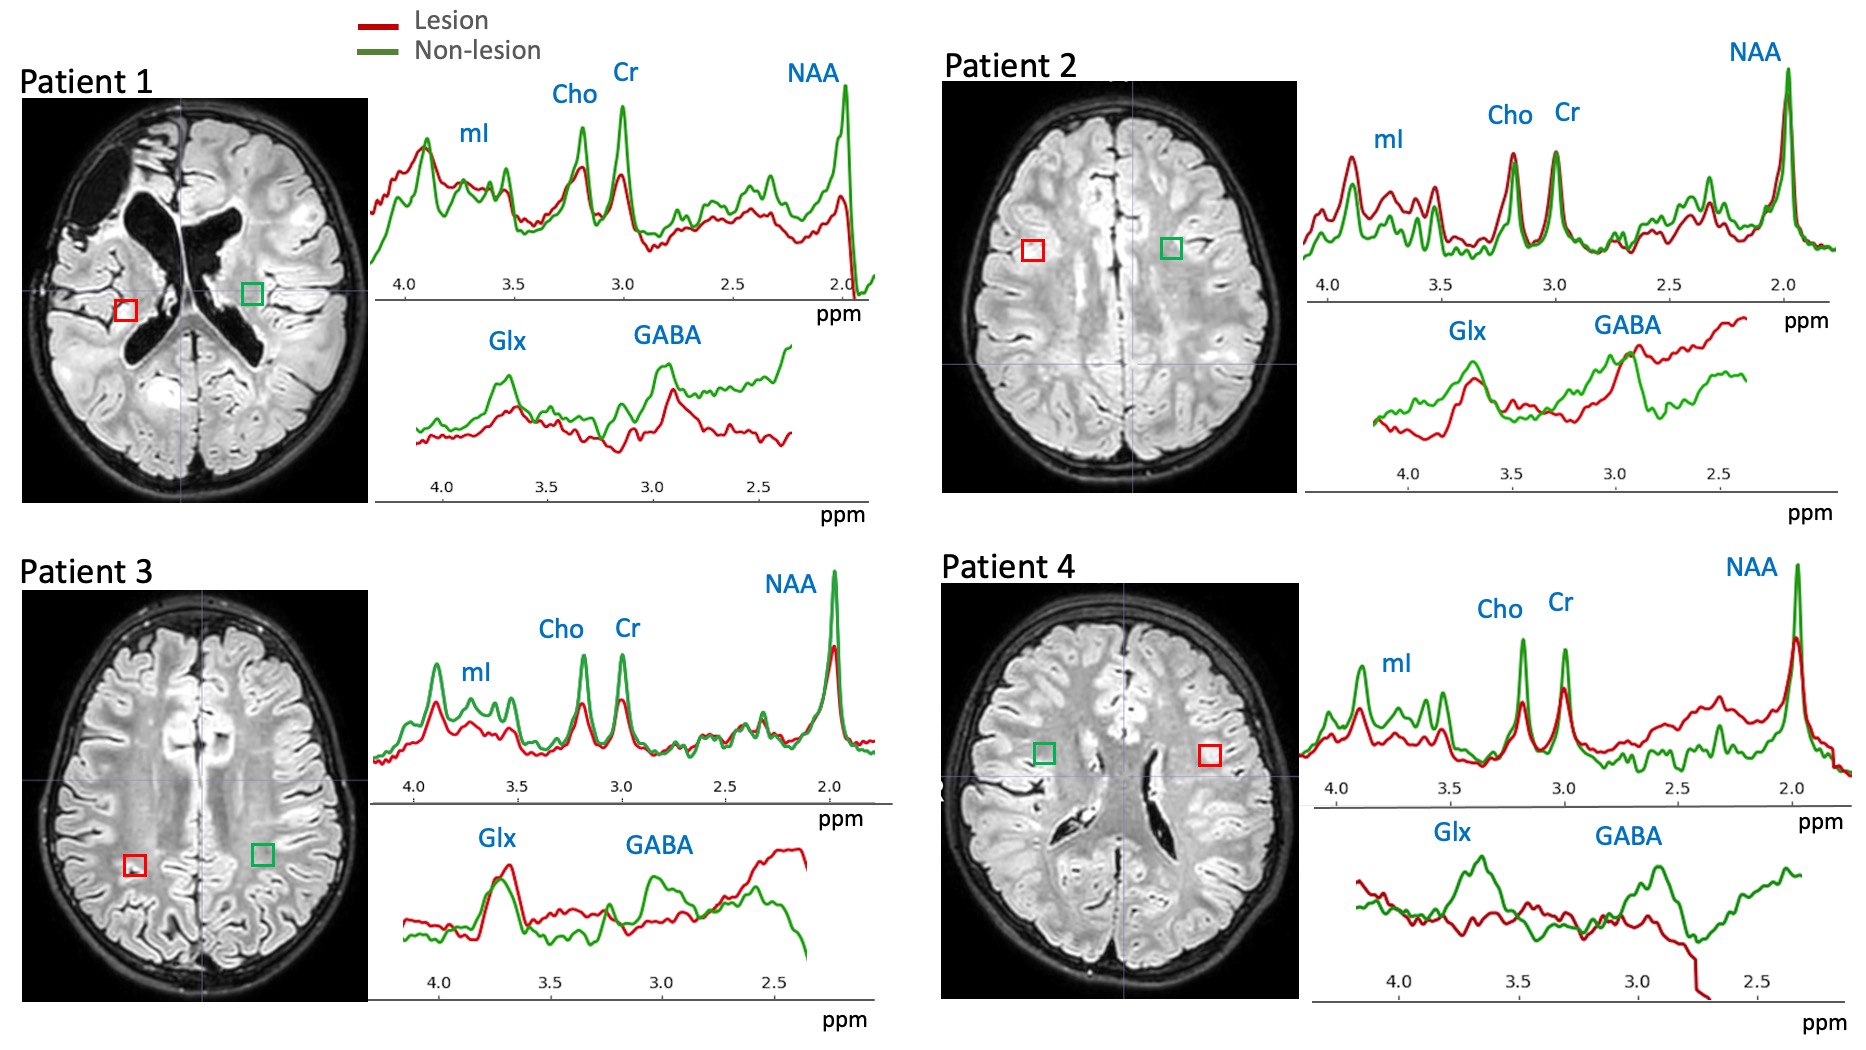
All 9 subjects exhibited brain lesions including subependymal nodules and multiple cortical tubers. Figure 1 shows selected voxel locations and spectra (both for conventional short TE, and GABA-edited) in lesions and contralateral normal-appearing brain in 4 out of the 9 cases. Figure 2 summarizes metabolite ratio results for all 9 cases, both in lesions and normal appearing white matter. It can be seen that overall GABA+ (i.e. GABA + macromolecules, p = 0.03), total NAA (tNAA, p = 0.02), and total choline (tCho, p < 0.002) were lower in lesions, whereas the sum of glutamate and glutamine (Glx, p = 0.07) trended higher. The ratio of GABA/Glx was significantly lower in lesions (p = 0.03). Myo-inositol (mI) was not significantly different between lesions and normal-appearing white matter (p = 0.49).Discussion
These preliminary data in 9 subjects indicate that TSC lesions are characterized by neuronal loss or dysfunction (lower tNAA). Interestingly, GABA+ was reduced while Glx was increased (and the ratio of GABA+/Glx decreased), suggesting that there may be an imbalance in inhibitory/excitatory neurotransmission in TSC lesions. Further work is needed to investigate if this is related to neurological symptoms, including frequency of seizures, and performance on neuropsychological tests.Acknowledgements
Supported by DOD W81XWH2010819, and NIH R01EB028259 and P41EB031771. We thank the Johns Hopkins IDDRC for support for neuropsychological testing.References
1. Northrup H, Krueger DA, International Tuberous Sclerosis Complex Consensus G. Tuberous sclerosis complex diagnostic criteria update: recommendations of the 2012 Iinternational Tuberous Sclerosis Complex Consensus Conference. Pediatr Neurol. 2013 Oct;49(4):243-54.
2. N. Matsuo, A. Imamura, R. Ito, K. Sugawara, Y. Takahashi, N. Kondo. The Correlation between 1H-MR Spectroscopy and Clinical Manifestation with Tuberous Sclerosis Complex. Neuropediatrics 2007; 38: 126–129
3. Zhu H, Ouwerkerk R, Barker PB. Dual-band water and lipid suppression for MR spectroscopic imaging at 3 Tesla. Magn Reson Med 2010;63(6):1486-1492.
4. Zhu H, Edden RA, Ouwerkerk R, Barker PB. High resolution spectroscopic imaging of GABA at 3 Tesla. Magn Reson Med 2011;65(3):603-609.2.
5. Chan KL, Barker PB. Retrospective motion compensation for edited MR spectroscopic imaging. Neuroimage 2019; 202:116141.3.
6. Zollner HJ, Tapper S, Hui SCN, Barker PB, Edden RAE, Oeltzschner G. Comparison of linear combination modeling strategies for edited magnetic resonance spectroscopy at 3 T. NMR Biomed 2022;35(1): e4618.
7. https://git.fmrib.ox.ac.uk/fsl/fsleyes/fsleyes/
Figures